×
Hero Background
English
Chinese
French
Japanese
Korean
German
Spanish

Precipitated Silica Market Share

ID: MRFR/CnM/1468-CR
200 Pages
Chitranshi Jaiswal
June 2025

Precipitated Silica Market Research Report By Process (Dry Process, Wet Process, Pyrogenic (Fumed) Process), By Source (Natural Sources, Synthetic Source, Recycled Sources, Byproduct Sources, Specialty Sources), By Grade (Standard Grade, High Purity Grade, Ultrafine Grade, Food Grade, Industrial Grade), By Application (Additives, Free Flow Agents, Adsorbents, Catalysts, Others), By End-Use (Automotive, Electronics, Construction, Agriculture, Rubber and Plastics, Food and Beverage, Healthcare and Pharmaceuticals, Others) and By Regional (Nort... read more

Share:
Download PDF ×

We do not share your information with anyone. However, we may send you emails based on your report interest from time to time. You may contact us at any time to opt-out.

Precipitated Silica Market Infographic
Purchase Options

Market Share

Precipitated Silica Market Share Analysis

Companies that sell precipitated silica are always trying to add new products to their lines to meet the needs of different industries, like rubber, agriculture, food and drinks, and pharmaceuticals." By providing a wide range of precipitated silica goods with unique features, functions, and uses, companies can target a wider range of customers and place themselves as flexible solution providers in numerous industries. An important part of market share positioning is strategically dividing target customers into groups. Companies that make precipitated silica study certain industries and uses to make sure their products work well. For instance, companies in the rubber industry might offer personalized grades of precipitated silica to help tires work better, and companies in the food industry might give goods with high purity levels to meet the specific needs of the food industry. This focused approach helps you get a bigger share of the market in each area. To get a bigger share of the market, businesses look for ways to grow internationally. This means going to new places where the need for precipitated silica is growing or where there is a market that hasn't been studied yet. By having a footprint all over the world, businesses can reach more customers, get into growth areas, and escape the risks that come with unstable regional economies. You can also get a bigger share of the global market through strategic partnerships and agreements. For market share standing, it's important to build strong, long-term relationships with clients. To take a customer-centered approach, you need to know what your customers want, be able to help them with technology issues, and promise consistent product quality. Because environmental problems are getting worse, companies that make precipitated silica are now putting more emphasis on being environmentally friendly in their marketing. Companies use production methods that are better for the environment, look into reusable raw materials, and make silicon products that are better for the environment. When businesses use sustainable methods, they align themselves with global environmental trends and show that they are responsible and ahead of the curve in their field. When businesses talk about these green efforts, it could help their image and bring in people who care about the environment. "The precipitated silica market is growing quickly because more tires need them.""

Author
Chitranshi Jaiswal
Research Analyst Level I

In her 3 years of experience in the market research field, she has handled critical cross-domain projects. She has an in-depth knowledge of market estimation & analysis, problem-solving, primary as well as secondary research, and team management.She holds an engineering degree and is an MBA professional from a well-known university, capable of evaluating the market and competitive conditions. An exceptional strategist with excellent communication skills and a passion for delivering cutting-edge & practical insights for the market. Proficient in multi-tasking, and can successfully deal with competing demands, while maintaining complete confidentiality. Generated business through active client and project development, networking, and high-quality responses. Her knowledge and skills have helped in making solid business decisions, securing funding from investors, and avoiding business failures.

Leave a Comment

FAQs

What is the projected market valuation of the Precipitated Silica Market by 2035?

The Precipitated Silica Market is projected to reach approximately 5.343 USD Billion by 2035.

What was the market valuation of the Precipitated Silica Market in 2024?

In 2024, the overall market valuation of the Precipitated Silica Market was 3.5 USD Billion.

What is the expected CAGR for the Precipitated Silica Market during the forecast period 2025 - 2035?

The expected CAGR for the Precipitated Silica Market during the forecast period 2025 - 2035 is 3.92%.

Which companies are considered key players in the Precipitated Silica Market?

Key players in the Precipitated Silica Market include Evonik Industries, Cabot Corporation, and Wacker Chemie AG.

What are the main processes used in the production of precipitated silica?

The main processes for producing precipitated silica include Dry Process, Wet Process, and Pyrogenic (Fumed) Process.

How does the market for synthetic sources of precipitated silica compare to natural sources?

In 2024, the market for synthetic sources was valued at 1.4 USD Billion, while natural sources were valued at 0.875 USD Billion.

What applications are driving the demand for precipitated silica?

Applications such as rubber and plastics, additives, and adsorbents are driving demand in the Precipitated Silica Market.

What is the valuation of the automotive segment within the Precipitated Silica Market?

The automotive segment was valued at 0.7 USD Billion in 2024 and is expected to grow in the coming years.

What grades of precipitated silica are available in the market?

Available grades of precipitated silica include Standard Grade, High Purity Grade, and Food Grade, among others.

Market Summary

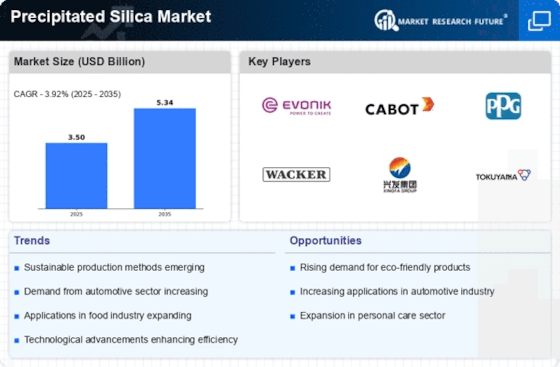
As per MRFR analysis, the Precipitated Silica Market Size was estimated at 3.5 USD Billion in 2024. The Precipitated Silica industry is projected to grow from 3.637 USD Billion in 2025 to 5.343 USD Billion by 2035, exhibiting a compound annual growth rate (CAGR) of 3.92 during the forecast period 2025 - 2035.

Key Market Trends & Highlights

The Precipitated Silica Market is poised for growth driven by sustainability and technological advancements.

  • North America remains the largest market for precipitated silica, driven by robust demand across various industries. The Asia-Pacific region is emerging as the fastest-growing market, fueled by increasing industrialization and consumer demand. The Dry Process segment continues to dominate the market, while the Wet Process segment is experiencing rapid growth due to its efficiency. Rising demand in the automotive sector and expansion in personal care products are key drivers propelling market growth.

Market Size & Forecast

2024 Market Size 3.5 (USD Billion)
2035 Market Size 5.343 (USD Billion)
CAGR (2025 - 2035) 3.92%
Largest Regional Market Share in 2024 Asia Pacific

Major Players

<p>Evonik Industries (DE), Cabot Corporation (US), PPG Industries (US), Wacker Chemie AG (DE), Hubei Xingfa Chemicals Group Co., Ltd. (CN), Tokuyama Corporation (JP), Solvay S.A. (BE), Orisil (IN), Fujian Zhanhua Chemical Co., Ltd. (CN)</p>

Market Trends

The Precipitated Silica Market is currently experiencing a dynamic phase characterized by evolving applications and increasing demand across various industries. This material, known for its unique properties such as high surface area and absorbent capabilities, finds extensive use in rubber, coatings, and personal care products. As industries seek to enhance product performance and sustainability, precipitated silica emerges as a preferred choice, potentially driving innovation and growth. Furthermore, the market appears to be influenced by a growing emphasis on eco-friendly materials, prompting manufacturers to explore sustainable production methods and formulations. In addition to sustainability, the Precipitated Silica Market is witnessing advancements in technology that enhance production efficiency and product quality. Innovations in manufacturing processes may lead to the development of specialized grades of silica tailored for specific applications, thereby expanding market reach. The increasing focus on health and safety regulations also plays a role in shaping market dynamics, as companies strive to comply with stringent standards while meeting consumer expectations. Overall, the Precipitated Silica Market seems poised for continued evolution, driven by a combination of technological advancements and shifting consumer preferences.

Sustainability Initiatives

The Precipitated Silica Market is increasingly influenced by sustainability initiatives, as manufacturers seek to reduce environmental impact. This trend involves the adoption of eco-friendly production methods and the development of biodegradable products, aligning with global efforts to promote greener practices.

Technological Advancements

Technological advancements are reshaping the Precipitated Silica Market, with innovations in production processes enhancing efficiency and product quality. These developments may lead to the creation of specialized silica grades, catering to diverse industry needs and expanding market opportunities.

Regulatory Compliance

Regulatory compliance is becoming a critical factor in the Precipitated Silica Market, as companies navigate stringent health and safety standards. This trend compels manufacturers to prioritize safety in their products, ensuring they meet consumer expectations while adhering to regulations.

Precipitated Silica Market Market Drivers

Increasing Regulatory Standards

The Precipitated Silica Market is also shaped by the rising regulatory standards concerning product safety and environmental impact. Governments and regulatory bodies are implementing stricter guidelines for the use of additives in various industries, including food, cosmetics, and automotive. Compliance with these regulations is essential for manufacturers, prompting them to seek high-quality precipitated silica that meets safety and performance criteria. This trend is likely to drive innovation and investment in the Precipitated Silica Market, as companies strive to enhance their product offerings while adhering to regulatory requirements. The emphasis on safety and sustainability may lead to a more competitive landscape, ultimately benefiting consumers and the industry as a whole.

Rising Demand in Automotive Sector

The Precipitated Silica Market is experiencing a notable surge in demand from the automotive sector. This increase is primarily driven by the growing need for lightweight materials that enhance fuel efficiency and reduce emissions. Precipitated silica is utilized in tire manufacturing, where it improves wet traction and rolling resistance. According to recent estimates, the automotive industry accounts for a substantial share of the precipitated silica consumption, with projections indicating a compound annual growth rate of approximately 5% over the next few years. As automotive manufacturers continue to prioritize sustainability and performance, the demand for precipitated silica is likely to rise, further solidifying its role in the Precipitated Silica Market.

Expansion in Personal Care Products

The Precipitated Silica Market is witnessing significant growth due to its increasing application in personal care products. Silica is widely used as a thickening agent, anti-caking agent, and absorbent in cosmetics and skincare formulations. The rising consumer awareness regarding personal grooming and hygiene is propelling the demand for high-quality personal care products, which in turn drives the need for precipitated silica. Market data suggests that the personal care segment is expected to grow at a rate of around 4% annually, reflecting the industry's shift towards innovative and effective formulations. This trend indicates a promising future for the Precipitated Silica Market as manufacturers seek to enhance product performance and consumer satisfaction.

Growth in Food and Beverage Applications

The Precipitated Silica Market is benefiting from its expanding use in the food and beverage sector. Silica serves as an anti-caking agent and a flow agent in powdered food products, ensuring consistency and quality. The increasing demand for processed and packaged foods is driving the need for effective additives, including precipitated silica. Recent market analysis indicates that the food and beverage segment is projected to grow at a rate of approximately 3.5% per year, highlighting the potential for precipitated silica to play a crucial role in maintaining product integrity. As consumer preferences shift towards convenience and quality, the Precipitated Silica Market is likely to see sustained growth in this application area.

Technological Innovations in Manufacturing

Technological advancements in the manufacturing processes of precipitated silica are significantly influencing the Precipitated Silica Market. Innovations such as improved precipitation techniques and enhanced purification methods are leading to higher quality products with better performance characteristics. These advancements not only increase production efficiency but also reduce environmental impact, aligning with the industry's sustainability goals. As manufacturers adopt these technologies, the overall supply chain becomes more robust, potentially lowering costs and increasing accessibility. The ongoing research and development efforts in this field suggest that the Precipitated Silica Market will continue to evolve, driven by the need for superior products and sustainable practices.

Market Segment Insights

By Process: Dry Process (Largest) vs. Wet Process (Fastest-Growing)

<p>In the Precipitated Silica Market, the Dry Process segment holds the largest share, comprising a significant portion of the market due to its efficiency and cost-effectiveness. The Wet Process segment, while smaller, is rapidly gaining traction as manufacturers seek sustainable and environmentally friendly production techniques. The Pyrogenic (Fumed) Process, though a niche player, offers unique properties, catering to specialized applications within the industry. As such, market share distribution reveals a clear hierarchy of dominance and growth potential among these processes.</p>

<p>Dry Process: Dominant vs. Wet Process: Emerging</p>

<p>The Dry Process is recognized as the dominant method in precipitated silica production, boasting superior efficiency and lower operational costs, making it a favorable choice for many manufacturers. In contrast, the Wet Process is emerging as a viable alternative, driven by a growing demand for sustainability in industrial practices. Its ability to produce high-purity silica with minimal environmental impact appeals to eco-conscious enterprises. The Pyrogenic (Fumed) Process, while less prevalent, serves specialized industries requiring high-performance silica, demonstrating the diversity in production techniques within the market.</p>

By Source: Natural Sources (Largest) vs. Synthetic Sources (Fastest-Growing)

<p>In the Precipitated Silica Market, the distribution of market share among various sources reveals a significant dominance of Natural Sources, which continually appeal to environmentally conscious consumers and industries. This segment has established itself firmly due to its abundant availability and sustainable extraction methods. Conversely, Synthetic Sources are emerging rapidly, reflecting innovative advancements in manufacturing processes that enhance performance characteristics, making them increasingly appealing to high-end applications.</p>

<p>Natural Sources (Dominant) vs. Synthetic Sources (Emerging)</p>

<p>Natural Sources of precipitated silica are characterized by their eco-friendliness and sustainability, fulfilling the growing demand for green products. They primarily originate from natural silica deposits and provide unique properties like high purity and low environmental impact. On the other hand, <a href="https://www.marketresearchfuture.com/reports/synthetic-leather-market-4403">Synthetic</a> Sources are gaining traction as an emerging alternative, driven by technological innovations that allow for tailored properties to meet specific industrial needs. These synthetics benefit from controlled production processes, leading to high consistency and specialized applications, making them attractive for industries requiring precise specifications.</p>

By Grade: Standard Grade (Largest) vs. High Purity Grade (Fastest-Growing)

<p>In the Precipitated Silica Market, the Standard Grade holds the largest market share, benefiting from its widespread application in various industries including rubber, coatings, and plastics. Its established demand and versatility make it a prevalent choice across multiple sectors. The High Purity Grade, while not the largest, is quickly gaining traction due to its specialized uses in high-end applications such as electronics and pharmaceuticals, signaling a shift towards more refined silica products.</p>

<p>Grade: Standard (Dominant) vs. High Purity (Emerging)</p>

<p>The Standard Grade of precipitated silica is well-established in the market, showcasing a robust influence due to its cost-effectiveness and multifunctionality in applications such as tires and industrial coatings. Conversely, the High Purity Grade, characterized by its exceptional cleanliness and lack of contaminants, is observing a rapidly increasing demand within industries requiring stringent quality standards. This grade is emerging as a preferred option in sectors like electronics, where high-performance materials are essential. As industries evolve, the divergence in application potentials reveals that while Standard Grade remains a dominant force, High Purity Grade is carving out its niche with significant growth prospects.</p>

By Application: Additives (Largest) vs. Free Flow Agents (Fastest-Growing)

<p>In the Precipitated Silica Market, the application segment is primarily characterized by additives, which hold a significant share due to their widespread use in various industries such as rubber, coatings, and plastics. Free flow agents follow closely, capturing attention for their rising influence in food and pharmaceuticals, where they serve essential roles in improving flow characteristics and preventing caking. The other application values, such as adsorbents and catalysts, although essential, contribute to a smaller portion of the market, making the landscape competitive yet dominated by additive applications.</p>

<p>Additives (Dominant) vs. Free Flow Agents (Emerging)</p>

<p>Additives in the Precipitated Silica Market represent a dominant force, utilized extensively in sectors like rubber and coatings due to their enhanced performance characteristics, such as improved durability and moisture control. On the other hand, free flow agents are emerging rapidly, particularly in the food and pharmaceutical sectors, where they facilitate product stability and enhance processing efficiency. The demand for additives is driven by their proven effectiveness and versatility, while the growth of free flow agents is supported by stringent quality standards and innovations in food technology, making these segments critical for future market development.</p>

By End-Use: Rubber and Plastics (Largest) vs. Electronics (Fastest-Growing)

<p>In the Precipitated Silica Market, the 'End-Use' segment showcases a diverse distribution of applications, with Rubber and Plastics leading due to their extensive utilization in tire manufacturing and other automotive components. This segment holds a substantial market share, attributed to the enduring demand from the automotive industry and other sectors reliant on rubber products. Conversely, Electronics, while currently smaller in market share, is emerging rapidly due to the increasing need for high-performance materials in electronic devices, contributing significantly to the segment's growth dynamics.</p>

<p>Rubber and Plastics: Dominant vs. Electronics: Emerging</p>

<p>Rubber and Plastics dominate the Precipitated Silica Market as they are integral to the production of tires and various automotive components, providing essential properties such as strength, durability, and flexibility. This segment benefits from consistent demand linked to the automotive industry's growth, as well as other applications in consumer goods. In contrast, the Electronics segment is considered emerging, driven by technological advancements and the rising requirement for high-quality materials in electronic applications. Innovations in this sector are paving the way for higher-performance precipitated silica, which enhances product efficiency and sustainability, thus making it a fast-growing segment with significant market potential.</p>

Get more detailed insights about Precipitated Silica Market Research Report – Forecast till 2035

Regional Insights

North America : Innovation and Demand Surge

North America is witnessing robust growth in the precipitated silica market, driven by increasing demand in the automotive and consumer goods sectors. The region holds approximately 35% of the global market share, making it the largest market. Regulatory support for sustainable materials and innovations in manufacturing processes are key catalysts for this growth. The rising focus on eco-friendly products is further propelling demand for precipitated silica. The United States and Canada are the leading countries in this region, with major players like Evonik Industries and Cabot Corporation dominating the market. The competitive landscape is characterized by continuous innovation and strategic partnerships among key players. The presence of advanced manufacturing facilities and a strong distribution network enhances market accessibility, ensuring a steady supply of precipitated silica to meet growing demands.

Europe : Sustainability and Innovation Focus

Europe is emerging as a significant player in the precipitated silica market, driven by stringent environmental regulations and a strong push for sustainable materials. The region accounts for approximately 30% of the global market share, making it the second-largest market. Regulatory frameworks aimed at reducing carbon footprints and promoting eco-friendly products are key growth drivers. The increasing demand for precipitated silica in the rubber and tire industries is also notable, as manufacturers seek to enhance product performance while adhering to sustainability goals. Germany, France, and the UK are leading countries in this market, with companies like Wacker Chemie AG and Solvay S.A. playing pivotal roles. The competitive landscape is marked by innovation and collaboration among industry players to develop advanced silica solutions. The presence of established manufacturing hubs and research institutions further strengthens the region's market position, fostering continuous advancements in precipitated silica applications.

Asia-Pacific : Rapid Industrialization and Growth

Asia-Pacific is rapidly becoming a powerhouse in the precipitated silica market, driven by industrialization and increasing demand from various sectors, including automotive and electronics. The region holds approximately 25% of the global market share, with China and India being the largest contributors. The growing focus on enhancing product quality and performance in manufacturing processes is a significant driver of market growth. Additionally, favorable government policies and investments in infrastructure are expected to further boost demand for precipitated silica in the coming years. China is the leading country in this region, with companies like Hubei Xingfa Chemicals and Fujian Zhanhua Chemical Co., Ltd. dominating the market. The competitive landscape is characterized by a mix of local and international players, with a strong emphasis on innovation and cost-effective production methods. The presence of a large consumer base and increasing industrial activities are key factors driving the growth of the precipitated silica market in Asia-Pacific.

Middle East and Africa : Emerging Markets and Opportunities

The Middle East and Africa region is witnessing emerging opportunities in the precipitated silica market, driven by increasing industrial activities and a growing focus on sustainable materials. The region holds approximately 10% of the global market share, with countries like South Africa and the UAE leading the way. The demand for precipitated silica in various applications, including construction and personal care, is on the rise, supported by government initiatives aimed at diversifying economies and promoting local manufacturing. South Africa is a key player in this market, with a growing number of local manufacturers entering the precipitated silica space. The competitive landscape is evolving, with both regional and international companies vying for market share. The presence of abundant natural resources and a young workforce presents significant growth potential for the precipitated silica market in the Middle East and Africa, paving the way for future investments and innovations.

Key Players and Competitive Insights

The Precipitated Silica Market is currently characterized by a dynamic competitive landscape, driven by increasing demand across various industries such as rubber, plastics, and personal care. Key players are actively engaging in strategies that emphasize innovation, regional expansion, and sustainability. Notably, Evonik Industries (Germany) has positioned itself as a leader in specialty chemicals, focusing on enhancing its product portfolio through research and development. Similarly, Cabot Corporation (US) is leveraging its technological expertise to optimize its manufacturing processes, thereby improving efficiency and reducing environmental impact. These strategic initiatives collectively contribute to a competitive environment that is increasingly focused on value creation and sustainability.

In terms of business tactics, companies are localizing manufacturing to better serve regional markets and optimize supply chains. The Precipitated Silica Market appears moderately fragmented, with several key players exerting influence over their respective segments. This fragmentation allows for a diverse range of products and innovations, although it also necessitates that companies remain agile and responsive to market changes. The collective influence of these key players shapes the market structure, fostering a competitive atmosphere that encourages continuous improvement and adaptation.

In August 2025, Wacker Chemie AG (Germany) announced the expansion of its precipitated silica production facility in the United States. This strategic move is expected to enhance its capacity to meet growing demand in North America, particularly in the automotive and consumer goods sectors. The expansion not only signifies Wacker's commitment to regional growth but also reflects a broader trend of companies investing in local production capabilities to mitigate supply chain disruptions.

In September 2025, Solvay S.A. (Belgium) unveiled a new line of sustainable precipitated silica products aimed at reducing carbon emissions during production. This initiative aligns with the increasing emphasis on sustainability within the industry and positions Solvay as a forward-thinking player committed to environmental stewardship. By introducing eco-friendly alternatives, Solvay is likely to attract environmentally conscious customers and enhance its competitive edge.

In October 2025, Tokuyama Corporation (Japan) entered into a strategic partnership with a leading automotive manufacturer to develop specialized silica solutions for tire applications. This collaboration is indicative of the growing trend towards innovation in product development, as companies seek to create tailored solutions that meet specific industry needs. Such partnerships not only enhance product offerings but also strengthen market positioning through shared expertise and resources.

As of October 2025, the Precipitated Silica Market is witnessing significant trends such as digitalization, sustainability, and the integration of artificial intelligence in production processes. Strategic alliances are increasingly shaping the competitive landscape, enabling companies to pool resources and innovate more effectively. Looking ahead, it is anticipated that competitive differentiation will evolve, with a shift from traditional price-based competition towards a focus on innovation, technological advancement, and supply chain reliability. This evolution underscores the importance of adaptability and forward-thinking strategies in maintaining a competitive edge.

Key Companies in the Precipitated Silica Market market include

Industry Developments

  • Q2 2024: Evonik opens new precipitated silica plant in South Carolina to meet growing demand from tire industry Evonik Industries inaugurated a new manufacturing facility for precipitated silica in Charleston, South Carolina, aimed at supplying the North American tire industry with high-performance silica for fuel-efficient tires.
  • Q1 2024: PPG expands precipitated silica production capacity at Lake Charles, Louisiana plant PPG Industries announced the completion of a capacity expansion at its Lake Charles facility, increasing output of precipitated silica to support growth in the automotive and industrial rubber sectors.
  • Q2 2024: Solvay launches new high-dispersibility precipitated silica for energy-efficient tires Solvay introduced a new grade of high-dispersibility precipitated silica designed to enhance rolling resistance and wet grip in next-generation energy-efficient tires.
  • Q3 2024: Denka announces partnership with Japanese automaker for supply of advanced precipitated silica Denka Company Limited entered into a multi-year supply agreement with a major Japanese automotive manufacturer to provide advanced precipitated silica for use in eco-friendly tire production.
  • Q2 2024: Huber Engineered Materials appoints new Vice President for Silica Business Unit Huber Engineered Materials named a new Vice President to lead its Silica Business Unit, focusing on strategic growth and innovation in precipitated silica applications.
  • Q1 2025: Oriental Silicas Corporation opens new research and development center for precipitated silica in Taiwan Oriental Silicas Corporation inaugurated a state-of-the-art R&D center in Taiwan dedicated to developing advanced precipitated silica products for the electronics and personal care industries.
  • Q2 2025: W.R. Grace & Co. secures major contract to supply precipitated silica to leading global toothpaste manufacturer W.R. Grace & Co. announced a multi-year supply agreement with a top global oral care company to provide precipitated silica for use in toothpaste formulations.
  • Q3 2024: PQ Corporation completes upgrade of precipitated silica production line in Kansas PQ Corporation completed a significant upgrade to its Kansas production facility, increasing efficiency and capacity for precipitated silica used in food and industrial applications.
  • Q2 2024: Madhu Silica Pvt. Ltd. announces expansion of precipitated silica exports to Europe Madhu Silica Pvt. Ltd. expanded its export operations, signing new distribution agreements to supply precipitated silica to several European countries for use in rubber and personal care products.
  • Q1 2025: Covia Holdings LLC launches new eco-friendly precipitated silica product line for paints and coatings Covia Holdings LLC introduced a new line of environmentally friendly precipitated silica products targeting the paints and coatings industry, emphasizing sustainability and performance.
  • Q2 2025: Anten Chemical Co. Ltd. announces strategic partnership with South Korean electronics manufacturer Anten Chemical Co. Ltd. entered into a strategic partnership with a major South Korean electronics company to develop and supply high-purity precipitated silica for battery separator applications.
  • Q3 2024: QUECHEN opens new precipitated silica plant in Vietnam to serve Southeast Asian market QUECHEN inaugurated a new manufacturing facility in Vietnam, expanding its footprint in Southeast Asia and increasing supply of precipitated silica for regional tire and industrial customers.


Future Outlook

Precipitated Silica Market Future Outlook

<p>The Precipitated Silica Market is projected to grow at a 3.92% CAGR from 2024 to 2035, driven by increasing demand in automotive and consumer goods sectors.</p>

New opportunities lie in:

  • <p>Expansion into bio-based silica production methods</p><p>Development of specialized silica for high-performance tires</p><p>Strategic partnerships with manufacturers in emerging markets</p>

<p>By 2035, the market is expected to achieve robust growth, solidifying its position in various industrial applications.</p>

Market Segmentation

Precipitated Silica Market Grade Outlook

  • Standard Grade
  • High Purity Grade
  • Ultrafine Grade
  • Food Grade
  • Industrial Grade

Precipitated Silica Market Source Outlook

  • Natural Sources
  • Synthetic Sources
  • Recycled Sources
  • Byproduct Sources
  • Specialty Sources

Precipitated Silica Market End-Use Outlook

  • Automotive
  • Electronics
  • Construction
  • Agriculture
  • Rubber and Plastics
  • Food and Beverage
  • Healthcare and Pharmaceuticals
  • Others

Precipitated Silica Market Process Outlook

  • Dry Process
  • Wet Process
  • Pyrogenic (Fumed) Process

Precipitated Silica Market Application Outlook

  • Additives
  • Free Flow Agents
  • Adsorbents
  • Catalysts
  • Others

Report Scope

MARKET SIZE 20243.5(USD Billion)
MARKET SIZE 20253.637(USD Billion)
MARKET SIZE 20355.343(USD Billion)
COMPOUND ANNUAL GROWTH RATE (CAGR)3.92% (2024 - 2035)
REPORT COVERAGERevenue Forecast, Competitive Landscape, Growth Factors, and Trends
BASE YEAR2024
Market Forecast Period2025 - 2035
Historical Data2019 - 2024
Market Forecast UnitsUSD Billion
Key Companies ProfiledMarket analysis in progress
Segments CoveredMarket segmentation analysis in progress
Key Market OpportunitiesGrowing demand for eco-friendly products drives innovation in the Precipitated Silica Market.
Key Market DynamicsRising demand for eco-friendly products drives innovation and competition in the precipitated silica market.
Countries CoveredNorth America, Europe, APAC, South America, MEA

FAQs

What is the projected market valuation of the Precipitated Silica Market by 2035?

The Precipitated Silica Market is projected to reach approximately 5.343 USD Billion by 2035.

What was the market valuation of the Precipitated Silica Market in 2024?

In 2024, the overall market valuation of the Precipitated Silica Market was 3.5 USD Billion.

What is the expected CAGR for the Precipitated Silica Market during the forecast period 2025 - 2035?

The expected CAGR for the Precipitated Silica Market during the forecast period 2025 - 2035 is 3.92%.

Which companies are considered key players in the Precipitated Silica Market?

Key players in the Precipitated Silica Market include Evonik Industries, Cabot Corporation, and Wacker Chemie AG.

What are the main processes used in the production of precipitated silica?

The main processes for producing precipitated silica include Dry Process, Wet Process, and Pyrogenic (Fumed) Process.

How does the market for synthetic sources of precipitated silica compare to natural sources?

In 2024, the market for synthetic sources was valued at 1.4 USD Billion, while natural sources were valued at 0.875 USD Billion.

What applications are driving the demand for precipitated silica?

Applications such as rubber and plastics, additives, and adsorbents are driving demand in the Precipitated Silica Market.

What is the valuation of the automotive segment within the Precipitated Silica Market?

The automotive segment was valued at 0.7 USD Billion in 2024 and is expected to grow in the coming years.

What grades of precipitated silica are available in the market?

Available grades of precipitated silica include Standard Grade, High Purity Grade, and Food Grade, among others.

  1. SECTION I: EXECUTIVE SUMMARY AND KEY HIGHLIGHTS
    1. EXECUTIVE SUMMARY
      1. Market Overview
      2. Key Findings
      3. Market Segmentation
      4. Competitive Landscape
      5. Challenges and Opportunities
      6. Future Outlook
  2. SECTION II: SCOPING, METHODOLOGY AND MARKET STRUCTURE
    1. MARKET INTRODUCTION
      1. Definition
      2. Scope of the study
    2. RESEARCH METHODOLOGY
      1. Overview
      2. Data Mining
      3. Secondary Research
      4. Primary Research
      5. Forecasting Model
      6. Market Size Estimation
      7. Data Triangulation
      8. Validation
  3. SECTION III: QUALITATIVE ANALYSIS
    1. MARKET DYNAMICS
      1. Overview
      2. Drivers
      3. Restraints
      4. Opportunities
    2. MARKET FACTOR ANALYSIS
      1. Value chain Analysis
      2. Porter's Five Forces Analysis
      3. COVID-19 Impact Analysis
  4. SECTION IV: QUANTITATIVE ANALYSIS
    1. Chemicals and Materials, BY Process (USD Billion)
      1. Dry Process
      2. Wet Process
      3. Pyrogenic (Fumed) Process
    2. Chemicals and Materials, BY Source (USD Billion)
      1. Natural Sources
      2. Synthetic Sources
      3. Recycled Sources
      4. Byproduct Sources
      5. Specialty Sources
    3. Chemicals and Materials, BY Grade (USD Billion)
      1. Standard Grade
      2. High Purity Grade
      3. Ultrafine Grade
      4. Food Grade
      5. Industrial Grade
    4. Chemicals and Materials, BY Application (USD Billion)
      1. Additives
      2. Free Flow Agents
      3. Adsorbents
      4. Catalysts
      5. Others
    5. Chemicals and Materials, BY End-Use (USD Billion)
      1. Automotive
      2. Electronics
      3. Construction
      4. Agriculture
      5. Rubber and Plastics
      6. Food and Beverage
      7. Healthcare and Pharmaceuticals
      8. Others
    6. Chemicals and Materials, BY Region (USD Billion)
      1. North America
      2. Europe
      3. APAC
      4. South America
      5. MEA
  5. SECTION V: COMPETITIVE ANALYSIS
    1. Competitive Landscape
      1. Overview
      2. Competitive Analysis
      3. Market share Analysis
      4. Major Growth Strategy in the Chemicals and Materials
      5. Competitive Benchmarking
      6. Leading Players in Terms of Number of Developments in the Chemicals and Materials
      7. Key developments and growth strategies
      8. Major Players Financial Matrix
    2. Company Profiles
      1. Evonik Industries (DE)
      2. Cabot Corporation (US)
      3. PPG Industries (US)
      4. Wacker Chemie AG (DE)
      5. Hubei Xingfa Chemicals Group Co., Ltd. (CN)
      6. Tokuyama Corporation (JP)
      7. Solvay S.A. (BE)
      8. Orisil (IN)
      9. Fujian Zhanhua Chemical Co., Ltd. (CN)
    3. Appendix
      1. References
      2. Related Reports
  6. LIST OF FIGURES
    1. MARKET SYNOPSIS
    2. NORTH AMERICA MARKET ANALYSIS
    3. US MARKET ANALYSIS BY PROCESS
    4. US MARKET ANALYSIS BY SOURCE
    5. US MARKET ANALYSIS BY GRADE
    6. US MARKET ANALYSIS BY APPLICATION
    7. US MARKET ANALYSIS BY END-USE
    8. CANADA MARKET ANALYSIS BY PROCESS
    9. CANADA MARKET ANALYSIS BY SOURCE
    10. CANADA MARKET ANALYSIS BY GRADE
    11. CANADA MARKET ANALYSIS BY APPLICATION
    12. CANADA MARKET ANALYSIS BY END-USE
    13. EUROPE MARKET ANALYSIS
    14. GERMANY MARKET ANALYSIS BY PROCESS
    15. GERMANY MARKET ANALYSIS BY SOURCE
    16. GERMANY MARKET ANALYSIS BY GRADE
    17. GERMANY MARKET ANALYSIS BY APPLICATION
    18. GERMANY MARKET ANALYSIS BY END-USE
    19. UK MARKET ANALYSIS BY PROCESS
    20. UK MARKET ANALYSIS BY SOURCE
    21. UK MARKET ANALYSIS BY GRADE
    22. UK MARKET ANALYSIS BY APPLICATION
    23. UK MARKET ANALYSIS BY END-USE
    24. FRANCE MARKET ANALYSIS BY PROCESS
    25. FRANCE MARKET ANALYSIS BY SOURCE
    26. FRANCE MARKET ANALYSIS BY GRADE
    27. FRANCE MARKET ANALYSIS BY APPLICATION
    28. FRANCE MARKET ANALYSIS BY END-USE
    29. RUSSIA MARKET ANALYSIS BY PROCESS
    30. RUSSIA MARKET ANALYSIS BY SOURCE
    31. RUSSIA MARKET ANALYSIS BY GRADE
    32. RUSSIA MARKET ANALYSIS BY APPLICATION
    33. RUSSIA MARKET ANALYSIS BY END-USE
    34. ITALY MARKET ANALYSIS BY PROCESS
    35. ITALY MARKET ANALYSIS BY SOURCE
    36. ITALY MARKET ANALYSIS BY GRADE
    37. ITALY MARKET ANALYSIS BY APPLICATION
    38. ITALY MARKET ANALYSIS BY END-USE
    39. SPAIN MARKET ANALYSIS BY PROCESS
    40. SPAIN MARKET ANALYSIS BY SOURCE
    41. SPAIN MARKET ANALYSIS BY GRADE
    42. SPAIN MARKET ANALYSIS BY APPLICATION
    43. SPAIN MARKET ANALYSIS BY END-USE
    44. REST OF EUROPE MARKET ANALYSIS BY PROCESS
    45. REST OF EUROPE MARKET ANALYSIS BY SOURCE
    46. REST OF EUROPE MARKET ANALYSIS BY GRADE
    47. REST OF EUROPE MARKET ANALYSIS BY APPLICATION
    48. REST OF EUROPE MARKET ANALYSIS BY END-USE
    49. APAC MARKET ANALYSIS
    50. CHINA MARKET ANALYSIS BY PROCESS
    51. CHINA MARKET ANALYSIS BY SOURCE
    52. CHINA MARKET ANALYSIS BY GRADE
    53. CHINA MARKET ANALYSIS BY APPLICATION
    54. CHINA MARKET ANALYSIS BY END-USE
    55. INDIA MARKET ANALYSIS BY PROCESS
    56. INDIA MARKET ANALYSIS BY SOURCE
    57. INDIA MARKET ANALYSIS BY GRADE
    58. INDIA MARKET ANALYSIS BY APPLICATION
    59. INDIA MARKET ANALYSIS BY END-USE
    60. JAPAN MARKET ANALYSIS BY PROCESS
    61. JAPAN MARKET ANALYSIS BY SOURCE
    62. JAPAN MARKET ANALYSIS BY GRADE
    63. JAPAN MARKET ANALYSIS BY APPLICATION
    64. JAPAN MARKET ANALYSIS BY END-USE
    65. SOUTH KOREA MARKET ANALYSIS BY PROCESS
    66. SOUTH KOREA MARKET ANALYSIS BY SOURCE
    67. SOUTH KOREA MARKET ANALYSIS BY GRADE
    68. SOUTH KOREA MARKET ANALYSIS BY APPLICATION
    69. SOUTH KOREA MARKET ANALYSIS BY END-USE
    70. MALAYSIA MARKET ANALYSIS BY PROCESS
    71. MALAYSIA MARKET ANALYSIS BY SOURCE
    72. MALAYSIA MARKET ANALYSIS BY GRADE
    73. MALAYSIA MARKET ANALYSIS BY APPLICATION
    74. MALAYSIA MARKET ANALYSIS BY END-USE
    75. THAILAND MARKET ANALYSIS BY PROCESS
    76. THAILAND MARKET ANALYSIS BY SOURCE
    77. THAILAND MARKET ANALYSIS BY GRADE
    78. THAILAND MARKET ANALYSIS BY APPLICATION
    79. THAILAND MARKET ANALYSIS BY END-USE
    80. INDONESIA MARKET ANALYSIS BY PROCESS
    81. INDONESIA MARKET ANALYSIS BY SOURCE
    82. INDONESIA MARKET ANALYSIS BY GRADE
    83. INDONESIA MARKET ANALYSIS BY APPLICATION
    84. INDONESIA MARKET ANALYSIS BY END-USE
    85. REST OF APAC MARKET ANALYSIS BY PROCESS
    86. REST OF APAC MARKET ANALYSIS BY SOURCE
    87. REST OF APAC MARKET ANALYSIS BY GRADE
    88. REST OF APAC MARKET ANALYSIS BY APPLICATION
    89. REST OF APAC MARKET ANALYSIS BY END-USE
    90. SOUTH AMERICA MARKET ANALYSIS
    91. BRAZIL MARKET ANALYSIS BY PROCESS
    92. BRAZIL MARKET ANALYSIS BY SOURCE
    93. BRAZIL MARKET ANALYSIS BY GRADE
    94. BRAZIL MARKET ANALYSIS BY APPLICATION
    95. BRAZIL MARKET ANALYSIS BY END-USE
    96. MEXICO MARKET ANALYSIS BY PROCESS
    97. MEXICO MARKET ANALYSIS BY SOURCE
    98. MEXICO MARKET ANALYSIS BY GRADE
    99. MEXICO MARKET ANALYSIS BY APPLICATION
    100. MEXICO MARKET ANALYSIS BY END-USE
    101. ARGENTINA MARKET ANALYSIS BY PROCESS
    102. ARGENTINA MARKET ANALYSIS BY SOURCE
    103. ARGENTINA MARKET ANALYSIS BY GRADE
    104. ARGENTINA MARKET ANALYSIS BY APPLICATION
    105. ARGENTINA MARKET ANALYSIS BY END-USE
    106. REST OF SOUTH AMERICA MARKET ANALYSIS BY PROCESS
    107. REST OF SOUTH AMERICA MARKET ANALYSIS BY SOURCE
    108. REST OF SOUTH AMERICA MARKET ANALYSIS BY GRADE
    109. REST OF SOUTH AMERICA MARKET ANALYSIS BY APPLICATION
    110. REST OF SOUTH AMERICA MARKET ANALYSIS BY END-USE
    111. MEA MARKET ANALYSIS
    112. GCC COUNTRIES MARKET ANALYSIS BY PROCESS
    113. GCC COUNTRIES MARKET ANALYSIS BY SOURCE
    114. GCC COUNTRIES MARKET ANALYSIS BY GRADE
    115. GCC COUNTRIES MARKET ANALYSIS BY APPLICATION
    116. GCC COUNTRIES MARKET ANALYSIS BY END-USE
    117. SOUTH AFRICA MARKET ANALYSIS BY PROCESS
    118. SOUTH AFRICA MARKET ANALYSIS BY SOURCE
    119. SOUTH AFRICA MARKET ANALYSIS BY GRADE
    120. SOUTH AFRICA MARKET ANALYSIS BY APPLICATION
    121. SOUTH AFRICA MARKET ANALYSIS BY END-USE
    122. REST OF MEA MARKET ANALYSIS BY PROCESS
    123. REST OF MEA MARKET ANALYSIS BY SOURCE
    124. REST OF MEA MARKET ANALYSIS BY GRADE
    125. REST OF MEA MARKET ANALYSIS BY APPLICATION
    126. REST OF MEA MARKET ANALYSIS BY END-USE
    127. KEY BUYING CRITERIA OF CHEMICALS AND MATERIALS
    128. RESEARCH PROCESS OF MRFR
    129. DRO ANALYSIS OF CHEMICALS AND MATERIALS
    130. DRIVERS IMPACT ANALYSIS: CHEMICALS AND MATERIALS
    131. RESTRAINTS IMPACT ANALYSIS: CHEMICALS AND MATERIALS
    132. SUPPLY / VALUE CHAIN: CHEMICALS AND MATERIALS
    133. CHEMICALS AND MATERIALS, BY PROCESS, 2024 (% SHARE)
    134. CHEMICALS AND MATERIALS, BY PROCESS, 2024 TO 2035 (USD Billion)
    135. CHEMICALS AND MATERIALS, BY SOURCE, 2024 (% SHARE)
    136. CHEMICALS AND MATERIALS, BY SOURCE, 2024 TO 2035 (USD Billion)
    137. CHEMICALS AND MATERIALS, BY GRADE, 2024 (% SHARE)
    138. CHEMICALS AND MATERIALS, BY GRADE, 2024 TO 2035 (USD Billion)
    139. CHEMICALS AND MATERIALS, BY APPLICATION, 2024 (% SHARE)
    140. CHEMICALS AND MATERIALS, BY APPLICATION, 2024 TO 2035 (USD Billion)
    141. CHEMICALS AND MATERIALS, BY END-USE, 2024 (% SHARE)
    142. CHEMICALS AND MATERIALS, BY END-USE, 2024 TO 2035 (USD Billion)
    143. BENCHMARKING OF MAJOR COMPETITORS
  7. LIST OF TABLES
    1. LIST OF ASSUMPTIONS
    2. North America MARKET SIZE ESTIMATES; FORECAST
      1. BY PROCESS, 2025-2035 (USD Billion)
      2. BY SOURCE, 2025-2035 (USD Billion)
      3. BY GRADE, 2025-2035 (USD Billion)
      4. BY APPLICATION, 2025-2035 (USD Billion)
      5. BY END-USE, 2025-2035 (USD Billion)
    3. US MARKET SIZE ESTIMATES; FORECAST
      1. BY PROCESS, 2025-2035 (USD Billion)
      2. BY SOURCE, 2025-2035 (USD Billion)
      3. BY GRADE, 2025-2035 (USD Billion)
      4. BY APPLICATION, 2025-2035 (USD Billion)
      5. BY END-USE, 2025-2035 (USD Billion)
    4. Canada MARKET SIZE ESTIMATES; FORECAST
      1. BY PROCESS, 2025-2035 (USD Billion)
      2. BY SOURCE, 2025-2035 (USD Billion)
      3. BY GRADE, 2025-2035 (USD Billion)
      4. BY APPLICATION, 2025-2035 (USD Billion)
      5. BY END-USE, 2025-2035 (USD Billion)
    5. Europe MARKET SIZE ESTIMATES; FORECAST
      1. BY PROCESS, 2025-2035 (USD Billion)
      2. BY SOURCE, 2025-2035 (USD Billion)
      3. BY GRADE, 2025-2035 (USD Billion)
      4. BY APPLICATION, 2025-2035 (USD Billion)
      5. BY END-USE, 2025-2035 (USD Billion)
    6. Germany MARKET SIZE ESTIMATES; FORECAST
      1. BY PROCESS, 2025-2035 (USD Billion)
      2. BY SOURCE, 2025-2035 (USD Billion)
      3. BY GRADE, 2025-2035 (USD Billion)
      4. BY APPLICATION, 2025-2035 (USD Billion)
      5. BY END-USE, 2025-2035 (USD Billion)
    7. UK MARKET SIZE ESTIMATES; FORECAST
      1. BY PROCESS, 2025-2035 (USD Billion)
      2. BY SOURCE, 2025-2035 (USD Billion)
      3. BY GRADE, 2025-2035 (USD Billion)
      4. BY APPLICATION, 2025-2035 (USD Billion)
      5. BY END-USE, 2025-2035 (USD Billion)
    8. France MARKET SIZE ESTIMATES; FORECAST
      1. BY PROCESS, 2025-2035 (USD Billion)
      2. BY SOURCE, 2025-2035 (USD Billion)
      3. BY GRADE, 2025-2035 (USD Billion)
      4. BY APPLICATION, 2025-2035 (USD Billion)
      5. BY END-USE, 2025-2035 (USD Billion)
    9. Russia MARKET SIZE ESTIMATES; FORECAST
      1. BY PROCESS, 2025-2035 (USD Billion)
      2. BY SOURCE, 2025-2035 (USD Billion)
      3. BY GRADE, 2025-2035 (USD Billion)
      4. BY APPLICATION, 2025-2035 (USD Billion)
      5. BY END-USE, 2025-2035 (USD Billion)
    10. Italy MARKET SIZE ESTIMATES; FORECAST
      1. BY PROCESS, 2025-2035 (USD Billion)
      2. BY SOURCE, 2025-2035 (USD Billion)
      3. BY GRADE, 2025-2035 (USD Billion)
      4. BY APPLICATION, 2025-2035 (USD Billion)
      5. BY END-USE, 2025-2035 (USD Billion)
    11. Spain MARKET SIZE ESTIMATES; FORECAST
      1. BY PROCESS, 2025-2035 (USD Billion)
      2. BY SOURCE, 2025-2035 (USD Billion)
      3. BY GRADE, 2025-2035 (USD Billion)
      4. BY APPLICATION, 2025-2035 (USD Billion)
      5. BY END-USE, 2025-2035 (USD Billion)
    12. Rest of Europe MARKET SIZE ESTIMATES; FORECAST
      1. BY PROCESS, 2025-2035 (USD Billion)
      2. BY SOURCE, 2025-2035 (USD Billion)
      3. BY GRADE, 2025-2035 (USD Billion)
      4. BY APPLICATION, 2025-2035 (USD Billion)
      5. BY END-USE, 2025-2035 (USD Billion)
    13. APAC MARKET SIZE ESTIMATES; FORECAST
      1. BY PROCESS, 2025-2035 (USD Billion)
      2. BY SOURCE, 2025-2035 (USD Billion)
      3. BY GRADE, 2025-2035 (USD Billion)
      4. BY APPLICATION, 2025-2035 (USD Billion)
      5. BY END-USE, 2025-2035 (USD Billion)
    14. China MARKET SIZE ESTIMATES; FORECAST
      1. BY PROCESS, 2025-2035 (USD Billion)
      2. BY SOURCE, 2025-2035 (USD Billion)
      3. BY GRADE, 2025-2035 (USD Billion)
      4. BY APPLICATION, 2025-2035 (USD Billion)
      5. BY END-USE, 2025-2035 (USD Billion)
    15. India MARKET SIZE ESTIMATES; FORECAST
      1. BY PROCESS, 2025-2035 (USD Billion)
      2. BY SOURCE, 2025-2035 (USD Billion)
      3. BY GRADE, 2025-2035 (USD Billion)
      4. BY APPLICATION, 2025-2035 (USD Billion)
      5. BY END-USE, 2025-2035 (USD Billion)
    16. Japan MARKET SIZE ESTIMATES; FORECAST
      1. BY PROCESS, 2025-2035 (USD Billion)
      2. BY SOURCE, 2025-2035 (USD Billion)
      3. BY GRADE, 2025-2035 (USD Billion)
      4. BY APPLICATION, 2025-2035 (USD Billion)
      5. BY END-USE, 2025-2035 (USD Billion)
    17. South Korea MARKET SIZE ESTIMATES; FORECAST
      1. BY PROCESS, 2025-2035 (USD Billion)
      2. BY SOURCE, 2025-2035 (USD Billion)
      3. BY GRADE, 2025-2035 (USD Billion)
      4. BY APPLICATION, 2025-2035 (USD Billion)
      5. BY END-USE, 2025-2035 (USD Billion)
    18. Malaysia MARKET SIZE ESTIMATES; FORECAST
      1. BY PROCESS, 2025-2035 (USD Billion)
      2. BY SOURCE, 2025-2035 (USD Billion)
      3. BY GRADE, 2025-2035 (USD Billion)
      4. BY APPLICATION, 2025-2035 (USD Billion)
      5. BY END-USE, 2025-2035 (USD Billion)
    19. Thailand MARKET SIZE ESTIMATES; FORECAST
      1. BY PROCESS, 2025-2035 (USD Billion)
      2. BY SOURCE, 2025-2035 (USD Billion)
      3. BY GRADE, 2025-2035 (USD Billion)
      4. BY APPLICATION, 2025-2035 (USD Billion)
      5. BY END-USE, 2025-2035 (USD Billion)
    20. Indonesia MARKET SIZE ESTIMATES; FORECAST
      1. BY PROCESS, 2025-2035 (USD Billion)
      2. BY SOURCE, 2025-2035 (USD Billion)
      3. BY GRADE, 2025-2035 (USD Billion)
      4. BY APPLICATION, 2025-2035 (USD Billion)
      5. BY END-USE, 2025-2035 (USD Billion)
    21. Rest of APAC MARKET SIZE ESTIMATES; FORECAST
      1. BY PROCESS, 2025-2035 (USD Billion)
      2. BY SOURCE, 2025-2035 (USD Billion)
      3. BY GRADE, 2025-2035 (USD Billion)
      4. BY APPLICATION, 2025-2035 (USD Billion)
      5. BY END-USE, 2025-2035 (USD Billion)
    22. South America MARKET SIZE ESTIMATES; FORECAST
      1. BY PROCESS, 2025-2035 (USD Billion)
      2. BY SOURCE, 2025-2035 (USD Billion)
      3. BY GRADE, 2025-2035 (USD Billion)
      4. BY APPLICATION, 2025-2035 (USD Billion)
      5. BY END-USE, 2025-2035 (USD Billion)
    23. Brazil MARKET SIZE ESTIMATES; FORECAST
      1. BY PROCESS, 2025-2035 (USD Billion)
      2. BY SOURCE, 2025-2035 (USD Billion)
      3. BY GRADE, 2025-2035 (USD Billion)
      4. BY APPLICATION, 2025-2035 (USD Billion)
      5. BY END-USE, 2025-2035 (USD Billion)
    24. Mexico MARKET SIZE ESTIMATES; FORECAST
      1. BY PROCESS, 2025-2035 (USD Billion)
      2. BY SOURCE, 2025-2035 (USD Billion)
      3. BY GRADE, 2025-2035 (USD Billion)
      4. BY APPLICATION, 2025-2035 (USD Billion)
      5. BY END-USE, 2025-2035 (USD Billion)
    25. Argentina MARKET SIZE ESTIMATES; FORECAST
      1. BY PROCESS, 2025-2035 (USD Billion)
      2. BY SOURCE, 2025-2035 (USD Billion)
      3. BY GRADE, 2025-2035 (USD Billion)
      4. BY APPLICATION, 2025-2035 (USD Billion)
      5. BY END-USE, 2025-2035 (USD Billion)
    26. Rest of South America MARKET SIZE ESTIMATES; FORECAST
      1. BY PROCESS, 2025-2035 (USD Billion)
      2. BY SOURCE, 2025-2035 (USD Billion)
      3. BY GRADE, 2025-2035 (USD Billion)
      4. BY APPLICATION, 2025-2035 (USD Billion)
      5. BY END-USE, 2025-2035 (USD Billion)
    27. MEA MARKET SIZE ESTIMATES; FORECAST
      1. BY PROCESS, 2025-2035 (USD Billion)
      2. BY SOURCE, 2025-2035 (USD Billion)
      3. BY GRADE, 2025-2035 (USD Billion)
      4. BY APPLICATION, 2025-2035 (USD Billion)
      5. BY END-USE, 2025-2035 (USD Billion)
    28. GCC Countries MARKET SIZE ESTIMATES; FORECAST
      1. BY PROCESS, 2025-2035 (USD Billion)
      2. BY SOURCE, 2025-2035 (USD Billion)
      3. BY GRADE, 2025-2035 (USD Billion)
      4. BY APPLICATION, 2025-2035 (USD Billion)
      5. BY END-USE, 2025-2035 (USD Billion)
    29. South Africa MARKET SIZE ESTIMATES; FORECAST
      1. BY PROCESS, 2025-2035 (USD Billion)
      2. BY SOURCE, 2025-2035 (USD Billion)
      3. BY GRADE, 2025-2035 (USD Billion)
      4. BY APPLICATION, 2025-2035 (USD Billion)
      5. BY END-USE, 2025-2035 (USD Billion)
    30. Rest of MEA MARKET SIZE ESTIMATES; FORECAST
      1. BY PROCESS, 2025-2035 (USD Billion)
      2. BY SOURCE, 2025-2035 (USD Billion)
      3. BY GRADE, 2025-2035 (USD Billion)
      4. BY APPLICATION, 2025-2035 (USD Billion)
      5. BY END-USE, 2025-2035 (USD Billion)
    31. PRODUCT LAUNCH/PRODUCT DEVELOPMENT/APPROVAL
    32. ACQUISITION/PARTNERSHIP

Precipitated Silica Market Segmentation


Precipitated Silica Market By Application (USD Billion, 2019-2035)

Rubber

Plastics

Coatings

Food and Feed

Pharmaceuticals


Precipitated Silica Market By Form (USD Billion, 2019-2035)

Granulated

Powder

Colloidal


Precipitated Silica Market By End Use (USD Billion, 2019-2035)

Automotive

Construction

Electronics

Healthcare

Consumer Goods


Precipitated Silica Market By Type (USD Billion, 2019-2035)

Synthetic Silica

Natural Silica


Precipitated Silica Market By Regional (USD Billion, 2019-2035)

North America

Europe

South America

Asia Pacific

Middle East and Africa


Precipitated Silica Market Regional Outlook (USD Billion, 2019-2035)


North America Outlook (USD Billion, 2019-2035)

North America Precipitated Silica Market by Application Type

Rubber

Plastics

Coatings

Food and Feed

Pharmaceuticals

North America Precipitated Silica Market by Form Type

Granulated

Powder

Colloidal

North America Precipitated Silica Market by End Use Type

Automotive

Construction

Electronics

Healthcare

Consumer Goods

North America Precipitated Silica Market by Type

Synthetic Silica

Natural Silica

North America Precipitated Silica Market by Regional Type

US

Canada

US Outlook (USD Billion, 2019-2035)

US Precipitated Silica Market by Application Type

Rubber

Plastics

Coatings

Food and Feed

Pharmaceuticals

US Precipitated Silica Market by Form Type

Granulated

Powder

Colloidal

US Precipitated Silica Market by End Use Type

Automotive

Construction

Electronics

Healthcare

Consumer Goods

US Precipitated Silica Market by Type

Synthetic Silica

Natural Silica

CANADA Outlook (USD Billion, 2019-2035)

CANADA Precipitated Silica Market by Application Type

Rubber

Plastics

Coatings

Food and Feed

Pharmaceuticals

CANADA Precipitated Silica Market by Form Type

Granulated

Powder

Colloidal

CANADA Precipitated Silica Market by End Use Type

Automotive

Construction

Electronics

Healthcare

Consumer Goods

CANADA Precipitated Silica Market by Type

Synthetic Silica

Natural Silica
Europe Outlook (USD Billion, 2019-2035)

Europe Precipitated Silica Market by Application Type

Rubber

Plastics

Coatings

Food and Feed

Pharmaceuticals

Europe Precipitated Silica Market by Form Type

Granulated

Powder

Colloidal

Europe Precipitated Silica Market by End Use Type

Automotive

Construction

Electronics

Healthcare

Consumer Goods

Europe Precipitated Silica Market by Type

Synthetic Silica

Natural Silica

Europe Precipitated Silica Market by Regional Type

Germany

UK

France

Russia

Italy

Spain

Rest of Europe

GERMANY Outlook (USD Billion, 2019-2035)

GERMANY Precipitated Silica Market by Application Type

Rubber

Plastics

Coatings

Food and Feed

Pharmaceuticals

GERMANY Precipitated Silica Market by Form Type

Granulated

Powder

Colloidal

GERMANY Precipitated Silica Market by End Use Type

Automotive

Construction

Electronics

Healthcare

Consumer Goods

GERMANY Precipitated Silica Market by Type

Synthetic Silica

Natural Silica

UK Outlook (USD Billion, 2019-2035)

UK Precipitated Silica Market by Application Type

Rubber

Plastics

Coatings

Food and Feed

Pharmaceuticals

UK Precipitated Silica Market by Form Type

Granulated

Powder

Colloidal

UK Precipitated Silica Market by End Use Type

Automotive

Construction

Electronics

Healthcare

Consumer Goods

UK Precipitated Silica Market by Type

Synthetic Silica

Natural Silica
FRANCE Outlook (USD Billion, 2019-2035)

FRANCE Precipitated Silica Market by Application Type

Rubber

Plastics

Coatings

Food and Feed

Pharmaceuticals

FRANCE Precipitated Silica Market by Form Type

Granulated

Powder

Colloidal

FRANCE Precipitated Silica Market by End Use Type

Automotive

Construction

Electronics

Healthcare

Consumer Goods

FRANCE Precipitated Silica Market by Type

Synthetic Silica

Natural Silica

RUSSIA Outlook (USD Billion, 2019-2035)

RUSSIA Precipitated Silica Market by Application Type

Rubber

Plastics

Coatings

Food and Feed

Pharmaceuticals

RUSSIA Precipitated Silica Market by Form Type

Granulated

Powder

Colloidal

RUSSIA Precipitated Silica Market by End Use Type

Automotive

Construction

Electronics

Healthcare

Consumer Goods

RUSSIA Precipitated Silica Market by Type

Synthetic Silica

Natural Silica
ITALY Outlook (USD Billion, 2019-2035)

ITALY Precipitated Silica Market by Application Type

Rubber

Plastics

Coatings

Food and Feed

Pharmaceuticals

ITALY Precipitated Silica Market by Form Type

Granulated

Powder

Colloidal

ITALY Precipitated Silica Market by End Use Type

Automotive

Construction

Electronics

Healthcare

Consumer Goods

ITALY Precipitated Silica Market by Type

Synthetic Silica

Natural Silica

SPAIN Outlook (USD Billion, 2019-2035)

SPAIN Precipitated Silica Market by Application Type

Rubber

Plastics

Coatings

Food and Feed

Pharmaceuticals

SPAIN Precipitated Silica Market by Form Type

Granulated

Powder

Colloidal

SPAIN Precipitated Silica Market by End Use Type

Automotive

Construction

Electronics

Healthcare

Consumer Goods

SPAIN Precipitated Silica Market by Type

Synthetic Silica

Natural Silica

REST OF EUROPE Outlook (USD Billion, 2019-2035)

REST OF EUROPE Precipitated Silica Market by Application Type

Rubber

Plastics

Coatings

Food and Feed

Pharmaceuticals

REST OF EUROPE Precipitated Silica Market by Form Type

Granulated

Powder

Colloidal

REST OF EUROPE Precipitated Silica Market by End Use Type

Automotive

Construction

Electronics

Healthcare

Consumer Goods

REST OF EUROPE Precipitated Silica Market by Type

Synthetic Silica

Natural Silica

APAC Outlook (USD Billion, 2019-2035)

APAC Precipitated Silica Market by Application Type

Rubber

Plastics

Coatings

Food and Feed

Pharmaceuticals

APAC Precipitated Silica Market by Form Type

Granulated

Powder

Colloidal

APAC Precipitated Silica Market by End Use Type

Automotive

Construction

Electronics

Healthcare

Consumer Goods

APAC Precipitated Silica Market by Type

Synthetic Silica

Natural Silica

APAC Precipitated Silica Market by Regional Type

China

India

Japan

South Korea

Malaysia

Thailand

Indonesia

Rest of APAC

CHINA Outlook (USD Billion, 2019-2035)

CHINA Precipitated Silica Market by Application Type

Rubber

Plastics

Coatings

Food and Feed

Pharmaceuticals

CHINA Precipitated Silica Market by Form Type

Granulated

Powder

Colloidal

CHINA Precipitated Silica Market by End Use Type

Automotive

Construction

Electronics

Healthcare

Consumer Goods

CHINA Precipitated Silica Market by Type

Synthetic Silica

Natural Silica

INDIA Outlook (USD Billion, 2019-2035)

INDIA Precipitated Silica Market by Application Type

Rubber

Plastics

Coatings

Food and Feed

Pharmaceuticals

INDIA Precipitated Silica Market by Form Type

Granulated

Powder

Colloidal

INDIA Precipitated Silica Market by End Use Type

Automotive

Construction

Electronics

Healthcare

Consumer Goods

INDIA Precipitated Silica Market by Type

Synthetic Silica

Natural Silica

JAPAN Outlook (USD Billion, 2019-2035)

JAPAN Precipitated Silica Market by Application Type

Rubber

Plastics

Coatings

Food and Feed

Pharmaceuticals

JAPAN Precipitated Silica Market by Form Type

Granulated

Powder

Colloidal

JAPAN Precipitated Silica Market by End Use Type

Automotive

Construction

Electronics

Healthcare

Consumer Goods

JAPAN Precipitated Silica Market by Type

Synthetic Silica

Natural Silica

SOUTH KOREA Outlook (USD Billion, 2019-2035)

SOUTH KOREA Precipitated Silica Market by Application Type

Rubber

Plastics

Coatings

Food and Feed

Pharmaceuticals

SOUTH KOREA Precipitated Silica Market by Form Type

Granulated

Powder

Colloidal

SOUTH KOREA Precipitated Silica Market by End Use Type

Automotive

Construction

Electronics

Healthcare

Consumer Goods

SOUTH KOREA Precipitated Silica Market by Type

Synthetic Silica

Natural Silica

MALAYSIA Outlook (USD Billion, 2019-2035)

MALAYSIA Precipitated Silica Market by Application Type

Rubber

Plastics

Coatings

Food and Feed

Pharmaceuticals

MALAYSIA Precipitated Silica Market by Form Type

Granulated

Powder

Colloidal

MALAYSIA Precipitated Silica Market by End Use Type

Automotive

Construction

Electronics

Healthcare

Consumer Goods

MALAYSIA Precipitated Silica Market by Type

Synthetic Silica

Natural Silica

THAILAND Outlook (USD Billion, 2019-2035)

THAILAND Precipitated Silica Market by Application Type

Rubber

Plastics

Coatings

Food and Feed

Pharmaceuticals

THAILAND Precipitated Silica Market by Form Type

Granulated

Powder

Colloidal

THAILAND Precipitated Silica Market by End Use Type

Automotive

Construction

Electronics

Healthcare

Consumer Goods

THAILAND Precipitated Silica Market by Type

Synthetic Silica

Natural Silica

INDONESIA Outlook (USD Billion, 2019-2035)

INDONESIA Precipitated Silica Market by Application Type

Rubber

Plastics

Coatings

Food and Feed

Pharmaceuticals

INDONESIA Precipitated Silica Market by Form Type

Granulated

Powder

Colloidal

INDONESIA Precipitated Silica Market by End Use Type

Automotive

Construction

Electronics

Healthcare

Consumer Goods

INDONESIA Precipitated Silica Market by Type

Synthetic Silica

Natural Silica

REST OF APAC Outlook (USD Billion, 2019-2035)

REST OF APAC Precipitated Silica Market by Application Type

Rubber

Plastics

Coatings

Food and Feed

Pharmaceuticals

REST OF APAC Precipitated Silica Market by Form Type

Granulated

Powder

Colloidal

REST OF APAC Precipitated Silica Market by End Use Type

Automotive

Construction

Electronics

Healthcare

Consumer Goods

REST OF APAC Precipitated Silica Market by Type

Synthetic Silica

Natural Silica

South America Outlook (USD Billion, 2019-2035)

South America Precipitated Silica Market by Application Type

Rubber

Plastics

Coatings

Food and Feed

Pharmaceuticals

South America Precipitated Silica Market by Form Type

Granulated

Powder

Colloidal

South America Precipitated Silica Market by End Use Type

Automotive

Construction

Electronics

Healthcare

Consumer Goods

South America Precipitated Silica Market by Type

Synthetic Silica

Natural Silica

South America Precipitated Silica Market by Regional Type

Brazil

Mexico

Argentina

Rest of South America

BRAZIL Outlook (USD Billion, 2019-2035)

BRAZIL Precipitated Silica Market by Application Type

Rubber

Plastics

Coatings

Food and Feed

Pharmaceuticals

BRAZIL Precipitated Silica Market by Form Type

Granulated

Powder

Colloidal

BRAZIL Precipitated Silica Market by End Use Type

Automotive

Construction

Electronics

Healthcare

Consumer Goods

BRAZIL Precipitated Silica Market by Type

Synthetic Silica

Natural Silica

MEXICO Outlook (USD Billion, 2019-2035)

MEXICO Precipitated Silica Market by Application Type

Rubber

Plastics

Coatings

Food and Feed

Pharmaceuticals

MEXICO Precipitated Silica Market by Form Type

Granulated

Powder

Colloidal

MEXICO Precipitated Silica Market by End Use Type

Automotive

Construction

Electronics

Healthcare

Consumer Goods

MEXICO Precipitated Silica Market by Type

Synthetic Silica

Natural Silica

ARGENTINA Outlook (USD Billion, 2019-2035)

ARGENTINA Precipitated Silica Market by Application Type

Rubber

Plastics

Coatings

Food and Feed

Pharmaceuticals

ARGENTINA Precipitated Silica Market by Form Type

Granulated

Powder

Colloidal

ARGENTINA Precipitated Silica Market by End Use Type

Automotive

Construction

Electronics

Healthcare

Consumer Goods

ARGENTINA Precipitated Silica Market by Type

Synthetic Silica

Natural Silica

REST OF SOUTH AMERICA Outlook (USD Billion, 2019-2035)

REST OF SOUTH AMERICA Precipitated Silica Market by Application Type

Rubber

Plastics

Coatings

Food and Feed

Pharmaceuticals

REST OF SOUTH AMERICA Precipitated Silica Market by Form Type

Granulated

Powder

Colloidal

REST OF SOUTH AMERICA Precipitated Silica Market by End Use Type

Automotive

Construction

Electronics

Healthcare

Consumer Goods

REST OF SOUTH AMERICA Precipitated Silica Market by Type

Synthetic Silica

Natural Silica

MEA Outlook (USD Billion, 2019-2035)

MEA Precipitated Silica Market by Application Type

Rubber

Plastics

Coatings

Food and Feed

Pharmaceuticals

MEA Precipitated Silica Market by Form Type

Granulated

Powder

Colloidal

MEA Precipitated Silica Market by End Use Type

Automotive

Construction

Electronics

Healthcare

Consumer Goods

MEA Precipitated Silica Market by Type

Synthetic Silica

Natural Silica

MEA Precipitated Silica Market by Regional Type

GCC Countries

South Africa

Rest of MEA

GCC COUNTRIES Outlook (USD Billion, 2019-2035)

GCC COUNTRIES Precipitated Silica Market by Application Type

Rubber

Plastics

Coatings

Food and Feed

Pharmaceuticals

GCC COUNTRIES Precipitated Silica Market by Form Type

Granulated

Powder

Colloidal

GCC COUNTRIES Precipitated Silica Market by End Use Type

Automotive

Construction

Electronics

Healthcare

Consumer Goods

GCC COUNTRIES Precipitated Silica Market by Type

Synthetic Silica

Natural Silica

SOUTH AFRICA Outlook (USD Billion, 2019-2035)

SOUTH AFRICA Precipitated Silica Market by Application Type

Rubber

Plastics

Coatings

Food and Feed

Pharmaceuticals

SOUTH AFRICA Precipitated Silica Market by Form Type

Granulated

Powder

Colloidal

SOUTH AFRICA Precipitated Silica Market by End Use Type

Automotive

Construction

Electronics

Healthcare

Consumer Goods

SOUTH AFRICA Precipitated Silica Market by Type

Synthetic Silica

Natural Silica

REST OF MEA Outlook (USD Billion, 2019-2035)

REST OF MEA Precipitated Silica Market by Application Type

Rubber

Plastics

Coatings

Food and Feed

Pharmaceuticals

REST OF MEA Precipitated Silica Market by Form Type

Granulated

Powder

Colloidal

REST OF MEA Precipitated Silica Market by End Use Type

Automotive

Construction

Electronics

Healthcare

Consumer Goods

REST OF MEA Precipitated Silica Market by Type

Synthetic Silica

Natural Silica


Infographic

Free Sample Request

Kindly complete the form below to receive a free sample of this Report

Get Free Sample

Customer Strories

“I am very pleased with how market segments have been defined in a relevant way for my purposes (such as "Portable Freezers & refrigerators" and "last-mile"). In general the report is well structured. Thanks very much for your efforts.”

Victoria Milne

Founder

Compare Licence

×
Features License Type
Single User Multiuser License Enterprise User
Price $4,950 $5,950 $7,250
Maximum User Access Limit 1 User Upto 10 Users Unrestricted Access Throughout the Organization
Free Customization
Direct Access to Analyst
Deliverable Format
Platform Access
Discount on Next Purchase 10% 15% 15%
Printable Versions