Precipitated Silica Market (2026 - 2035)

Precipitated Silica Market Research Report Information By Grade (Rubber, Food, Feed, and Others), By Form (Powder, Beads, Micro-Pearls, and Granules), By Production Process (Wet Process and Dry Process), By End-Use Industry (Tires, Oral Care & Cosmetics, Agriculture, Electronics, and Others) – Forecast Till 2035
ID: MRFR/CnM/1468-CR
200 Pages
Chitranshi Jaiswal
Last Updated: July 24, 2026
Precipitated Silica Market
Market Size
Forecast Period2026-2035
CAGR (2026-2035)4.22%
2025 Market SizeUSD 6,120 Million
2035 Market SizeUSD 9,250 Million
Key Players
Evonik Industries
Solvay
PPG Industries
W.R. Grace
Tosoh Silica
Madhu Silica
Opportunities
  • Ultra-Pure Grades for Next-Generation Batteries
  • Biomass-Derived Silica for Circular-Economy Compliance
  • Emerging-Market Capacity in Africa and South America

Precipitated Silica Market Summary

The Precipitated Silica Market reached an estimated USD 6,120 Million in 2025 and is projected to grow from USD 6,378 Million in 2026 to approximately USD 9,250 Million by 2035, registering a CAGR of 4.22% across the forecast period. Two catalysts anchor this trajectory: electric-vehicle tire programs that require advanced silica-loaded compounds for lower rolling resistance, and clean-label food regulations in the EU and United States that increasingly endorse ultra-pure amorphous silica as a safe anti-caking agent[2].

A structural shift is reshaping how producers approach capacity planning. Conventional wet-process plants, which still account for roughly 70% of global output, face competition from dry-process lines that cut energy consumption by 18–22% per ton and unlock niche uses in lithium-ion battery separators [3]. Evonik alone committed over EUR 350 million between 2023 and 2025 to expand high-dispersion silica capacity, while Solvay and PPG Industries are investing in biomass-derived feedstock routes that reduce sodium-silicate dependency [4].

Asia-Pacific commands a 53.8% share of the Precipitated Silica Market in 2025 and leads future expansion at a 4.28% CAGR through 2035, propelled by rice-husk-ash valorization projects across India and Southeast Asia that trim raw-material costs by 15–20% versus traditional pathways [5]. Europe follows as the second-largest region at a 22.4% share, driven by EU Green Deal mandates on low-carbon industrial chemicals, while North America contributes 15.6% of global demand. The competitive landscape remains moderately concentrated, with the top five suppliers holding roughly half of installed capacity and mid-tier players carving out share in ultra-pure and food-grade niches.


Key Report Takeaways

• By Grade

  • Rubber grade held a 58.2% share of the Precipitated Silica Market in 2025, underpinned by the global tire replacement cycle and EV platform launches.
  • Food grade is forecast to post the fastest CAGR of 4.90% through 2035, reflecting clean-label regulatory tailwinds.

• By Form

  • Powder form dominated the Precipitated Silica Market with a 51.8% revenue share in 2025, serving rubber compounders and coatings manufacturers alike.
  • Beads are set to expand at a 6.80% CAGR to 2035, driven by controlled-release oral-care and specialty coating applications.

• By Production Process

  • Wet-process routes commanded a 70.4% volume share in 2025.
  • Dry-process output is forecast to grow at 5.25% annually during 2026–2035, benefiting from lower energy intensity and battery-separator demand.

• By End-Use Industry

  • Tires accounted for 33.2% of global volume in 2025.
  • Oral-care and cosmetics applications are advancing at a 4.52% CAGR through 2035.

• By Region

  • Asia-Pacific captured 53.8% of global demand in 2025 and leads growth at a 4.28% CAGR.
  • Europe holds the second-largest share at 22.4%, supported by sustainability-driven procurement mandates.


Market Size and Forecast (2021–2035)

Market Research Future's estimates draw on proprietary demand models triangulated against trade-flow data, company filings, and plant-level capacity tracking across 35 countries. Historical figures reflect actual shipment volumes; forecast values apply a compound annual growth assumption calibrated to downstream end-use demand curves and announced capacity expansions.
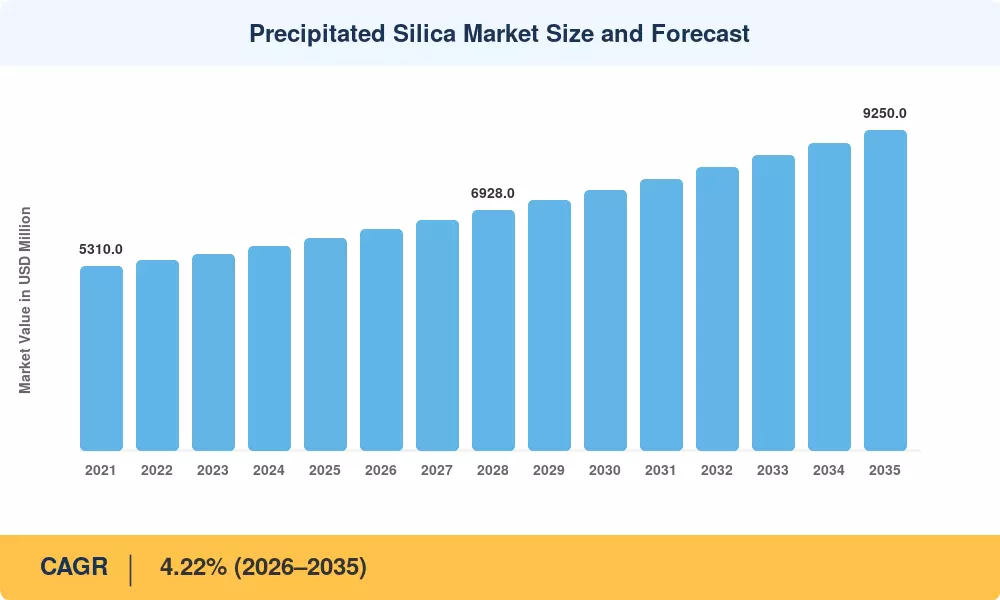
Precipitated Silica Market Size and Forecast
Our Impact
Enabled $4.3B Revenue Impact for Fortune 500 and Leading Multinationals
Partnering with 2000+ Global Organizations Each Year
30K+ Citations by Top-Tier Firms in the Industry

Driver Impact Analysis

Driver ~% Impact on CAGR Geographic Relevance Impact Timeline
EV tire silica loading requirements +0.85% Global Medium-term (2–4 yr)
Clean-label food regulations +0.60% Europe, North America Short-term (≤2 yr)
Rice-husk-ash feedstock valorization +0.50% Asia-Pacific Medium-term (2–4 yr)
Battery-separator silica demand +0.40% Asia-Pacific, Europe Long-term (≥4 yr)
Oral-care premiumization trends +0.35% Global Short-term (≤2 yr)
Green-chemistry mandates (REACH, TSCA) +0.30% Europe, North America Long-term (≥4 yr)
Animal-feed silica supplementation growth +0.20% South America, Asia-Pacific Medium-term (2–4 yr)


EV Tire Silica Loading Requirements

Modern EV tire compounds require 30–40% more precipitated silica by weight than conventional passenger-vehicle tires to achieve the ultra-low rolling resistance needed for battery range optimization [2]. Continental's 2024 study estimated that every 10% reduction in rolling resistance extends EV range by 5–7%, translating to a compound annual incremental silica demand of roughly 180,000 tons across Europe and China alone. The EU's proposed Euro 7 labeling framework, expected to tighten rolling-resistance thresholds by 2028, will further cement silica as the preferred filler over carbon black in green-tire formulations.

Clean-Label Food Regulations

The safety of highly dispersed amorphous precipitated silica for food-contact use was confirmed by the European Food Safety Authority's 2024 re-evaluation of silicon dioxide (E551), provided that the nano-fraction content remains below 10% by weight [6]. This decision sparked interest among powdered beverage manufacturers and bakery-mix producers who were in search of alternatives to synthetic anti-caking agents. The FDA's improved GRAS notification pathway in the United States has resulted in a reduction of approval timelines from 18 months to approximately 9 months for precipitated silica grades that meet USP-NF purity standards. This has accelerated the launch of products throughout the food-ingredient supply chain.


Rice-Husk-Ash Feedstock Valorization

India's Ministry of Agriculture allocated INR 2,400 crore (approximately USD 290 million) under the National Mission on Sustainable Agriculture to co-fund rice-husk-ash processing facilities that produce sodium silicate on-site [5]. These facilities trim feedstock costs by 15–20% versus imported sodium-silicate solutions, giving domestic silica manufacturers a structural cost advantage. Similar programs are underway in Vietnam and Thailand, positioning ASEAN as a low-cost production hub for the Precipitated Silica Market through 2035.

Battery-Separator Silica Demand

Lithium-ion battery separators increasingly use ultra-fine precipitated silica coatings to improve thermal stability and prevent dendrite penetration [7]. CATL and Samsung SDI have each disclosed procurement contracts for high-purity silica grades exceeding 99.5% SiO₂, with combined contract volumes estimated at 25,000 tons annually by 2027. This application remains nascent but represents a high-margin growth vector for the Precipitated Silica Market.


Restraints Impact Analysis

Restraint ~% Impact on CAGR Geographic Relevance Impact Timeline
Energy-intensive production economics −0.45% Global Long-term (≥4 yr)
Substitution by fumed silica and silica fume −0.35% North America, Europe Medium-term (2–4 yr)
Sodium-silicate feedstock price volatility −0.30% Global Short-term (≤2 yr)
Tightening nano-silica regulatory scrutiny −0.25% Europe Medium-term (2–4 yr)
Water-intensive wet-process waste streams −0.20% Asia-Pacific Long-term (≥4 yr)


Energy-Intensive Production Economics

Wet-process precipitation necessitates prolonged reactor temperatures of 80–95°C and extensive drying stages that consume approximately 8–12 GJ per ton of finished silica [11]. Several mid-tier producers in Europe reported a 300–500 basis point reduction in margins as industrial natural-gas prices rose by 60% between 2022 and 2024. Although dry-process routes partially alleviate this issue, they necessitate a higher capital expenditure per ton of capacity, which presents a challenge for smaller entrants who are interested in rapidly scaling in the Precipitated Silica Market.


Substitution by Alternative Silica Forms

Fumed silica, produced via flame hydrolysis, delivers superior rheological performance in high-value coatings and sealants [12]. When end-use pricing tolerates the premium — fumed silica costs 3–5× more per kilogram — formulators may switch away from precipitated grades. Cabot Corporation's 2024 capacity expansion in Carrollton, Kentucky, added 10,000 tons of fumed-silica output, potentially displacing precipitated silica in select adhesive and electronics applications across North America.

Sodium-Silicate Feedstock Volatility

Approximately 85% of global precipitated silica is manufactured using sodium-silicate solutions derived from soda ash and quartz sand [13]. Soda-ash spot prices in Asia fluctuated by ±18% during 2023–2024 due to Chinese export-quota adjustments and Turkish production disruptions. This volatility compresses manufacturer margins and complicates long-term contract pricing across the supply chain.


Precipitated Silica Market Opportunities

Ultra-Pure Grades for Next-Generation Batteries

Solid-state and silicon-anode battery architectures under development at Toyota and QuantumScape require silica separators with SiO₂ purity exceeding 99.8% [7]. Producers that can certify lot-level purity via inline laser-diffraction analytics will command price premiums of 25–40% over standard grades. This opportunity links directly to the dry-process growth outlined in.

Biomass-Derived Silica for Circular-Economy Compliance

EU Corporate Sustainability Reporting Directive (CSRD) mandates, effective 2025, require large manufacturers to disclose Scope 3 feedstock emissions [16]. Rice-husk-ash-derived silica carries a carbon footprint roughly 35% lower than conventional sodium-silicate routes, positioning biomass-based producers favorably for procurement by sustainability-scored OEMs.

Emerging-Market Capacity in Africa and South America

Sub-Saharan Africa and Brazil's agricultural belts generate substantial rice and sugarcane residues that could serve as silica feedstock [10]. Market Research Future estimates that greenfield plants in Nigeria, Mozambique, and Mato Grosso could serve regional tire and animal-feed demand currently met by imports, capturing a combined addressable opportunity of USD 350–450 million by 2032.

Digital Platforms for Silica Procurement

B2B chemical-procurement platforms such as Knowde and Pinpools now list precipitated silica grades with real-time pricing and specification matching [17]. Producers that integrate API-based ordering and digital certificates of analysis can reduce customer acquisition costs by 12–18%, unlocking margin in the Precipitated Silica Market's highly fragmented mid-tier segment.

Oral-Care and Personal-Care Premiumization

Premium toothpaste brands are increasingly requesting controlled-abrasivity silica with narrow particle-size distributions (d50 of 8–12 µm) for whitening and sensitivity formulations. The global oral-care market is expected to surpass USD 55 billion in 2025, and precipitated silica's share of abrasive-system costs is increasing as brands transition from calcium carbonate to silica-based systems to achieve superior cleaning performance.


Precipitated Silica Market Future Outlook

Electrification Supercycle and Tire Reformulation

The IEA projects global EV sales will reach 45 million units annually by 2030, up from 14 million in 2024 [20]. Each EV tire compound consumes 30–40% more silica than its internal-combustion-engine counterpart, implying an incremental demand of roughly 400,000 tons by 2030. This structural demand shift will reshape the Precipitated Silica Market, pulling production closer to tire-manufacturing clusters in China, India, and Central Europe.

Sustainability Reporting and Scope 3 Procurement

CSRD and SEC climate-disclosure rules require downstream OEMs to quantify embedded emissions in purchased materials [16]. Silica producers with verified lifecycle assessments and biomass-derived feedstock certifications will gain preferred-supplier status. Market Research Future expects sustainability-certified silica to command a 10–15% price premium over conventional grades by 2030, incentivizing rapid adoption of rice-husk and biomass pathways.

AI-Driven Process Optimization

Digital-twin models and machine-learning-based reactor control are beginning to penetrate silica precipitation plants. Evonik's 2024 pilot at its Rheinfelden site demonstrated a 7% yield improvement and 12% energy reduction using predictive-analytics-driven pH and temperature control [4]. Widespread adoption could trim production costs by USD 40–60 per ton by 2030, improving margins across the Precipitated Silica Market.

Platform Consolidation and M&A Activity

Market concentration is likely to rise through 2035 as Tier-1 producers acquire biomass-silica startups and regional capacity. The estimated Herfindahl-Hirschman Index stands at approximately 900 today but could approach 1,200 by 2032 if two or three large transactions materialize. Mid-tier players with differentiated ultra-pure or food-grade portfolios will be the most attractive acquisition targets.


Precipitated Silica Market Segmentation

By Grade

Segment Key Metric Primary Demand Driver
Rubber 58.2% share (2025) Tire and industrial-rubber compounding
Food 4.90% CAGR (2026–2035) Clean-label anti-caking regulations
Feed USD 780 Million (2025) Livestock-nutrition supplementation
Others 3.65% CAGR (2026–2035) Paints, coatings, and adhesives


Rubber-grade precipitated silica remains the backbone of the Precipitated Silica Market, supplying tire compounders, conveyor-belt manufacturers, and footwear sole producers. Highly dispersible silica (HDS) variants designed for green-tire applications now represent approximately 40% of rubber-grade shipments and are growing at roughly twice the rate of standard grades [2].

Food-grade silica is experiencing accelerated adoption as global regulators confirm the safety of amorphous precipitated forms for human consumption. The segment's 4.90% CAGR reflects growing use in powdered beverages, seasoning blends, and pharmaceutical excipients, where precipitated silica provides superior flow properties compared to alternatives [6].

By Form

Segment Key Metric Primary Demand Driver
Powder 51.8% share (2025) Broadest compatibility with rubber and food processing
Beads 6.80% CAGR (2026–2035) Controlled-release oral-care formulations
Micro-Pearls USD 520 Million (2025) Dust-free handling in coatings
Granules 3.40% CAGR (2026–2035) Animal-feed carrier applications


Powder dominates because it integrates seamlessly into existing mixing and compounding equipment at tire factories and food-ingredient blenders. Beads, while a smaller share, are the fastest-growing form in the Precipitated Silica Market due to their uniform particle geometry, which delivers precise abrasivity control valued by premium oral-care brands.

By Production Process

Segment Key Metric Primary Demand Driver
Wet Process 70.4% share (2025) Established infrastructure; scalability
Dry Process 5.25% CAGR (2026–2035) Lower energy intensity; battery-grade purity


Wet-process routes rely on the acidification of sodium-silicate solutions and remain the workhorse technology for high-volume rubber-grade output. Dry-process technologies, including thermal and pyrogenic methods, are gaining ground in applications requiring ultra-high purity, particularly lithium-ion battery separators where trace-metal contamination must fall below 50 ppm [7].

By End-Use Industry

Segment Key Metric Primary Demand Driver
Tires 33.2% share (2025) EV adoption and green-tire mandates
Oral Care & Cosmetics 4.52% CAGR (2026–2035) Premiumization and whitening trends
Agriculture USD 690 Million (2025) Feed-carrier and crop-protection uses
Electronics 4.80% CAGR (2026–2035) Battery-separator and encapsulation demand
Others USD 510 Million (2025) Paints, paper, and industrial coatings


Tires account for roughly a third of total precipitated silica consumption, and the segment's centrality to the Precipitated Silica Market will only intensify as EV penetration rises. Oral-care and cosmetics represent a high-margin niche where silica's controlled abrasivity and whitening performance justify price premiums of 40–60% over standard rubber grades.


Regional Market Share Analysis

Region Key Metric Primary Investment Themes
Asia-Pacific 53.8% share (2025) Rice-husk valorization; EV tire capacity
Europe 22.4% share (2025) Green-tire mandates; CSRD compliance
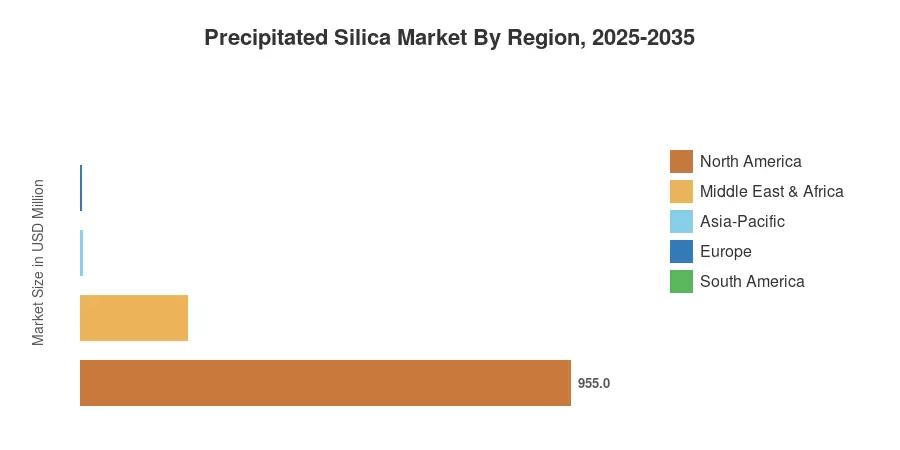
North America USD 955 Million (2025) Battery-separator R&D; food-grade expansion
South America 4.28% CAGR (2026–2035) Agricultural-feed silica; greenfield plants
Middle East & Africa USD 208 Million (2025) Import substitution; construction chemicals
Total USD 6,120 Million (2025)

The Precipitated Silica Market exhibits a concentrated geographic profile, with Asia-Pacific accounting for more than half of global consumption. Regional growth differentials reflect divergent end-use demand mixes, feedstock access, and regulatory environments.


North America

Country Key Metric Key Driver
US 72.5% of regional share Battery-separator contracts and food-grade GRAS filings
Canada 3.85% CAGR Tire-manufacturing reshoring
Mexico USD 85 Million (2025) Automotive-component FDI


The United States drives the bulk of North American demand, with PPG Industries and W.R. Grace operating large-scale facilities in Pennsylvania and Maryland, respectively. DOE's Industrial Decarbonization Roadmap allocates USD 6.3 billion through 2030 for energy-intensive process industries, including silica precipitation, incentivizing plant-level electrification upgrades [9].

Europe

Country Key Metric Key Driver
Germany 28.6% of regional share Automotive OEM green-tire specifications
UK 3.92% CAGR Oral-care and specialty coatings demand
France USD 185 Million (2025) Solvay and Rhodia production hubs
Italy 9.4% of regional share Ceramic-glaze and footwear applications
Spain 3.70% CAGR Tire retreading industry growth
Nordic Countries USD 65 Million (2025) Pulp-and-paper filler applications
Russia 5.2% of regional share Domestic capacity rebuilding
Rest of Europe 3.55% CAGR Eastern European tire plant expansions


Europe's regulatory landscape strongly favors silica over carbon-black fillers. The EU's Euro 7 vehicle-emission proposal ties tire labeling to rolling-resistance thresholds that effectively mandate silica loading above 80 phr in passenger-car compounds [2]. Germany's share reflects its outsized automotive-OEM base, while France benefits from legacy production infrastructure established by Solvay's former Rhodia silica division.

Asia-Pacific

Country Key Metric Key Driver
China 38.4% of regional share Massive tire-manufacturing base
India 5.10% CAGR Rice-husk-ash feedstock projects
Japan USD 290 Million (2025) Electronics and battery-separator applications
South Korea 4.45% CAGR EV battery supply-chain integration
ASEAN 14.8% of regional share Low-cost production expansion
Rest of Asia-Pacific 3.80% CAGR Emerging agricultural-feed demand


Asia-Pacific dominance in the Precipitated Silica Market stems from China's position as the world's largest tire producer and India's emergence as a cost-advantaged silica supplier. Quechen Silicon Chemical and Oriental Silicas Corporation have collectively added over 200,000 tons of annual capacity since 2022, while Madhu Silica's Gujarat facility now exports to 40+ countries [5].

South America

Country Key Metric Key Driver
Brazil 62.3% of regional share Tire and animal-feed industries
Argentina USD 42 Million (2025) Agricultural chemical carrier demand
Rest of South America 3.90% CAGR Mining-sector processing aids


Brazil's tire industry, anchored by Bridgestone, Continental, and Pirelli plants in São Paulo state, consumes the majority of South American precipitated silica output. Sugarcane-bagasse ash valorization presents a feedstock opportunity analogous to rice-husk programs in Asia.

Middle East & Africa

Country Key Metric Key Driver
Saudi Arabia 31.5% of regional share Construction-chemical demand
UAE 4.15% CAGR Re-export hub for African markets
South Africa USD 38 Million (2025) Mining and rubber processing
Egypt 3.75% CAGR Domestic detergent and personal-care growth
Rest of MEA 18.2% of regional share Import-substitution strategies


The MEA region remains heavily import-dependent, with over 70% of precipitated silica consumed sourced from Asian exporters. Saudi Arabia's Vision 2030 industrialization targets include downstream chemical processing, and the Saudi Industrial Development Fund has earmarked USD 1.2 billion for specialty-chemical plant construction, creating an opening for local silica production [19].


Precipitated Silica Market By Region, 2025-2035

Competitive Benchmarking

The Precipitated Silica Market displays moderate concentration, with an estimated Herfindahl-Hirschman Index of approximately 900 and the five largest suppliers accounting for roughly 48–52% of global installed capacity. Competitive differentiation revolves around three axes: geographic reach, grade portfolio breadth (rubber vs. food vs. ultra-pure), and feedstock-cost positioning through biomass integration.

Company Est. Revenue Share Range Key Offerings Strategic Positioning
Evonik Industries ~12–15% Ultrasil HDS, SIPERNAT food-grade Global leader in highly dispersible grades
Solvay ~8–11% Zeosil premium, Tixosil Strong European automotive-OEM relationships
PPG Industries ~7–9% Hi-Sil, Lo-Vel North American market anchor
W.R. Grace ~5–7% SYLOID, LUDOX Specialty food and pharma grades
Tosoh Silica ~4–6% Nipsil Japanese electronics and oral-care focus
Madhu Silica ~3–5% Madhucarb, Madhusil Cost-advantaged Indian production
Quechen Silicon Chemical ~3–5% QS-series HDS High-volume Chinese capacity
Oriental Silicas Corporation ~2–4% Various rubber and feed grades ASEAN regional leader
Wacker Chemie ~2–3% HDK pyrogenic and precipitated lines Hybrid fumed/precipitated portfolio
Huber Engineered Materials ~2–3% Zeothix, Zeopol Specialty coatings and adhesives


Recent News & Developments

  • Evonik Industries (September 2024): Inaugurated a EUR 200 million highly dispersible silica plant in Charleston, South Carolina, adding 40,000 tons of annual capacity to serve North American tire OEMs [4].
  • Solvay (June 2024): Announced a joint venture with an Indian rice-husk processor to build a 30,000-ton biomass-derived silica plant in Andhra Pradesh, targeting a 2026 commissioning date [5].


  • European Food Safety Authority (January 2024): Published a positive safety re-evaluation of amorphous precipitated silica (E551), clarifying particle-size limits and nano-fraction thresholds [6].
  • Quechen Silicon Chemical (November 2023): Completed a 50,000-ton capacity expansion at its Zhejiang facility, raising total output capacity to 280,000 tons annually [21].


  • Continental AG (May 2023): Released a technical white paper quantifying silica-loading benefits for EV tire rolling resistance, projecting a 30–40% increase in silica demand per tire versus ICE equivalents [2].


Precipitated Silica Market Report Scope

Parameter Detail
Market Scope Global Precipitated Silica Market by Grade, Form, Production Process, End-Use Industry, and Geography
Study Period 2021–2035
CAGR (Forecast) 4.22% (2026–2035)
Base Year Value USD 6,120 Million (2025)
Forecast Endpoint USD 9,250 Million (2035)
Fastest Growing Segment Food Grade (by Grade); Beads (by Form)
Companies Profiled 10
Valuation Currency USD Million


FAQs

What purity thresholds distinguish battery-grade precipitated silica from standard rubber grades?
Battery-separator silica requires SiO₂ content above 99.5% with trace metals below 50 ppm, roughly ten times stricter than rubber-grade specifications [7]. This demands dedicated dry-process production lines with inline laser-diffraction monitoring.
How do long-term supply agreements affect pricing stability in the Precipitated Silica Market?
Most Tier-1 tire manufacturers negotiate 3–5-year contracts with silica suppliers indexed to soda-ash and energy costs [13]. These agreements dampen spot-price volatility but limit upside for producers during favorable cycles.
What role does particle-size distribution play in oral-care silica selection?
Toothpaste formulators target a d50 of 8–12 µm and a narrow span to balance cleaning efficacy against enamel abrasion [8]. Deviations outside this range result in either insufficient plaque removal or excessive tooth-surface wear.
Can precipitated silica be recycled from end-of-life tires?
Pyrolysis of scrap tires recovers a silica-rich char, but contaminants from carbon black, zinc oxide, and sulfur limit its reuse to low-grade filler applications [11]. Commercial-scale purification remains economically unviable as of 2025.
How does the Precipitated Silica Market differ from the fumed silica market in competitive structure?
Fumed silica production is concentrated among three global players controlling over 70% of capacity, whereas precipitated silica features broader fragmentation with ten-plus significant producers [12]. Entry barriers are lower for precipitated routes.
What certifications do food-grade precipitated silica suppliers need to maintain?
Suppliers must hold FSSC 22000 or ISO 22000 certification and comply with USP-NF, EP, and JECFA monograph standards [6]. Annual third-party audits verify nano-fraction limits and heavy-metal thresholds.
How does the Precipitated Silica Market outlook shift if EV adoption slows below IEA projections?
A 20% shortfall in EV sales versus IEA forecasts would reduce incremental silica demand by approximately 80,000–100,000 tons annually [20]. Growth would moderate but remain positive given food-grade and electronics tailwinds.    
Author
Author
Author Profile
Chitranshi Jaiswal LinkedIn
Team Lead - Research
Chitranshi is a Team Leader in the Chemicals & Materials (CnM) and Energy & Power (EnP) domains, with 6+ years of experience in market research. She leads and mentors teams to deliver cross-domain projects that equip clients with actionable insights and growth strategies. She is skilled in market estimation, forecasting, competitive benchmarking, and both primary & secondary research, enabling her to turn complex data into decision-ready insights. An engineer and MBA professional, she combines technical expertise with strategic acumen to solve dynamic market challenges. Chitranshi has successfully managed projects that support market entry, investment planning, and competitive positioning, while building strong client relationships. Certified in Advanced Excel & Power BI she leverages data-driven approaches to ensure accuracy, clarity, and impactful outcomes.

Research Approach


Secondary Research

The secondary research process involved comprehensive analysis of regulatory chemical databases, peer-reviewed materials science journals, industrial chemistry publications, and authoritative chemical industry organizations. Key sources included the United States Geological Survey (USGS) Mineral Commodity Summaries, US Food and Drug Administration (FDA) Food Additive Status Database, European Chemicals Agency (ECHA) Registration Database, Occupational Safety and Health Administration (OSHA) Silica Standards, National Institute for Occupational Safety and Health (NIOSH) Crystalline Silica Studies, International Rubber Study Group (IRSG) Statistical Bulletin, Tire Industry Association (TIA) Technical Reports, American Chemistry Council (ACC) Chemical Economics Handbook, Food Chemicals Codex (FCC) Standards, ASTM International Silica Standards Committee (D01), International Organization for Standardization (ISO) TC 45 (Rubber and rubber products), European Tyre and Rubber Manufacturers' Association (ETRMA) Industry Statistics, PubMed/NCBI Toxicology and Industrial Health Research, Scopus Materials Science Database, US Census Bureau Chemical Industry Reports, and national geological survey reports from key silica-producing markets.

Results for rubber-grade precipitated silica, food-grade silica, and specialty non-rubber grades were compiled from these sources, together with data on production volumes, regulatory compliance, occupational exposure, trade flows, and market landscapes.


Primary Research

To gather both qualitative and quantitative information, the primary research process involved interviewing players from both the supply and demand sides. Executives from companies producing precipitated silica, sodium silicate, and specialty chemicals, as well as those in charge of regulatory compliance and commercial affairs, were among the supply-side sources. Procurement directors from rubber compounding facilities, quality assurance managers from food processing companies, technical directors from paint and coating formulators, and chief procurement officers from tire manufacturers (Bridgestone, Michelin, Goodyear tier suppliers) made up the demand-side sources. The market segmentation was confirmed through primary research, which also confirmed the expansion timelines and provided insights into the following topics: the sustainability initiatives, including the development of bio-based silica, the price volatility of raw materials (sulfuric acid, sodium silicate), and the substitution dynamics between precipitated silica and carbon black/fumed silica.

Primary Respondent Breakdown:

By Designation: C-level Primaries (28%), Director Level (35%), Others (37%)

By Region: Asia-Pacific (40%), North America (25%), Europe (28%), Rest of World (7%)

By Value Chain Position: Raw Material Suppliers (15%), Precipitated Silica Manufacturers (35%), Tire/Rubber End-Users (30%), Food/Cosmetic Formulators (12%), Distributors/Traders (8%)


Market Size Estimation

Global market valuation was derived through production capacity mapping and consumption volume analysis across industrial applications. The methodology included:

Identification of 50+ key manufacturers across Asia-Pacific (China, Japan, India, South Korea), North America (US, Canada), Europe (Germany, France, Netherlands), and Latin America (Brazil, Mexico)

Product mapping across rubber grade (tire reinforcement, industrial rubber), food grade (anti-caking, carriers), and non-rubber grade (toothpaste thickening, coatings matting, agricultural carriers) silica categories

Analysis of reported and modeled annual capacities specific to precipitated silica versus fumed silica and silica gel product portfolios

Coverage of manufacturers representing 75-80% of global installed capacity in 2024

Extrapolation using bottom-up (end-use industry consumption volume × ASP by region, accounting for regional price differentials between APAC and Western markets) and top-down (capacity utilization rates × manufacturer revenue validation) approaches to derive segment-specific valuations for tire industry (green tire/high-performance tire silica demand), oral care applications, and food-grade specialty segments

Key Source Differentiation for Precipitated Silica:

Regulatory & Safety: USGS Mineral Yearbook (silica statistics section), FDA 21 CFR 172.480 (food-grade silica regulations), ECHA SVHC Candidate List monitoring for synthetic amorphous silica classification, IARC Monographs (carcinogenicity assessments), NIOSH Manual of Analytical Methods (silica exposure measurement).

Industry Associations: World Rubber Summit Statistics, China Rubber Industry Association (CRIA) Tire Data, Japan Automobile Tire Manufacturers Association (JATMA), Indian Rubber Manufacturers Research Association (IRMRA).

Technical Standards: ASTM D1566 (Rubber terminology including silica reinforcement), ISO 5794 (Rubber compounding ingredients—precipitated hydrated silica specifications), JIS K 6220 (Rubber compounding ingredients—test methods).

Trade & Supply Chain: UN Comtrade Database (HS Code 281122: Silicon dioxide), ICIS Chemical Pricing (sodium silicate and precipitated silica contract prices), Statista Chemical Industry Outlook.

Download Free Sample

Kindly complete the form below to receive a free sample of this Report

Download PDF ×

We do not share your information with anyone. However, we may send you emails based on your report interest from time to time. You may contact us at any time to opt-out.

















