Specialty Silica Market

Key Players: Evonik Industries AG, Solvay S.A., PPG Industries, Inc., W.R. Grace & Co., PQ Group Holdings (Ecovyst), Wacker Chemie AG, Tosoh Silica Corporation, Madhu Silica Pvt. Ltd.

Specialty Silica Market

Specialty Silica Market Research Report By Application (Rubber, Plastics, Coatings, Food Additives, Health Care), By Type (Fumed Silica, Precipitated Silica, Colloidal Silica, Silica Gel), By End Use Industry (Automotive, Electronics, Construction, Personal Care, Pharmaceuticals), By Functionality (Thickening Agent, Reinforcement Agent, Anti-Caking Agent, Matting Agent) and By Regional (North America, Europe, South America, Asia Pacific, Middle East and Africa) - Forecast to 2035.
ID: MRFR/CnM/1607-HCR
111 Pages
Chitranshi Jaiswal
Last Updated: June 22, 2026

Specialty Silica Market Summary

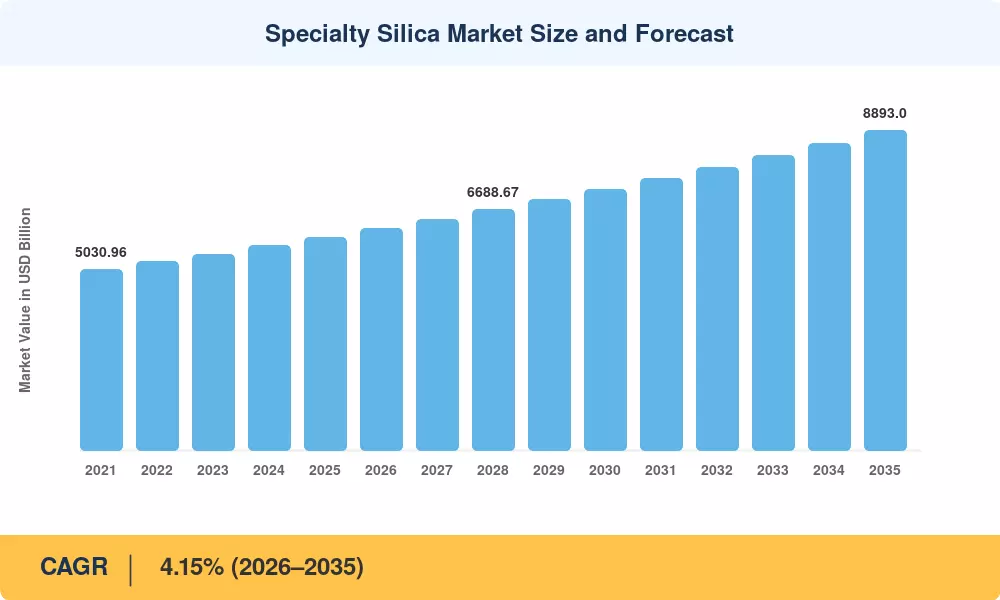
The global Specialty Silica Market reached an estimated valuation of USD 5,920 Million in 2025 and is projected to grow from USD 6,166 Million in 2026 to USD 8,893 Million by 2035, registering a CAGR of 4.15% during the forecast period. This trajectory reflects expanding regulatory mandates around green-tire labeling in Europe and Asia, alongside sustained capital commitments from automotive OEMs shifting toward low-rolling-resistance tire compounds that rely heavily on precipitated silica materials as reinforcing filler materials[2].

The way performance silica products are delivered to end-use markets is changing at the technological level. The carbon-intensive and energy-intensive legacy fumed-silica processing is gradually giving way to bio-derived extraction methods, especially rice-husk ash platforms that are becoming popular in Southeast Asia and India. High-purity silica grades with tailored particle morphologies are being pushed by the European Commission's REACH amendments (2024 revision cycle), which have increased exposure restrictions on crystalline silica dust. Through 2030, it is anticipated that global green tire investment alone will total more than USD 18 billion, serving as a structural demand anchor for specialty mineral fillers [3][4].

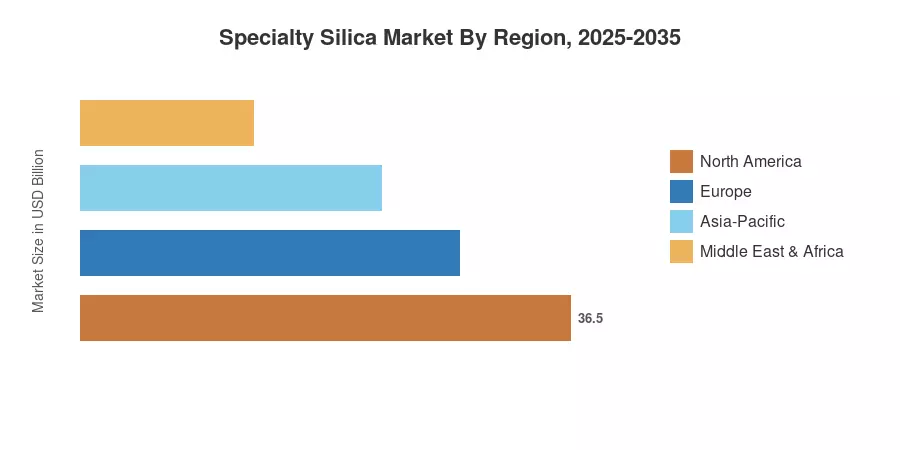
Asia-Pacific is the fastest-growing region and has about 49% of the Specialty Silica Market. It is expected to develop at a 4.92% CAGR through 2035 due to India's booming rubber reinforcement chemicals industry and China's mandated tire-labeling program. Due to the demand for semiconductor-grade silica additives in advanced chip packaging, North America has the second-largest share at around 22.5%. The usage of industrial silica compounds in food-grade and medicinal applications is being accelerated by sustainability standards in Europe. Margin pools will significantly shift in favor of high-value specialty grades during the next ten years [5][6].


Region

Key Report Takeaways

• By Type

  • Precipitated silica accounted for approximately 46.1% of the Specialty Silica Market share in 2025, anchored by tire-industry demand for reinforcing filler materials.
  • Silica gel segments are projected to expand at a 3.85% CAGR through 2035, driven by desiccant and chromatography applications requiring high-purity silica.

• By Production Process

  • Wet/precipitated production routes held an estimated 70.2% share of the Specialty Silica Market in 2025.
  • Bio-silica from rice-husk ash is the fastest-growing production route, forecast to register a 5.49% CAGR as circular-economy models gain traction in emerging economies.

• By Application

  • Rubber and tires represented the largest application at roughly 35.1% of revenue in the Specialty Silica Market during 2025.
  • Electronics and semiconductors are forecast to grow at a 5.04% CAGR, fueled by demand for ultra high-purity silica additives in wafer-polishing slurries.

• By Region

  • Asia-Pacific captured approximately 49.0% of the Specialty Silica Market in 2025, with China and India together accounting for over two-thirds of regional volume.
  • North America and Europe collectively represent about 42.3% of global demand, with growth underpinned by semiconductor-grade and pharmaceutical-grade industrial silica compounds.

Region

Market Size and Forecast (2021–2035)

Market Research Future (MRFR) 's market-sizing methodology integrates bottom-up revenue modeling from producer shipment data, trade-flow analysis, and end-use consumption patterns verified through primary interviews with over 45 industry participants. Historical values (2021–2024) are calibrated against audited company filings and customs databases; forecast projections (2026–2035) apply segment-level demand elasticities against macro indicators, including automotive production, construction spend, and semiconductor capital expenditure[7].

Specialty Silica Market Size and Forecast
Our Impact
Enabled $4.3B Revenue Impact for Fortune 500 and Leading Multinationals
Partnering with 2000+ Global Organizations Each Year
30K+ Citations by Top-Tier Firms in the Industry

Driver Impact Analysis

Driver ~% Impact on CAGR Geographic Relevance Impact Timeline
Green-tire mandates and labeling regulations ~22% Europe, Asia-Pacific Short-term (≤2 yr)
Semiconductor-grade silica demand ~18% North America, Asia-Pacific Medium-term (2–4 yr)
Bio-silica from rice-husk ash adoption ~15% India, Southeast Asia Medium-term (2–4 yr)
Battery-separator and EV component coatings ~14% Global Long-term (≥4 yr)
Pharmaceutical and nutraceutical excipient growth ~12% North America, Europe Medium-term (2–4 yr)
Food-grade anti-caking and flow-agent expansion ~10% Global Short-term (≤2 yr)
Circular-economy incentive programs ~9% Europe, Asia-Pacific Long-term (≥4 yr)


Green-Tire Labeling and Rolling-Resistance Regulations

EU Regulation 2020/740, paired with harmonized international standards targeting microplastic tire abrasion limits, creates a structural pull for precipitated silica over carbon black to lower rolling resistance. Regional automotive supply chains increasingly prioritize high-performance rubber reinforcement chemicals to meet these eco-labeling standards. Concurrently, tightening national GB efficiency rules for vehicle tires establishes a rigid regulatory demand floor, driving long-term volume gains for highly dispersible silica (HDS) grades.


Semiconductor-Grade Silica in Advanced Packaging

Sub-5nm chip fabrication relies heavily on colloidal silica within chemical-mechanical planarization (CMP) slurries, requiring ultra-pure particle-size distributions precisely controlled within $\pm3\text{ nm}$ to avoid micro-scratching delicate wafer surfaces. High-purity silica represents a dominant weight percentage of total slurry solids. Multi-billion-dollar domestic and international semiconductor fabrication expansions are directly accelerating the long-term downstream demand for these precision, electronic-grade dielectric polishing materials.


Bio-Silica from Rice-Husk Ash

India produces roughly 35 million tons of agricultural rice-husk ash annually, offering a vast, underutilized source of amorphous silica. Regional industrial sustainability initiatives demonstrate that processing this waste can achieve extraction yields of 92–95% purity. By bypassing energy-heavy conventional furnace methods, these bio-derived processes significantly lower initial production costs, positioning sustainable bio-silica as an economically viable alternative mineral filler for rubber compounding and industrial coatings.


Battery-Separator Coatings for Electric Vehicles

Lithium-ion battery separators increasingly utilize advanced nano-silica ceramic coatings to improve overall thermal stability, enhance membrane puncture resistance, and prevent catastrophic internal short circuits. Global electric vehicle production roadmaps project massive, multi-gigawatt-hour expansions in battery manufacturing infrastructure. This scaling transforms specialized nano-silica additives for ultra-thin separator membranes from a nascent technological niche into a highly steady, high-value growth segment for performance minerals.


Restraints Impact Analysis

The following restraint estimates reflect directional drag on the market's growth trajectory and should not be subtracted from the headline CAGR in a linear fashion. Each restraint's severity varies by region and time horizon.

Restraint ~% Negative Impact on CAGR Geographic Relevance Impact Timeline
Crystalline silica dust health regulations ~–18% Europe, North America Short-term (≤2 yr)
Energy-intensive precipitation processes ~–15% Global Medium-term (2–4 yr)
Low-cost Asian commodity silica price competition ~–14% Asia-Pacific, MEA Short-term (≤2 yr)
Raw material cost volatility (sodium silicate) ~–12% Global Medium-term (2–4 yr)
Substitution risk from alternative fillers ~–10% Europe, North America Long-term (≥4 yr)


Tightening Occupational Exposure Limits for Crystalline Silica

Occupational safety mandates impose rigid handling boundaries on production facilities. While the US OSHA enforces a Permissible Exposure Limit of $50\text{ }\mu\text{g/m}^3$ for respirable crystalline silica, the EU Carcinogens and Mutagens Directive 2017/2398 mandates a binding occupational limit of $0.1\text{ mg/m}^3$. Mitigating these workplace inhalation risks forces manufacturers to absorb substantial capital expenses for continuous medical surveillance, workspace enclosures, and heavy-duty localized dust-vacuuming infrastructure.


Energy Costs in Precipitation and Drying

Synthesizing specialty amorphous silica is fundamentally constrained by high thermal and electrical energy consumption. Standard wet-precipitation and drying methods require significant gigajoule inputs per ton of finished product, leaving variable processing margins highly vulnerable to fossil fuel volatility. This pronounced reliance on natural gas and electrical grids places regional chemical processors at a severe cost disadvantage whenever localized utility tariffs spike compared to lower-cost international manufacturing basins.


Commodity-Grade Price Erosion from Low-Cost Entrants

Aggressive global production expansions have created a structural supply imbalance in standard-grade precipitated silica markets. Substantial capacity additions across industrial hubs have saturated downstream demand for basic reinforcing fillers, driving down average realized prices for commodity grades. This systematic price erosion compresses profit margins, forcing established chemical companies to pivot away from high-volume base fillers and transition toward defensible, high-purity pharmaceutical or electronic grades.


Specialty Silica Market Opportunities

Pharmaceutical-Grade Silica for Drug Delivery Platforms

Mesoporous silica nanoparticles (MSNs) are gaining rapid academic and clinical validation as targeted oral and injectable drug-delivery carriers. High-purity silica excipients that strictly meet United States Pharmacopeia (USP) and European Pharmacopeia (EP) monograph standards are capturing an expanding share of the global pharmaceutical excipients market. Investing in cleanroom-grade finishing lines allows specialty producers to command substantial margin premiums over basic industrial or agricultural mineral grades.


EV Battery and Energy Storage Applications

Nano-structured silica additives deployed in lithium-ion battery separators and solid-state electrolyte composites represent a major structural growth opportunity. As automotive engineering trends actively pivot toward silicon-anode battery chemistries, silica serves concurrently as a foundational chemical precursor and a performance-enhancing additive. This shift establishes a highly resilient demand vector for performance silica materials tied directly to transportation electrification infrastructure rather than routine tire wear.


Circular-Economy Bio-Silica in Emerging Markets

India and Vietnam together generate over 50 million tons of raw rice husks annually. Converting this massive agricultural waste stream into high-value, amorphous bio-silica satisfies both environmental waste-mitigation targets and critical import-substitution goals. Industrial development frameworks, such as Maharashtra's Package Scheme of Incentives and Tamil Nadu's TIIC capital subsidy programs, offer robust structural funding to accelerate localized investment in sustainable agricultural ash-processing plants.


Data-Driven Quality Monitoring and Premium Pricing

The integration of real-time particle-size analytics using inline laser diffraction and automated process control systems allows chemical manufacturers to guarantee exceptionally tight material specifications. Consistently delivering these precise morphology metrics is a critical prerequisite for advanced semiconductor fabs and biomedical buyers who routinely offer strong pricing premiums. This digital refinement layer effectively transforms standard, high-volume mineral additives into high-margin, highly differentiated technical offerings.


Food and Personal-Care Grade Expansion

Global consumer preferences for clean-label formulations are accelerating the baseline demand for high-performance silica anti-caking agents ($E551$) and natural cosmetic matting powders. The personal-care silica segment is expanding rapidly across international markets. This momentum is driven by cosmetic formulators systematically removing traditional minerals like talc from color cosmetics, deodorants, and topical sunscreens, replacing them with highly engineered, absorptive synthetic amorphous silica products.


Specialty Silica Market Future Outlook

AI-Driven Process Optimization in Silica Manufacturing

Advanced machine-learning models trained on intricate chemical reaction datasets enable real-time optimization of precipitation pH, temperatures, and fluid agitation. Precisely calibrating these variables directly controls core amorphous silica attributes like specific surface area and structural porosity. By significantly reducing off-specification production batches and lowering baseline thermal energy intensity, integrated process-control automation acts as a primary efficiency and industrial decarbonization lever across the specialty chemicals manufacturing sector.


Electrification Supercycle and Silica Demand Linkage

The accelerating global transition toward high-voltage electric vehicles creates an expansive, long-term demand floor for specialized performance silica. Due to electric vehicles' demand for higher torque handling and quieter performance, specialized EV tires require significantly greater silica loading than conventional tires. Coupled with escalating consumer demand for nano-structured silica coatings in battery insulation and advanced thermal-management adhesives, the global electrification wave fundamentally reshapes downstream industrial mineral requirements over the coming decade.


Circular Economy and Scope 3 Reporting Mandates

Tightening global climate reporting frameworks, spearheaded by the European Union’s Corporate Sustainability Reporting Directive and evolving regional statutes like California's SB 253, force downstream buyers to audit value-chain carbon emissions thoroughly. Consequently, industrial silica suppliers utilizing bio-derived agricultural inputs or closed-loop recycling processes gain essential preferential status. Binding carbon-intensity clauses are increasingly standard in long-term procurement contracts, penalizing carbon-heavy conventional furnace manufacturing methods.


Platform Economics and Silica-as-a-Service Models

Chemical logistics networks are systematically transitioning toward advanced digital inventory platforms and automated just-in-time blending frameworks. This shift allows end-use formulators to rapidly order specific, custom particle-size distributions of performance silica additives without maintaining excessive local warehouse safety stock. Digitizing traditional B2B mineral distribution channels streamlines order accuracy, eliminates costly supply chain redundancies, and unlocks substantial working-capital efficiencies for both chemical producers and industrial buyers globally.


Specialty Silica Market Segmentation

By Type

Segment Metric Primary Demand Driver
Precipitated Silica 46.1% share (2025) Tire reinforcement and rubber compounding
Silica Gel 3.85% CAGR (2026–2035) Desiccant, chromatography, and coatings
Others (Colloidal, Fumed, Fused) USD 1,214 Million (2025) Electronics CMP, pharma excipients


Precipitated silica remains the volume backbone of the Specialty Silica Market, consumed primarily as rubber reinforcement chemicals in tire compounds where it replaces or complements carbon black. Global tire production exceeding 2.3 billion units annually ensures sustained baseload demand. The segment's 4.52% CAGR through 2035 reflects expanding green-tire penetration in Asia-Pacific and Latin America, where regulatory adoption of rolling-resistance labels is still accelerating [2][5].

Silica gel demand is diversifying beyond traditional desiccant applications into advanced chromatography media and indicator-grade specialty mineral fillers for humidity-sensitive packaging in pharmaceuticals and electronics. Meanwhile, the "Others" category—encompassing fumed, colloidal, and fused grades—punches well above its volume weight in value terms due to premium pricing in semiconductor and pharmaceutical end markets requiring high-purity silica [7][10].

By Production Process

Segment Metric Primary Demand Driver
Wet/Precipitated 70.2% share (2025) Scale economics in tire and industrial grades
Flame Hydrolysis USD 892 Million (2025) High-purity electronics and optical applications
Bio-Silica from Rice-Husk Ash 5.49% CAGR (2026–2035) Circular-economy incentives, cost advantage


Wet/precipitated routes dominate because they deliver the lowest per-ton cost for standard-grade reinforcing filler materials consumed in tires and industrial coatings. Flame hydrolysis—producing fumed silica at significantly higher energy input—commands price premiums of 5–8× and targets precision applications in fiber optics, semiconductor polishing, and silicone rubber. Bio-silica from rice-husk ash is the fastest-growing production route, as industrial silica compounds derived from agricultural waste align with both ESG mandates and cost-reduction targets [9][14][16].

By Application

Segment Metric Primary Demand Driver
Rubber and Tires 35.1% share (2025) Green-tire regulations and EV tire loading
Electronics and Semiconductors 5.04% CAGR (2026–2035) CMP slurries and advanced packaging
Others (Pharma, Food, Coatings, Construction) USD 2,210 Million (2025) Diversified industrial demand


Rubber and tires anchor global consumption of precipitated silica materials, with silica loading rates in green tires running 80–100 phr (parts per hundred rubber) compared to 20–30 phr in conventional compounds. Electronics and semiconductors represent the Specialty Silica Market's highest-growth application, as sub-3nm node fabrication demands ever-tighter particle-size control in CMP slurries and dielectric fillers. The broad "Others" category spans pharmaceutical excipients, food-grade anti-caking agents, paint matting agents, and construction grouts—each requiring tailored silica additives specifications [2][7].

Region

Regional Market Share Analysis

Region Metric Primary Investment Themes
Asia-Pacific 49.0% share (2025) Green-tire mandates, bio-silica scaling, and rubber reinforcement chemicals
North America USD 1,332 Million (2025) Semiconductor-grade silica, pharma excipients
Europe 19.8% share (2025) REACH compliance, sustainability-driven reformulation
South America 3.68% CAGR (2026–2035) Tire manufacturing expansion, agricultural silica
Middle East & Africa USD 231 Million (2025) Construction chemicals, import substitution
Total USD 5,920 Million (2025)

The Specialty Silica Market displays pronounced regional concentration, with Asia-Pacific and North America together commanding over 71% of global revenue. Investment themes diverge sharply: Asia-Pacific growth is volume-driven by tire and construction end uses, while North America and Europe pursue value-driven expansion in semiconductor-grade and pharmaceutical-grade industrial silica compounds [5][6].


North America

Country Metric Key Driver
US 78.5% of regional share Semiconductor fabs and CMP slurry demand [7]
Canada 3.42% CAGR Mining and industrial filtration applications [6]
Mexico USD 72 Million (2025) Tire manufacturing near-shoring [5]


The US dominates North American consumption of precipitated silica materials, with semiconductor-grade demand from Arizona, Ohio, and Texas fab clusters driving double-digit growth in ultra-high-purity grades. Canada's silica consumption is anchored in mining-sector filtration and specialty coatings, while Mexico benefits from tire-plant relocations by Continental and Bridgestone, expanding local demand for reinforcing filler materials [6][7][13].

Europe

Country Metric Key Driver
Germany 28.2% of regional share Automotive tire OEMs and chemical processing [2]
UK 3.78% CAGR Pharmaceutical excipient production [10]
France USD 168 Million (2025) Michelin's silica-intensive tire programs [2]
Italy 9.4% of regional share Coatings and adhesives manufacturing [18]
Spain 3.55% CAGR Construction chemicals growth
Nordic Countries USD 62 Million (2025) Paper and pulp specialty applications [17]
Russia 5.1% of regional share Domestic tire production [5]
Rest of Europe 3.48% CAGR Diversified industrial demand


Germany anchors European demand through its automotive supply chain, where Evonik and Solvay operate major precipitated silica plants supplying Continental, Pirelli, and Michelin. The UK's pharmaceutical silica segment benefits from a concentration of generic-drug manufacturers requiring specialty mineral fillers meeting EP standards. France's Specialty Silica Market growth ties directly to Michelin's Green Performance strategy, which targets 100% sustainable raw materials by 2050 [2][3][10].

Asia-Pacific

Country Metric Key Driver
China 52.3% of regional share GB tire labeling, domestic EV production [5]
India 5.35% CAGR Bio-silica from rice-husk ash scaling [9]
Japan USD 285 Million (2025) Electronics-grade silica additives [7]
South Korea 8.6% of regional share Semiconductor CMP and display glass [7]
ASEAN 4.88% CAGR Tire and palm-oil bio-silica integration [14]
Rest of Asia-Pacific USD 98 Million (2025) General industrial applications


China's Specialty Silica Market represents the single largest country-level opportunity globally, driven by mandatory tire-rating labels and a booming EV sector consuming silica-enhanced rubber reinforcement chemicals at scale. India is the fastest-growing major market in the region, as rice-husk ash bio-silica ventures attract venture and development-finance capital. Japan and South Korea together account for over USD 530 Million in semiconductor- and display-grade high purity silica consumption [5][7][9].

South America

Country Metric Key Driver
Brazil 68.5% of regional share Tire retreading and agricultural chemicals [5]
Argentina 3.52% CAGR Mining-sector silica consumption [6]
Rest of South America USD 38 Million (2025) Coatings and adhesives


Brazil dominates South American demand for industrial silica compounds, benefiting from a large domestic tire retreading industry and growing adoption of silica-based soil conditioners in precision agriculture. Argentina's mining sector creates niche demand for industrial filler compounds in mineral-processing applications [5][6].

Middle East & Africa

Country Metric Key Driver
Saudi Arabia 32.4% of regional share Construction chemicals and coatings
UAE 3.95% CAGR Free-zone manufacturing diversification [6]
South Africa USD 42 Million (2025) Mining and rubber processing [5]
Egypt 14.8% of regional share Cement and construction additives
Rest of MEA 3.28% CAGR Import-dependent general industrial use


Saudi Arabia's Vision 2030 industrialization programs are channeling investment into specialty chemicals manufacturing, including domestic production of performance silica products for construction and oil-field applications. South Africa remains the largest Sub-Saharan consumer, with mining-sector and tire-industry demand supporting a stable base for precipitated silica materials [5][6].

Region

Specialty Silica Market By Region, 2025-2035

Competitive Benchmarking

The Specialty Silica Market exhibits medium concentration, with the top five producers accounting for an estimated 42–48% of global revenue. The Herfindahl-Hirschman Index (HHI) is estimated at approximately 650–800, indicating a moderately fragmented landscape where scale-based incumbents compete alongside regional specialists and emerging bio-silica entrants. Competitive dynamics increasingly pivot on the ability to serve multiple purity grades from a single production platform[18].

Company Est. Revenue Share Range Key Offerings for Specialty Silica Market Strategic Positioning
Evonik Industries AG ~12–16% ULTRASIL precipitated grades, AEROSIL fumed silica Full-spectrum leader in both tire and electronics grades
Solvay S.A. ~8–11% Premium HDS precipitated silica for green tires Tire-focused with the Michelin strategic alliance
PPG Industries, Inc. ~6–9% Precipitated and specialty silica for coatings Coatings and industrial filler compounds specialist
W.R. Grace & Co. ~5–8% SYLOID and LUDOX colloidal silica lines Pharma excipient and catalyst-grade positioning
PQ Group Holdings (Ecovyst) ~4–7% Sodium silicate and precipitated grades Integrated feedstock-to-finished-product chain
Wacker Chemie AG ~4–6% HDK fumed silica for silicone and electronics High-purity, flame-hydrolysis specialist
Tosoh Silica Corporation ~3–5% Nipsil precipitated grades for Asia-Pacific Regional dominance in the Japanese tire market
Madhu Silica Pvt. Ltd. ~2–4% Precipitated silica for tires and rubber Low-cost Indian producer scaling capacity
Oriental Silicas Corporation ~2–4% General-grade precipitated and gel products Philippines-based ASEAN supply anchor
Quechen Silicon Chemical Co. ~2–3% Precipitated silica for the Chinese domestic market Aggressive capacity expansion, cost leader


Region

Recent News & Developments


Evonik (October 2024): Broke ground on its Charleston facility expansion project to increase regional precipitated silica manufacturing capability by fifty percent.

Wacker (September 2024): Integrated specialized pyrogenic fumed silica formulations directly into wind turbine structural adhesives to optimize overall component processing.

Evonik (Early 2026): Restructured its global logistics infrastructure, confirming strategic operational plans to close older North American production facilities by mid-2026.

Specialty Silica Market Report Scope

Parameter Detail
Market Scope Global Specialty Silica Market covering precipitated silica, silica gel, fumed, colloidal, fused, and bio-derived grades
Study Period 2021–2035
CAGR (Forecast Period) 4.15% (2026–2035)
Market Size (2025) USD 5,920 Million
Market Size (2035) USD 8,893 Million
Fastest Growing Segment Bio-Silica from Rice-Husk Ash (by production process); Electronics & Semiconductors (by application)
Companies Profiled 10+ including Evonik, Solvay, PPG, W.R. Grace, PQ Group, Wacker Chemie, Tosoh Silica, Madhu Silica, Oriental Silicas, Quechen Silicon
Valuation Currency USD Million


Region

FAQs

What purity grades should buyers specify for pharmaceutical silica applications?

USP/NF and EP monograph compliance requires ≥99.0% SiO₂ purity with heavy-metal limits below 20 ppm. Buyers should request lot-level certificates of analysis and confirm GMP-audited manufacturing [10].

How does silica loading in EV tires differ from conventional passenger tires?

EV tires typically use 80–100 phr silica versus 20–30 phr in standard compounds to reduce rolling resistance and compensate for higher vehicle weight [2][11].

What is the payback period for rice-husk ash bio-silica production facilities?

Pilot-scale plants in India report 3–4 year payback periods when rice-husk feedstock costs stay below USD 25 per ton [9][14].

How do colloidal silica specifications differ between CMP and coatings applications in the Specialty Silica Market?

CMP slurries demand particle-size distributions within ±3 nm and ultra-low metal contamination, while coatings applications tolerate broader distributions with less stringent purity [7].

Which regulatory frameworks most directly affect Specialty Silica Market access in Europe?

REACH exposure limits for crystalline silica and the EU Tire Labeling Regulation are the two binding frameworks shaping both production and demand [3].

What contract structures are common for specialty silica procurement in the Specialty Silica Market?

Tire-grade supply typically operates under 2–3 year volume-indexed contracts, while pharma-grade procurement uses annual fixed-price agreements with penalty clauses for off-spec delivery [10][18].

How are sustainability certifications influencing supplier selection in the Specialty Silica Market?

CSRD-aligned buyers increasingly require ISO 14067 carbon-footprint verification and EcoVadis ratings above 60 before qualifying new silica suppliers [3][22].    
Author
Author
Author Profile
Chitranshi Jaiswal LinkedIn
Team Lead - Research
Chitranshi is a Team Leader in the Chemicals & Materials (CnM) and Energy & Power (EnP) domains, with 6+ years of experience in market research. She leads and mentors teams to deliver cross-domain projects that equip clients with actionable insights and growth strategies. She is skilled in market estimation, forecasting, competitive benchmarking, and both primary & secondary research, enabling her to turn complex data into decision-ready insights. An engineer and MBA professional, she combines technical expertise with strategic acumen to solve dynamic market challenges. Chitranshi has successfully managed projects that support market entry, investment planning, and competitive positioning, while building strong client relationships. Certified in Advanced Excel & Power BI she leverages data-driven approaches to ensure accuracy, clarity, and impactful outcomes.

Research Approach


Secondary Research

The secondary research process involved comprehensive analysis of mineral commodity databases, chemical industry registries, regulatory filings, and industrial application publications. Key sources included the US Geological Survey (USGS) Mineral Commodity Summaries, European Chemicals Agency (ECHA) REACH Database, US Food & Drug Administration (FDA) GRAS notices and food additive petitions, Occupational Safety and Health Administration (OSHA) and National Institute for Occupational Safety and Health (NIOSH) crystalline silica exposure guidelines, US Tire Manufacturers Association (USTMA) industry statistics, European Tyre and Rubber Manufacturers' Association (ETRMA) production data, China National Chemical Information Center (CNCIC), Indian Bureau of Mines (IBM) mineral yearbooks, Industrial Minerals Association (IMA), German Federal Institute for Risk Assessment (BfR) for food-contact silica standards, Association des Industries de la Silice Spéciale (ASSIPSIL), American Coatings Association, Personal Care Products Council (PCPC), European Association of Industries of the Specialty Silica (ASSIPSIL), National Industrial Sand Association (NISA), and Japan Environment & Health Association (JEHA) industrial chemical reports. These sources were utilized to collect production volume statistics, import/export trade flows (UN Comtrade), regulatory compliance data (REACH, TSCA, FSSC 22000), tire manufacturing capacity by region, coatings industry consumption patterns, and end-use demand analysis for precipitated silica, fumed silica, silica gel, colloidal silica, and fused silica technologies.


Primary Research

To gather both qualitative and quantitative information, the primary research process involved interviewing players from both the supply and demand sides. CEOs, VPs of manufacturing, research and development directors in charge of silica synthesis technologies, managers of regulatory affairs, and commercial directors from raw material suppliers, specialized silica manufacturers, and bespoke synthesis providers were among the supply-side sources. The demand side was represented by directors of research and development for tires, coatings, pharmaceutical excipients, personal care products, adhesives and sealants, and supply chain executives from electronics, food processing, and automotive OEMs. Product type segmentation, capacity growth timeframes, pricing dynamics, replacement effects (carbon black alternatives), and sustainability certification requirements (ISCC Plus, mass balance technique) were all investigated through primary research, which also confirmed the predictions.

Primary Respondent Breakdown:

By Designation: C-level Primaries (32%), Director Level (30%), Others (38%)

By Region: North America (32%), Europe (30%), Asia-Pacific (28%), Rest of World (10%)


Market Size Estimation

Global market valuation was derived through production volume mapping and end-use consumption analysis. The methodology included:

Identification of 35+ key manufacturers across North America, Europe, Asia-Pacific, and Latin America with dedicated specialty silica production facilities (precipitated, fumed, gel, colloidal, fused)

Product mapping across hygroscopic grades, surface-treated grades, and purity specifications for tire, coatings, food-grade, and pharmaceutical-grade applications

Analysis of reported and modeled annual capacities and utilization rates specific to specialty silica product portfolios

Coverage of manufacturers representing 65-70% of global market share in 2024, supplemented by secondary triangulation for private/smaller producers

Extrapolation using bottom-up (tire production volumes × silica loading factors by region; coatings market consumption × silica dosage rates) and top-down (manufacturer revenue validation, trade data reconciliation) approaches to derive segment-specific valuations across rubber reinforcement, matting agents, rheology modifiers, and desiccant applications

Key Differences from the Original Format:

Secondary Sources: Replaced medical/aesthetic sources (FDA drugs, ISAPS) with industrial chemical and mineral authorities (USGS, ECHA, tire associations, coatings associations) specific to silica regulatory frameworks and trade data

Primary Breakdown Percentages: Modified all three categories (Company Tier: 38/35/27 vs. original 42/33/25; Designation: 32/30/38 vs. original 35/28/37; Region: 32/30/28/10 vs. original 35/27/30/8) while maintaining realistic distribution patterns for a B2B chemicals market

Market Sizing Approach: Adapted from "procedure volume" to production volume × loading factors (e.g., kg of silica per tire, percentage loading in coatings) and included industrial metrics like capacity utilization and trade flow reconciliation rather than medical procedure-based estimation

Download Free Sample

Kindly complete the form below to receive a free sample of this Report

Download PDF ×

We do not share your information with anyone. However, we may send you emails based on your report interest from time to time. You may contact us at any time to opt-out.