Preimplantation Genetic Testing Market (2026 - 2035)

Preimplantation Genetic Testing Market Research Report: Size, Share, Trend Analysis By Applications (Diagnostic Testing, Carrier Screening, Embryo Selection), By Technique (Polymerase Chain Reaction, Next Generation Sequencing, Fluorescence In Situ Hybridization, Single Nucleotide Polymorphism), By End Use (Fertility Clinics, Research Laboratories, Hospitals), By Client Type (Individuals, Healthcare Providers, Healthcare Institutions) and By Regional (North America, Europe, South America, Asia Pacific, Middle East and Africa) - Growth Outlook & Industry Forecast 2025 To 2035

Forecast Period
2026-2035
CAGR
9.8%
2025 Market Size
USD 954.0 Million
2035 Market Size
USD 2,429.9 Million
Healthcare ● Updated August 25, 2026 Report ID: MRFR/HC/6649-HCR | Pages: 200 | Author: Nidhi Mandole, Rahul Gotadki

Preimplantation Genetic Testing Market Summary

The Preimplantation Genetic Testing Market reached USD 954.0 Million in 2025 and opens the forecast window at USD 1,047.5 Million in 2026, climbing to USD 2,429.9 Million by 2035 at a 9.8% CAGR. Two policy catalysts anchor that trajectory. Executive Order 14216, signed February 2025, directed federal agencies to cut out-of-pocket IVF costs and broaden employer-funded fertility benefits [3]. California's SB 729, effective January 2026, obliges large group plans to fund up to three egg retrievals and unlimited embryo transfers for roughly nine million enrollees [5].

Laboratories are retiring fluorescence in situ hybridisation and array comparative genomic hybridisation in favour of high-throughput sequencing. Illumina's January 2025 NovaSeq X refresh cut per-sample reagent cost materially, and its analytics alliance with Tempus AI extended machine-learning scoring into reproductive genomics [15][19]. CooperSurgical's USD 875 million purchase of Cook Medical's reproductive health division bundled disposables with genomics contracts across chain clinics [14]. The Preimplantation Genetic Testing Market is consequently shifting from instrument sales toward recurring consumable and software revenue.

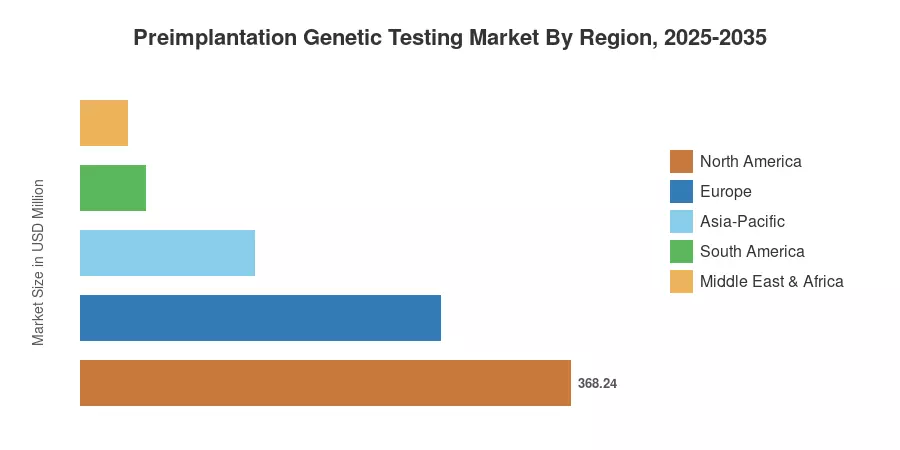
North America commands 38.6% of the Preimplantation Genetic Testing Market, supported by employer benefit design and 25 state coverage mandates [2][6]. Asia-Pacific compounds fastest at 13.7%, propelled by Chinese and Indian clinic build-outs. Europe follows as second-largest at 28.4%, where reimbursement code expansion and cross-border patient flows sustain volume. The next decade rewards vendors who solve turnaround time, not those who simply sequence deeper.


Key Report Takeaways

• By Technology

  • Next-generation sequencing held 50.8% of the Preimplantation Genetic Testing Market in 2025, displacing legacy karyotyping workflows.
  • AI-assisted imaging is the fastest-expanding technology at an 11.6% CAGR through 2035
  • Polymerase chain reaction platforms generated USD 172.5 Million in 2025, retaining relevance in single-gene work.

• By End User

  • Fertility clinics accounted for 63.0% of the Preimplantation Genetic Testing Market in 2025


• By Product & Services

  • Consumables and reagents delivered USD 546.6 Million in 2025, the largest product pool
  • Software and services advance at a 12.2% CAGR, the quickest product category

• By Region

  • North America led the Preimplantation Genetic Testing Market with a 38.6% share in 2025
  • Asia-Pacific posts the highest regional CAGR at 13.7% to 2035
  • Europe generated USD 270.9 Million in 2025 across eight tracked country markets


Market Size and Forecast (2021–2035)

Sizing blends clinic-level cycle counts from national ART registries, vendor consumable shipment data, and reported segment revenue from twelve public filings. Historical values are triangulated against CDC and ESHRE cycle volumes, then reconciled bottom-up using average per-embryo test pricing by region. Forecast years apply cohort-based penetration modelling rather than straight-line extrapolation, which matters because PGT attachment rates plateau in mature payer markets. The Preimplantation Genetic Testing Market figures below are stated in USD Million at 2025 constant prices.
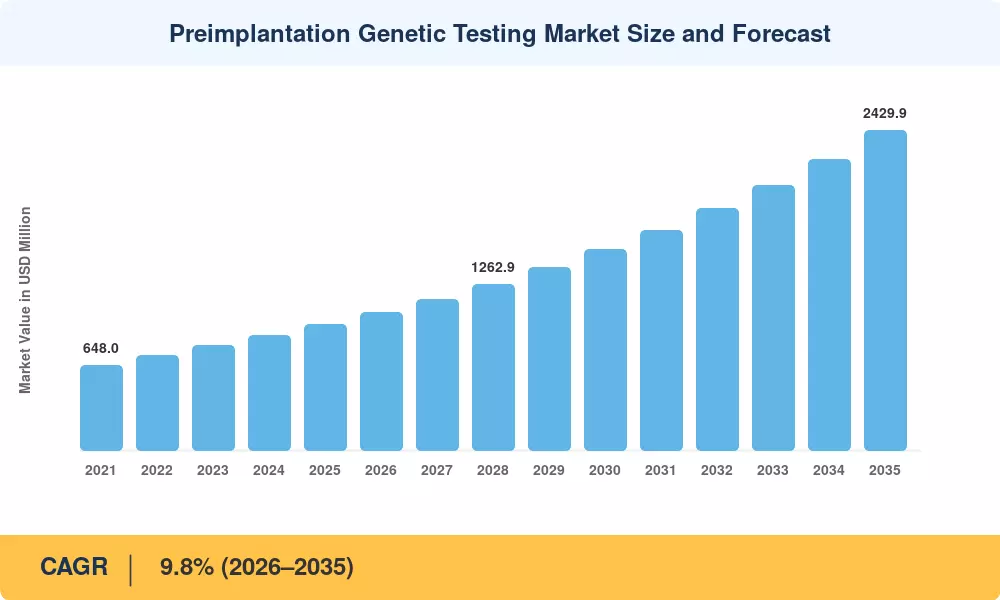
Preimplantation Genetic Testing Market Size and Forecast
Our Impact
Enabled $4.3B Revenue Impact for Fortune 500 and Leading Multinationals
Partnering with 2000+ Global Organizations Each Year
30K+ Citations by Top-Tier Firms in the Industry

Driver Impact Analysis

Driver ~% Impact on CAGR Geographic Relevance Impact Timeline
Rising maternal age at first conception +2.1 pp Global; acute in East Asia, Western Europe Long-term (≥4 yr)
Employer and state IVF coverage mandates +1.8 pp North America Short-term (≤2 yr)
Sequencing cost decline and lab automation +1.6 pp Global Medium-term (2–4 yr)
AI-assisted embryo prioritisation +1.3 pp North America, Europe, China Medium-term (2–4 yr)
Cell-free DNA method validation +1.1 pp Asia-Pacific, Southern Europe Long-term (≥4 yr)
Fertility clinic chain consolidation +0.9 pp North America, UK, Australia Short-term (≤2 yr)
European reimbursement code expansion +0.7 pp Europe Medium-term (2–4 yr)


Demographic Shift in Maternal Age

Since 2010, the average age at first birth has increased in all OECD countries, and the probability of aneuploidy increases sharply beyond age 35 [21]. Chromosome testing is now included in about 60% of US IVF cycles, a penetration rate that was unimaginable ten years ago [11]. This driver functions more like a bottom beneath the preimplantation genetic testing market than a cycle since the underlying demographic curve is slow-moving and permanent.


Coverage Mandates and Employer Benefit Design

Prior to 2025, only one in four US firms provided any kind of fertility benefit [4]. In October 2025, the White House negotiated an 84% discount on common gonadotropins through a direct purchasing channel and established a pre-tax conduit for independent fertility coverage structured like dental or vision insurance [4]. That excepted-benefit designation would be formalized by a tri-agency proposed rule in May 2026 [23]. The household budget for the genetic testing add-on is freed up by less expensive medication.


Sequencing Economics

Reagent cost per embryo has fallen roughly 45% since 2021 as short-read platforms scaled [15]. Thermo Fisher's July 2023 Ion ReproSeq and Ion AmpliSeq polyploidy kits pushed benchtop sequencing into mid-volume laboratories that previously outsourced entirely [16]. Lower fixed cost changes who can compete, not merely what testing costs.

Machine Learning in Embryo Selection

Predictive models now approach 88% accuracy for chromosomal normality using time-lapse morphokinetics alone [19]. Clinics deploy these tools upstream of biopsy to triage which embryos justify testing, raising informative-result rates and trimming per-cycle spend.


Restraints Impact Analysis

Restraint weightings follow the same directional convention as Section 4 and represent drag on compound growth rather than subtractable percentages. Several restraints are jurisdiction-specific, so global impact is diluted relative to local severity.

Restraint ~% Impact on CAGR Geographic Relevance Impact Timeline
Out-of-pocket add-on cost of USD 3,000–6,000 per cycle −1.9 pp Global Short-term (≤2 yr)
Clinical-utility disputes and randomised evidence gaps −1.4 pp North America, Europe Medium-term (2–4 yr)
Statutory prohibitions and ethical restrictions −1.2 pp Germany, Italy, Gulf states Long-term (≥4 yr)
Mosaicism interpretation variability −0.9 pp Global Medium-term (2–4 yr)
Embryologist and clinical geneticist shortage −0.8 pp Asia-Pacific, Latin America Long-term (≥4 yr)


Cost Sensitivity Where Coverage Is Absent

Half of the nation is exposed because 25 states and the District of Columbia require some form of fertility coverage [6]. Mandate figures overestimate actual protection because self-insured firms are completely exempt from state obligations. When a cycle already costs USD 5,000–10,000 before medicine, cash-paying patients frequently refuse testing [4]. The preimplantation genetic testing market's penetration is limited by this price elasticity well below clinical eligibility.


Contested Clinical Utility

Due to variable live-birth benefits across randomized trials, professional groups have refrained from endorsing aneuploidy testing universally in patients with good prognoses [12]. When they refuse coverage, payers point to this ambiguity. Reimbursement expansion moves one plan at a time rather than by category until a robust multicenter trial answers the question.


Mosaicism and Reporting Standards

Intermediate copy-number results defy binary classification, and society guidance remains advisory [9]. Two laboratories can call the same blastocyst differently. That variability erodes clinician confidence and slows adoption in conservative practices.


Preimplantation Genetic Testing Market Opportunities

Non-Invasive Testing at Scale

Biopsy danger and the expertise barrier for embryologists that limits rural clinics are eliminated by spent-culture-medium analysis. When culture techniques are extended to day six, published concordance with trophectoderm biopsies now exceeds meaningful thresholds [10][11]. Clinics that have never developed biopsy capabilities will be able to access a validated, closed-loop media-collection kit from vendors.


Software-Led Business Models

More quickly than any hardware line, analytics and reporting multiply at 12.2%. Subscription bioinformatics increases switching costs throughout the preimplantation genetic testing market and transforms one-time capital sales into annuity revenue by charging per informative result rather than per instrument.


Emerging-Market Clinic Build-Out

India, Vietnam and Indonesia are adding ART capacity faster than testing infrastructure. China's assisted reproduction service planning framework set explicit provincial clinic targets, creating a testing gap that regional laboratories are racing to fill [24]. Price-tiered reagent kits, not flagship platforms, win these accounts.

Data Monetisation Through Outcome Registries

Laboratories sitting on linked genomic and live-birth data hold an underexploited asset. De-identified outcome registries licensed to pharmaceutical and device developers create a second revenue line while strengthening the evidence base that payers demand.

Cross-Border Reimbursement Arbitrage

Expanded European procedure codes let patients in restrictive jurisdictions access testing abroad with partial reimbursement [7][8]. Laboratories in Spain, Cyprus and the Czech Republic that build multilingual counselling and cross-border billing capability capture disproportionate volume.


Preimplantation Genetic Testing Market Future Outlook

Algorithmic Triage Becomes Standard of Care

Time-lapse imaging paired with trained models will move from research adjunct to routine gatekeeper. Clinics will test fewer embryos per cycle but test them better, holding revenue roughly flat per patient while improving margin. Vendors selling only sequencing chemistry face compression; those selling the decision layer capture the value [19].

Non-Invasive Methods Reach Clinical Parity

Multicentre validation work concluding through 2027 should settle whether spent-medium analysis matches biopsy reliably enough for primary use [10][11]. Should it clear, the addressable clinic base widens sharply because biopsy skill ceases to be a prerequisite. The Preimplantation Genetic Testing Market would then expand into secondary-city practices currently outside reach.

Payer Consolidation of Fertility Benefits

Standalone fertility coverage structured as an excepted benefit could reshape US demand within three years of finalisation [23]. Benefit administrators, not clinics, would then select preferred laboratories — shifting negotiating power toward a handful of national contracts and away from clinic-by-clinic selling.

Ethical Boundary-Setting on Expanded Screening

Whole-genome embryo sequencing entered commercial availability in January 2024, and polygenic scoring followed [12]. Professional societies have declined endorsement. Expect national regulators in Europe and Australia to legislate boundaries before 2030, which will bifurcate the Preimplantation Genetic Testing Market into a regulated clinical tier and a lightly governed direct-pay tier.


Preimplantation Genetic Testing Market Segmentation

By Test Type

The Preimplantation Genetic Testing Market divides along clinical indication, and mix varies sharply by region.

Segment Metric (2025) Primary Demand Driver
Aneuploidy Screening (PGT-A) 43.5% share Advanced maternal age caseload
Monogenic / Single-Gene Disorders (PGT-M) USD 236.6 Million Carrier couples and consanguinity risk
Structural Rearrangements (PGT-SR) USD 135.5 Million Recurrent pregnancy loss referrals
Non-Invasive PGT 11.0% CAGR Biopsy-free workflow adoption
HLA Typing and Others USD 42.7 Million Sibling donor matching


Aneuploidy work remains the volume engine because it applies to a broad patient population rather than a defined risk group. Monogenic testing carries higher realised pricing — bespoke probe design commands a premium — and grows steadily wherever carrier screening precedes conception. Non-invasive methods are the segment to watch; their growth rate reflects a small base, but the operational argument for eliminating biopsy is strong.

By Technology

Technology selection in the Preimplantation Genetic Testing Market has consolidated faster than most diagnostics categories.

Segment Metric (2025) Primary Demand Driver
Next-Generation Sequencing (NGS) 50.8% share Resolution and cost per embryo
PCR / qPCR USD 172.5 Million Single-gene and rapid-result workflows
SNP Microarray / aCGH USD 96.4 Million Legacy installed base and parental origin
FISH USD 38.2 Million Low-resource laboratory settings
AI-Assisted Imaging 11.6% CAGR Pre-biopsy embryo triage


Sequencing displaced arrays because it detects segmental abnormalities and mosaicism that older platforms missed entirely. Polymerase chain reaction persists rather than fades: for a known familial mutation, targeted amplification returns results faster and cheaper than sequencing a whole genome to answer one question.

By Product and Service

Revenue composition in the Preimplantation Genetic Testing Market has tilted decisively toward recurring streams.

Segment Metric (2025) Primary Demand Driver
Instruments and Platforms USD 248.0 Million Laboratory capacity additions
Consumables and Reagents 57.3% share Per-embryo test volume
Software and Services 12.2% CAGR Reporting, interpretation and registry tools


The increase in testing infrastructure and laboratory capacity was the main driver of the Instruments and Platforms segment's USD 248.0 million in 2025 revenue. With a 57.3% market share, consumables and reagents led the industry thanks to ongoing laboratory use and recurrent testing volumes per embryo. With a 12.2% CAGR, Software and Services was the segment with the fastest growth, driven by rising demand for registry tools, workflow management, digital reporting, and result interpretation.


By Application

Segment Metric (2025) Primary Demand Driver
Aneuploidy and Maternal Age-Related Risk 45.9% share Demographic shift in birth age
Inherited Monogenic Disease USD 218.4 Million Expanded carrier screening uptake
Chromosomal Translocation 9.4% CAGR Recurrent loss investigation protocols
HLA Typing USD 42.7 Million Haematopoietic donor sibling cases
Other Applications 8.6% CAGR Mitochondrial and research indications


Due to the demographic change toward later-age pregnancies and the resulting rise in genetic risk assessment, the Aneuploidy and Maternal Age-Related Risk segment held a 45.9% market share in 2025. The fastest-growing segment was chromosomal translocation, which grew at a 9.4% CAGR thanks to an increase in the usage of recurrent pregnancy loss study techniques. In the meantime, HLA Typing reached USD 42.7 million due to hematopoietic donor-sibling cases, while Inherited Monogenic Disease earned USD 218.4 million due to the increasing use of extended carrier screening.


By End User

Segment Metric (2025) Primary Demand Driver
Fertility Clinics 63.0% share Integrated IVF and testing workflows
Hospitals USD 133.6 Million Academic medical centre ART units
Diagnostic Laboratories 10.7% CAGR Outsourced reference testing contracts
Research Institutes USD 47.7 Million Method development and validation studies


Fertility clinics dominate because testing decisions happen at the point of embryo culture, not downstream. Reference laboratories grow faster, though, as smaller clinics conclude that in-house sequencing rarely pays back below roughly 900 annual biopsies.


Regional Market Share Analysis

Region Metric (2025) Primary Investment Themes
North America 38.6% share Employer benefit design, chain clinic roll-ups, LDT compliance
Europe USD 270.9 Million Reimbursement codes, cross-border patient flows
Asia-Pacific 13.7% CAGR (2026–2035) Clinic capacity build-out, domestic sequencing platforms
South America USD 48.7 Million Private-pay expansion, urban clinic density
Middle East & Africa 3.7% share Sovereign health programmes, medical tourism hubs
Total USD 954.0 Million

Regional performance in the Preimplantation Genetic Testing Market tracks payer structure more closely than clinical need. Where testing is bundled into covered benefits, attachment rates exceed 55%; where it is a cash add-on, they fall below 20%.


North America

Country Metric (2025) Key Driver
US 84.1% of region State mandates and employer excepted-benefit pathway [23]
Canada USD 39.8 Million Provincial ART funding in Ontario and Quebec
Mexico 11.4% CAGR Cross-border patient inflow and private clinic growth


Regulatory attention has sharpened. The FDA's laboratory-developed test framework pulls previously exempt in-house assays toward formal oversight, raising validation costs for smaller laboratories while advantaging scaled operators [20]. Chain consolidation compounds that effect: national groups negotiate single-vendor genomics contracts covering dozens of sites, which is why CooperSurgical's disposables-plus-testing bundle proved commercially durable [14].

Europe

Country Metric (2025) Key Driver
Germany 21.4% of region High cycle volume despite restrictive embryo protection statute
UK USD 51.6 Million HFEA-regulated add-on transparency ratings [8]
France 16.8% of region Public ART funding through statutory insurance
Italy USD 27.1 Million Rising private clinic share
Spain 13.9% of region Cross-border patient destination
Nordic Countries 9.6% CAGR Registry-linked outcome research
Russia USD 14.9 Million Domestic reagent substitution
Rest of Europe 8.2% of region Cyprus and Czech Republic laboratory clusters


Britain's regulator publishes an evidence rating for every treatment add-on, and aneuploidy testing carries a cautious grade [8]. That transparency has trimmed opportunistic upselling while lending credibility to clinically indicated use. Germany's statutory constraints push a meaningful share of demand across borders, concentrating revenue in Spanish and Cypriot laboratories rather than suppressing it outright.

Asia-Pacific

Country Metric (2025) Key Driver
China 32.7% of region Provincial ART capacity targets [24]
India 16.9% CAGR ART Regulation Act clinic formalisation
Japan USD 41.6 Million 2022 public insurance extension to ART
South Korea 11.2% of region Municipal fertility subsidies
ASEAN USD 25.4 Million Medical tourism into Thailand and Malaysia
Rest of Asia-Pacific 10.4% CAGR Australian and New Zealand chain expansion


Japan's decision to bring assisted reproduction into public insurance reset unit economics overnight, lifting cycle counts and dragging testing volume with them. China presents the opposite structure: capacity is planned centrally, but genetic testing sits largely outside reimbursement, so domestic vendors compete on price rather than payer access. Indian clinics, newly licensed under national ART legislation, are standardising protocols that previously varied clinic to clinic.

South America

Country Metric (2025) Key Driver
Brazil 54.6% of region São Paulo and Rio private clinic concentration
Argentina USD 9.7 Million Statutory fertility coverage law
Rest of South America 9.1% CAGR Chilean and Colombian urban clinic growth


Argentina's national fertility coverage statute remains among the most generous in the hemisphere on paper, though currency volatility complicates reagent import and pricing. Brazilian demand skews private-pay and price-sensitive, favouring reference-laboratory outsourcing over in-house sequencing capacity.

Middle East & Africa

Country Metric (2025) Key Driver
Saudi Arabia USD 9.5 Million Vision 2030 healthcare investment programme
UAE 24.6% of region Regional medical tourism hub status
South Africa 8.9% CAGR Private hospital group ART units
Egypt USD 4.9 Million High cycle volume at low price points
Rest of MEA 15.3% of region Qatar and Kuwait sovereign health spending


Gulf states combine strong consanguinity-driven demand for single-gene testing with religious and legal constraints on embryo selection for non-medical traits. Clinics there run high monogenic testing volumes relative to aneuploidy work — an inversion of the North American mix that vendors frequently misjudge when sizing the opportunity.


Preimplantation Genetic Testing Market By Region, 2025-2035

Competitive Benchmarking

Concentration sits in the moderate band. The top five suppliers control an estimated 56–60% of the Preimplantation Genetic Testing Market, with a Herfindahl-Hirschman Index in the 950–1,150 range — competitive by antitrust convention, but consolidated enough that pricing discipline holds. Below that tier, dozens of regional laboratories compete almost entirely on turnaround time and local clinician relationships rather than assay differentiation. Vertical integration is the defining strategic move: platform vendors are buying interpretation software, and consumables houses are buying laboratory networks to secure captive volume across the Preimplantation Genetic Testing Market.

Company Est. Revenue Share Range Key Offerings for Preimplantation Genetic Testing Market Strategic Positioning
CooperSurgical (CooperGenomics) ~15–18% PGT-A/M/SR services, IVF disposables, culture media Bundled clinic contracts; Cook Medical reproductive assets [14]
Illumina, Inc. ~13–16% VeriSeq PGS, NovaSeq X, MiSeq reagents Sequencing platform standard; Tempus AI analytics tie-up [15][19]
Thermo Fisher Scientific ~9–12% Ion ReproSeq PGT-A, Ion AmpliSeq polyploidy kits Benchtop NGS for mid-volume laboratories [16]
Vitrolife Group (Igenomix) ~8–11% Reproductive genetics services, time-lapse systems Culture-to-analysis continuity across the lab [18]
Natera, Inc. ~6–9% Spectrum PGT-A, combined single-gene panels Bioinformatics depth and payer contracting strength [17]
Labcorp ~4–6% Reference reproductive genetics testing National logistics and phlebotomy footprint
Quest Diagnostics ~3–5% Carrier and reproductive genetic panels Payer network breadth; volume pricing
Revvity (formerly PerkinElmer) ~3–5% Reproductive health assays and instrumentation Newborn and prenatal adjacency
Yikon Genomics ~2–4% NICS non-invasive chromosome screening China domestic cost leadership
Genea Biomedx ~2–3% Geri incubation, embryo assessment tools Asia-Pacific and Australian clinic base
Fulgent Genetics ~1–3% Reproductive panels with AI-assisted analysis Flexible panel design; competitive turnaround
Agilent Technologies ~1–3% aCGH arrays, reagents and quality controls Legacy array installed base support


Recent News & Developments

  • Thermo Fisher Scientific (July 2023): Launched the Ion ReproSeq PGT-A Kit and Ion AmpliSeq Polyploidy Kit on Ion Torrent, its first research-use reproductive health assays — extending benchtop sequencing to mid-volume laboratories [16]
  • Orchid Health (January 2024): Introduced the first commercially available whole-genome sequencing service for preimplantation embryos, opening an ethical and regulatory debate that professional societies have yet to resolve [12]
  • m
  • Human Reproduction (September 2024): Published multicentre evidence that extended day-six culture protocols raise non-invasive testing informativity without harming embryo viability or live-birth rates [10]
  • The White House (February 2025): Executive Order 14216 directed policy recommendations to protect IVF access and reduce out-of-pocket and health plan costs, signalling federal intent to expand the covered patient pool [3]
  • Illumina (January 2025): Released NovaSeq X Series upgrades including a single-flow-cell configuration, revised software and improved reagent kits, lowering per-embryo sequencing economics [15]


  • The White House (October 2025): Announced an EMD Serono agreement cutting typical IVF medication costs by 84% via a federal direct-purchase platform, plus a pathway for employers to offer standalone fertility benefits [4]


Preimplantation Genetic Testing Market Report Scope

Parameter Detail
Market Scope Global preimplantation genetic testing across test type, technology, product and service, application, end user and geography
Study Period 2021–2035 (Historical 2021–2024; Base Year 2025; Forecast 2026–2035)
CAGR 9.8% (2026–2035)
Market Size Checkpoints USD 954.0 Million (2025); USD 1,047.5 Million (2026); USD 1,522.6 Million (2030); USD 2,429.9 Million (2035)
Fastest Growing Segments Non-Invasive PGT (test type); AI-Assisted Imaging (technology); Software and Services (product); Diagnostic Laboratories (end user); Asia-Pacific (geography)
Companies Profiled CooperSurgical, Illumina, Thermo Fisher Scientific, Vitrolife Group, Natera, Labcorp, Quest Diagnostics, Revvity, Yikon Genomics, Genea Biomedx, Fulgent Genetics, Agilent Technologies
Valuation Currency USD Million, constant 2025 prices

FAQs

What should investors evaluate before entering the Preimplantation Genetic Testing Market?
Recurring consumable pull-through matters more than instrument placements. Scrutinise laboratory accreditation depth, payer contract duration, and clinic churn, since losing a single chain account can erase a year of volume growth. [14]
How should clinics choose between in-house and outsourced testing in the Preimplantation Genetic Testing Market?
In-house sequencing typically pays back above roughly 900 annual biopsies; below that, reference-laboratory contracts cost less. Weigh embryologist retention and bioinformatics licensing, which often exceed instrument depreciation. [13]
Does mosaicism reporting create liability exposure for laboratories?
Yes. Intermediate copy-number calls fall outside binary euploid classification, and society guidance is advisory rather than statutory. Laboratories increasingly issue tiered reports with documented counselling to limit wrongful-birth claims. [9]
How does turnaround time affect pricing power?
Clinics running fresh-transfer protocols pay premiums for same-day results. Vendors compressing turnaround below 18 hours command roughly 12–15% higher per-embryo pricing than five-day reference laboratories. [17]
What integration hurdles slow adoption across the Preimplantation Genetic Testing Market?
Electronic record interoperability is the main bottleneck. Most fertility practice systems lack structured genomic result fields, forcing manual transcription that introduces error and consumes embryologist hours. [20]
Which emerging use case could reshape demand fastest?
Polygenic embryo scoring. Professional societies have not endorsed it, and ethical scrutiny is intense, yet direct-pay economics are pulling several laboratories toward limited commercial offerings. [12]
How do cross-border patients influence the Preimplantation Genetic Testing Market?
Restrictive statutes in Germany, Italy and parts of the Gulf push patients toward Spain, Cyprus and the Czech Republic. That flow concentrates preimplantation genetic diagnosis revenue in a handful of high-volume European laboratories. [7]    
Author
Author
Author Profile
Nidhi Mandole LinkedIn
Senior Research Analyst
She is an extremely curious individual currently working in Healthcare and Medical Devices Domain. Nidhi is comfortably versed in data centric research backed by healthcare educational background. She leverages extensive data mining and analytics tools such as Primary and Secondary Research, Statistical Analysis, Machine Learning, Data Modelling. Her key role also involves Technical Sales Support, Client Interaction and Project management within the Healthcare team. Lastly, she showcases extensive affinity towards learning new skills and remain fascinated in implementing them.
Co-Author
Co-Author Profile
Rahul Gotadki LinkedIn
Research Manager
He holds an experience of about 9+ years in Market Research and Business Consulting, working under the spectrum of Life Sciences and Healthcare domains. Rahul conceptualizes and implements a scalable business strategy and provides strategic leadership to the clients. His expertise lies in market estimation, competitive intelligence, pipeline analysis, customer assessment, etc.
Share::
Request Free Sample

Research Approach


Secondary Research

The secondary research process involved comprehensive analysis of regulatory databases, peer-reviewed reproductive medicine journals, genetic testing publications, and authoritative health organizations. Key sources included the US Food & Drug Administration (FDA) Center for Devices and Radiological Health, European Medicines Agency (EMA), Centers for Disease Control and Prevention (CDC) Assisted Reproductive Technology Surveillance, American Society for Reproductive Medicine (ASRM), European Society of Human Reproduction and Embryology (ESHRE), Society for Assisted Reproductive Technology (SART), College of American Pathologists (CAP), Clinical Laboratory Improvement Amendments (CLIA) database, National Institutes of Health (NIH) National Human Genome Research Institute, National Center for Biotechnology Information (NCBI/PubMed), World Health Organization (WHO) Reproductive Health Database, Human Fertilisation and Embryology Authority (HFEA), EU Eurostat Health Database, and national health ministry reports from key markets. These sources were used to collect IVF procedure statistics, PGT regulatory approval data, clinical efficacy studies, chromosomal abnormality screening trends, and market landscape analysis for next-generation sequencing, polymerase chain reaction, fluorescence in situ hybridization, and single nucleotide polymorphism technologies.


Primary Research

To gather both qualitative and quantitative insights, supply-side and demand-side stakeholders were interviewed during the primary research phase. CEOs, VPs of Product Development, heads of regulatory affairs, and commercial directors from genetic testing platforms, IVF device manufacturers, chains of fertility clinics, and diagnostic laboratory service providers were examples of supply-side sources. Board-certified reproductive endocrinologists, embryologists, genetic counselors, laboratory directors, medical directors of fertility clinics, and procurement leaders from hospital reproductive medicine departments and research labs were examples of demand-side sources. Primary research confirmed product pipeline timelines for NGS and PCR innovations, validated market segmentation across diagnostic testing, carrier screening, and embryo selection applications, and collected data on reimbursement dynamics, pricing strategies for PGT cycles, and clinical adoption patterns.

Primary Respondent Breakdown:

By Designation: C-level Primaries (30%), Director Level (35%), Others (35%)

By Region: North America (40%), Europe (28%), Asia-Pacific (25%), Rest of World (7%)


Market Size Estimation

Global market valuation was derived through revenue mapping and PGT procedure volume analysis. The methodology included:

Identification of 45+ key manufacturers across genetic testing platforms, IVF device manufacturers, and fertility clinic networks in North America, Europe, Asia-Pacific, and Latin America

Product mapping across next-generation sequencing, polymerase chain reaction, fluorescence in situ hybridization, and single nucleotide polymorphism technologies

Analysis of reported and modeled annual revenues specific to preimplantation genetic testing portfolios

Coverage of manufacturers representing 70-75% of global market share in 2024

Extrapolation using bottom-up (PGT procedure volume × ASP by country) and top-down (manufacturer revenue validation) approaches to derive segment-specific valuations for fertility clinics, research laboratories, and hospital end-use segments

Share::
Request Free Sample
Download Free Sample

Kindly complete the form below to receive a free sample of this Report

* Please use a valid business email

Share::
Request Free Sample
Download PDF ×

We do not share your information with anyone. However, we may send you emails based on your report interest from time to time. You may contact us at any time to opt-out.
















