In-Vitro Fertilization (IVF) Market (2026 - 2035)

In Vitro Fertilization Market Research Report: Size, Share, Trend Analysis By Technique (Intra-Cytoplasmic Sperm Injection, Traditional IVF, Preimplantation Genetic Testing, Cryopreservation, Embryo Culture), By Product Type (Instruments, Media, Consumables), By End Users (Fertility Clinics, Hospitals, Research Laboratories), By Patient Type (Male Infertility, Female Infertility, Unexplained Infertility) and By Regional (North America, Europe, South America, Asia Pacific, Middle East and Africa) - Growth Outlook & Industry Forecast 2026 To 2035

Forecast Period
2026-2035
CAGR
7.70%
2009 Market Size
26.65 USD Million
2021 Market Size
28.7 USD Million
Healthcare ● Updated August 24, 2026 Report ID: MRFR/HC/1682-CR | Pages: 200 | Author: Satyendra Maurya, Rahul Gotadki

In-Vitro Fertilization (IVF) Market Summary

The In Vitro Fertilization Market closed 2025 at roughly USD 26.65 billion and enters the forecast window at USD 28.70 billion in 2026, expanding to USD 55.94 billion by 2035 at a 7.70% CAGR. Two catalysts anchor that trajectory. Japan's decision to fold assisted reproduction into national health insurance removed a five-figure yen barrier for hundreds of thousands of couples, and in the United States, roughly 47% of large employers now fund fertility benefits, up from 30% five years earlier [1][4]. Demand is no longer discretionary spending at the margin; it is a reimbursed line item.

Laboratories are simultaneously replacing manual, judgment-heavy workflows. Bench-top incubators with static grading are giving way to time-lapse imaging, closed-culture systems, electronic witnessing, and algorithmic ranking of in vitro embryo development. Vitrification has displaced slow-freeze protocols almost entirely, and preimplantation genetic testing now touches a third of cycles in mature markets. Private equity committed more than USD 4.1 billion to fertility clinic platforms between 2023 and 2025, most of it earmarked for lab automation and multi-site standardization [7][12].

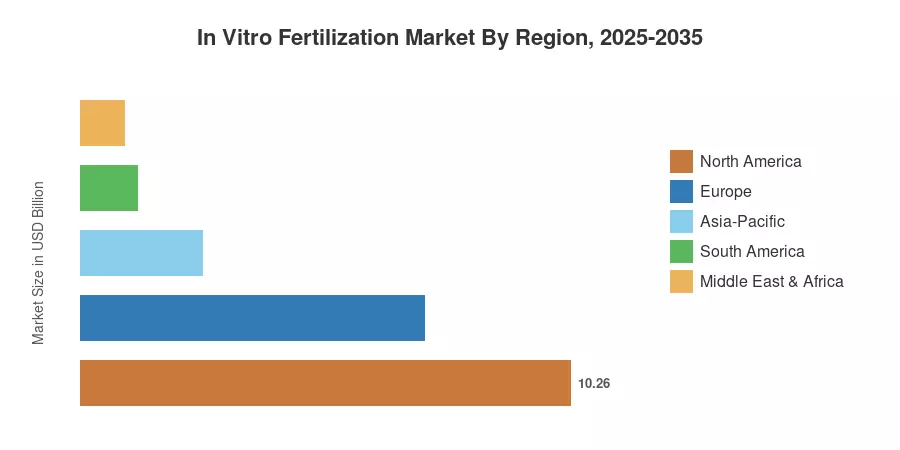
Geographically, North America holds 38.5% of 2025 revenue, while Asia-Pacific compounds at 9.6% through 2035 on the back of Chinese provincial reimbursement and India's post-ART-Act clinic formalization. Europe follows as the second-largest bloc, sustained by Nordic and French public funding schemes. The In Vitro Fertilization Market of 2035 will look less like a network of boutique clinics and more like a standardized, data-instrumented specialty care industry.


Key Report Takeaways

• By Product

  • Reagents & Media commanded 41.8% of 2025 revenue, the largest single product pool in the In Vitro Fertilization Market
  • Consumables & Disposables are advancing at an 8.3% CAGR as single-use closed systems replace reusable glassware

• By Cycle Type

  • IVF with ICSI accounts for 45.6% of procedure revenue, reflecting male-factor diagnosis rates
  • Frozen IVF Cycles – Non-Donor grow fastest at 9.4% CAGR as freeze-all protocols become default practice


• By End User

  • Fertility Clinics represent 68.4% of end-user demand across the In Vitro Fertilization Market

• By Region

  • North America holds 38.5% share, led by employer-funded benefit expansion
  • Asia-Pacific posts a 9.6% CAGR, the fastest of any region
  • Europe contributed USD 7.20 billion in 2025 under mixed public-private funding models


Market Size and Forecast (2021–2035)

Estimates blend national ART registry cycle volumes — CDC, HFEA, ESHRE EIM, ANZARD and Japan's JSOG dataset — with per-cycle consumable and media pricing collected from clinic procurement panels across 14 countries. Vendor revenue disclosures from listed suppliers were triangulated against registry cycle counts to reconcile top-down and bottom-up estimates.
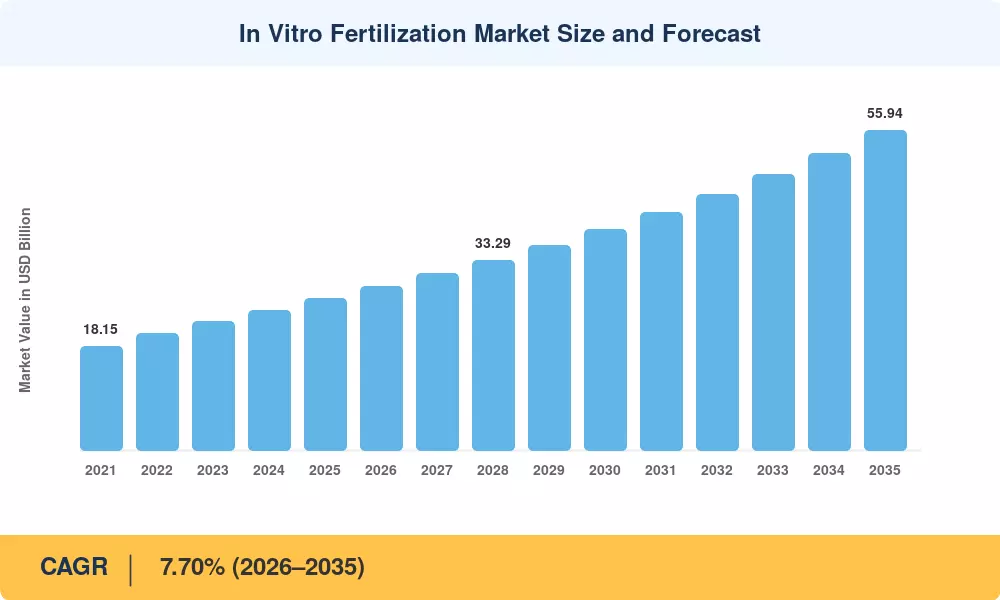
In Vitro Fertilization Market Size and Forecast
Our Impact
Enabled $4.3B Revenue Impact for Fortune 500 and Leading Multinationals
Partnering with 2000+ Global Organizations Each Year
30K+ Citations by Top-Tier Firms in the Industry

Driver Impact Analysis

Driver ~% Impact on CAGR Geographic Relevance Impact Timeline
Rising maternal age at first birth 1.6 Global Long-term (≥4 yr)
Employer and insurer benefit expansion 1.4 North America, Europe Medium-term (2–4 yr)
National ART reimbursement programs 1.2 Asia-Pacific, Europe Medium-term (2–4 yr)
Preimplantation genetic testing adoption 1.0 Global Medium-term (2–4 yr)
Vitrification and freeze-all protocols 0.9 Global Short-term (≤2 yr)
AI-assisted grading and lab automation 0.7 North America, Europe Long-term (≥4 yr)
Cross-border care and clinic consolidation 0.6 Asia-Pacific, MEA Short-term (≤2 yr)


Reimbursement Redraws the Demand Curve

After assisted reproduction was added to Japan's national health insurance in April 2022, the average patient expenditure decreased from approximately JPY 500,000 per cycle to about 30% coinsurance, and within two years, the number of registered cycles exceeded 540,000 [1]. China followed suit, adding ART items to basic medical insurance coverage in over 25 provinces by mid-2025, using Beijing's 16-item list as a model [3]. In the in vitro fertilization market, reimbursement serves as the most dependable volume switch; coverage choices affect cycle counts every four quarters.

Genetic Testing Lifts Revenue per Cycle

By 2024, PGT-A attachment rates in US cycles surpassed 44%, generating around USD 3,500–5,000 in supplementary revenue per retrieval [8]. Testing increases realized value per patient without a corresponding rise in cycle count by pulling through biopsy consumables, cryostorage, and sequencing reagents.

Employer Benefits Widen the Payer Base

Mercer's 2025 survey put fertility coverage at 47% of employers with 500+ staff, with median annual benefit caps near USD 25,000 [4]. Corporate payers negotiate multi-cycle bundles, stabilizing clinic utilization.


Restraints Impact Analysis

Restraint ~% Impact on CAGR Geographic Relevance Impact Timeline
Out-of-pocket cost per cycle -1.3 Global Short-term (≤2 yr)
Embryologist and lab capacity shortage -0.9 Global Medium-term (2–4 yr)
Regulatory fragmentation on donor gametes and PGT -0.7 Europe, MEA Long-term (≥4 yr)
Cultural, religious and statutory restrictions -0.6 MEA, parts of Asia Long-term (≥4 yr)
Cycle attrition and variable success rates -0.5 Global Medium-term (2–4 yr)


Affordability Remains the Binding Constraint

Before medicine, a single US cycle typically costs between $15,000 and $20,000, and cumulative live birth sometimes necessitates two or three retrievals [10]. Deductibles and benefit caps force a significant portion of patients to stop treatment after just one attempt, even in insured markets. Therefore, more than any technological gap, price sensitivity limits volume growth in the in vitro fertilization market.

Talent, Not Equipment, Limits Throughput

Fewer than 4,000 senior clinical embryologists exist throughout Europe, according to ESHRE certification statistics, despite the growing need for cycles [11]. Incubators may be installed in a matter of weeks, but training a skilled embryologist takes three to five years. Openings for staffing, not capital, are frequently delayed by chains entering secondary cities.

Rules Differ Across Borders

Germany's Embryonenschutzgesetz restricts embryo selection practices routine in Spain, and several Gulf jurisdictions prohibit donor gametes outright [13][15]. Fragmentation forces suppliers to maintain divergent product configurations and slows multi-country protocol standardization.


In-Vitro Fertilization (IVF) Market Opportunities

Low-Cost Cycle Models for Emerging Economies

Simplified culture systems and mild-stimulation protocols can deliver cycles at USD 2,000–3,500 in South Asia and Sub-Saharan Africa, where conventional pricing excludes almost the entire addressable population [6][16]. Suppliers who redesign for cost rather than discount premium kits will capture the volume tier.

Outcome Data as a Commercial Asset

Chains operating 40+ labs now hold longitudinal datasets linking media lot, incubator conditions, and live-birth outcomes. Licensing de-identified outcome data to reagent developers and payers creates a recurring revenue layer inside the In Vitro Fertilization Market that carries software-like margins [12].

Fertility Preservation Beyond Infertility

Oncofertility referrals and elective oocyte banking are growing faster than treatment cycles, and storage generates annuity revenue for a decade or more per patient [14]. Cryostorage infrastructure, not retrieval capacity, becomes the constraint.

Managed-Service Laboratory Contracts

Hospitals lacking embryology depth increasingly outsource lab operations to specialist operators under per-cycle contracts, converting capex into opex and giving suppliers a consolidated procurement counterparty [7].

Gulf and North African Clinic Buildout

Saudi Arabia's Vision 2030 health privatization has licensed dozens of new fertility centres, and Egypt's medical-tourism corridor draws patients from across the region at 40–60% of European pricing [15].


In-Vitro Fertilization (IVF) Market Future Outlook

Algorithmic Embryo Selection Becomes Standard of Care

Deep-learning models trained on time-lapse image sequences already match or exceed senior embryologist grading concordance in multi-centre validations, and regulatory clearance pathways are opening in the EU under IVDR classification [12][20]. By 2030, expect algorithmic ranking to be a default lab feature rather than a premium add-on across the In Vitro Fertilization Market, shifting supplier differentiation from hardware toward validated software.

Platform Economics Reshape Clinic Ownership

Independent single-site clinics still account for roughly half of global cycles, but consolidation is accelerating: the ten largest chains grew from about 9% of world volume in 2020 to an estimated 17% by 2025 [7]. Scale buyers negotiate media and disposables centrally, compressing supplier margins while raising order predictability.

Cryostorage Turns Into Infrastructure

Frozen embryo and oocyte inventories are compounding faster than annual retrievals, and storage duration now routinely exceeds seven years. Facilities are moving from clinic basements to purpose-built, alarmed, third-party vaults with insurance-grade chain-of-custody documentation [14].

Access Policy Is the Decisive Variable

Public funding decisions will determine whether the In Vitro Fertilization Market lands near the upper or lower bound of the 2035 forecast. WHO's 2023 finding that roughly one in six adults experiences infertility has begun to reframe treatment as a public health obligation rather than elective care, and that framing tends to precede reimbursement [16].


In-Vitro Fertilization (IVF) Market Segmentation

Segmentation in the In Vitro Fertilization Market follows Product, Cycle Type, Procedure Type, and End User dimensions.

By Product

Segment Metric Primary Demand Driver
Reagents & Media 41.8% share (2025) Per-cycle consumption; lot-to-lot validation cycles
Instruments USD 9.67 Billion (2025) Incubator and micromanipulator replacement
Consumables & Disposables 8.3% CAGR Shift to single-use closed culture systems


Reagents and media dominate because they are consumed every cycle and cannot be substituted mid-protocol without revalidation — a switching cost that gives incumbents unusual pricing durability. Instruments follow a lumpier replacement rhythm tied to clinic buildouts; the current wave centres on multi-chamber time-lapse incubators replacing bench-top units installed a decade ago.

By Cycle Type

Segment Metric Primary Demand Driver
Fresh IVF Cycles – Non-Donor 36.2% share (2025) Standard first-line protocol
Frozen IVF Cycles – Non-Donor 9.4% CAGR Freeze-all strategy and OHSS avoidance
Fresh IVF Cycles – Donor USD 4.61 Billion (2025) Advanced maternal age and donor programs
Frozen IVF Cycles – Donor 8.6% CAGR Cross-border donor banking


Frozen cycles are the structural story here. Vitrification survival rates above 95% eliminated the historical penalty for freezing, and separating retrieval from transfer improves endometrial receptivity while enabling genetic testing between the two steps [5].

By Procedure Type

Segment Metric Primary Demand Driver
IVF with ICSI 45.6% share (2025) Male-factor infertility diagnosis rates
Conventional IVF USD 7.44 Billion (2025) Cost-sensitive first-line treatment
IVF with PGT/PGD 10.2% CAGR Aneuploidy screening in older patients
Other Procedure Types 5.9% CAGR Assisted hatching, IVM, adjunct techniques


ICSI's share exceeds the clinical prevalence of male-factor infertility, a gap driven by clinic preference for fertilization certainty. PGT is the fastest-growing procedure line and the most contested, with several registries questioning live-birth benefit in younger cohorts [8].

By End User

Segment Metric Primary Demand Driver
Fertility Clinics 68.4% share (2025) Dedicated embryology labs and specialist staffing
Hospitals USD 5.12 Billion (2025) Integrated obstetrics and oncofertility referral
Surgical Centres 7.1% CAGR Retrieval-only outsourcing arrangements
Clinical Research Institutes 8.9% CAGR Protocol trials and embryology training


Specialist clinics dominate because embryology is a volume-dependent discipline; outcomes correlate strongly with annual cycle throughput per lab. Hospital-based units retain relevance where oncofertility and complex comorbidity cases require multidisciplinary support.


Regional Market Share Analysis

Region Metric (2025) Primary Investment Themes
North America 38.5% share Employer benefits, chain consolidation, PGT attach rates
Europe USD 7.20 Billion Public funding schemes, cross-border care, donor regulation
Asia-Pacific 9.6% CAGR (2026–2035) Provincial reimbursement, clinic formalization, low-cost protocols
South America 4.5% share Private-pay urban clinics, regional medical tourism
Middle East & Africa USD 0.93 Billion Sovereign health programs, tourism corridors
Total USD 26.65 Billion

Regional performance in the In Vitro Fertilization Market tracks reimbursement policy far more closely than income per capita, which explains why Japan outperforms wealthier peers and why Nordic states sustain high per-capita cycle rates.


North America

Country Metric Key Driver
US 84.0% of region Employer fertility benefits and state mandates
Canada USD 0.98 Billion Ontario and Quebec provincial funding
Mexico 8.9% CAGR Cross-border patient inflow from US Sun Belt


Twenty-two US states now impose some form of infertility insurance mandate, and the 2024 addition of IVF coverage for federal employees under FEHB extended benefits to roughly 8 million lives [4][17]. Canadian growth is narrower but stable, anchored by Ontario's publicly funded cycle program. Mexican clinics in Guadalajara and Cancún have built a genuine export business, pricing full cycles near USD 6,000 and capturing patients whose US benefit caps run out. The In Vitro Fertilization Market in this region is mature in volume but still expanding in revenue per cycle.

Europe

Country Metric Key Driver
Germany 19.8% of region Federal co-funding of treatment cycles
UK USD 1.32 Billion HFEA-regulated private-pay expansion
France 8.1% CAGR 2021 bioethics law extending access
Italy 11.4% of region Public centre capacity additions
Spain USD 0.92 Billion Donor-cycle inbound treatment demand
Nordic Countries 7.6% CAGR High public reimbursement per capita
Russia 6.9% of region Federal quota-funded cycles
Rest of Europe 7.2% CAGR Central European cost-advantaged clinics


France's revised bioethics law opened treatment to single women and female couples, adding an estimated 25,000 annual cycles by 2024 [13]. Spain remains the continent's donor hub, handling a disproportionate share of cross-border cycles because its donor framework is permissive and anonymous. British volumes grow through the private channel: NHS-funded cycles have fallen below 25% of the total, shifting demand toward self-pay clinics in London and Manchester [18].

Asia-Pacific

Country Metric Key Driver
China 31.5% of region Provincial insurance listing of ART items
India 11.8% CAGR ART Regulation Act clinic formalization
Japan USD 1.53 Billion National health insurance coverage
South Korea 12.4% of the region Government subsidy per treatment round
ASEAN 10.3% CAGR Thailand and Malaysia treatment tourism
Rest of Asia-Pacific USD 0.42 Billion Australia and NZ Medicare rebates


India's ART (Regulation) Act, operational since 2022, forced thousands of informal centres to register or close, and the surviving network is consolidating into branded chains with standardized procurement [6]. Chinese demand responds directly to policy: provinces that listed ART items saw cycle volumes rise 20–35% within a year [3]. Growth here is the fastest anywhere in the In Vitro Fertilization Market, and it is volume-led rather than price-led.

South America

Country Metric Key Driver
Brazil 54.0% of region Private clinic networks in São Paulo and Rio
Argentina USD 0.23 Billion Mandatory coverage under Law 26.862
Rest of South America 8.4% CAGR Colombian and Chilean urban clinic growth


Argentina's fertility law obliges both public and private insurers to cover treatment, an unusually broad mandate that keeps per-capita cycle rates above regional norms [19]. Brazilian volumes concentrate in a handful of metropolitan networks, several now backed by regional private equity. Currency volatility remains the practical constraint, since media and disposables are dollar-priced imports.

Middle East & Africa

Country Metric Key Driver
Saudi Arabia 26.5% of region Vision 2030 private health licensing
UAE USD 0.21 Billion Dubai and Abu Dhabi medical tourism
South Africa 9.1% CAGR Private hospital group fertility units
Egypt 15.4% of the region Cost-advantaged regional treatment hub
Rest of MEA 8.2% CAGR Nigerian and Kenyan urban clinic entry


Gulf demand is structurally high: consanguinity rates and early marriage patterns raise diagnosed infertility prevalence above global averages, and treatment carries limited social stigma within permitted religious frameworks [15]. Egypt undercuts Gulf pricing by roughly half and now serves patients from Libya, Sudan, and the Levant. Sub-Saharan expansion is slower, gated by cost rather than demand.


In Vitro Fertilization Market By Region, 2025-2035

Competitive Benchmarking

Concentration in the In Vitro Fertilization Market sits in the medium band. Estimated HHI is approximately 810, with the top five suppliers holding a combined 41–46% of consumables and equipment revenue. The structure is barbell-shaped: two or three broad-line vendors span media, instruments, and disposables, while a long tail of specialists competes on single categories such as micropipettes, vitrification kits, or witnessing software.

Company Est. Revenue Share Range Key Offerings for In Vitro Fertilization Market Strategic Positioning
Vitrolife Group (Xvivo) ~11–14% Culture media, EmbryoScope time-lapse, PGT services Broad-line leader with integrated software layer
CooperSurgical ~10–13% Media, disposables, witnessing, genomic testing Acquisition-led portfolio breadth
Merck KGaA ~8–11% Gonadotropins, stimulation protocols, fertility software Pharma-anchored, protocol influence upstream
FUJIFILM Irvine Scientific ~6–8% Culture media, cryopreservation solutions Manufacturing scale and lot consistency
Thermo Fisher Scientific ~5–7% Sequencing for PGT, lab consumables, cold chain Genomics-adjacent entry point
Genea Biomedx ~4–6% Geri incubators, Gems media, Gavi automation Automation-first equipment specialist
Kitazato Corporation ~3–5% Vitrification kits, cryodevices, micropipettes Category leadership in vitrification
Esco Medical ~3–4% Multi-chamber incubators, ART workstations Cost-competitive equipment for emerging labs
Hamilton Thorne ~2–4% Laser systems, imaging, sperm analysis Precision instrumentation niche
Cook Medical ~2–4% Retrieval needles, catheters, transfer devices Procedural device incumbency
Ferring Pharmaceuticals ~2–3% Fertility hormones and adjunct therapies Clinical partnership channel
INVO Bioscience <1% Intravaginal culture device Disruptive low-cost care model


Recent News & Developments

  • Vitrolife (March 2024): Launched an expanded iDAScore deployment across European clinics, extending algorithmic embryo ranking to routine practice and reinforcing software as a differentiator [12].
  • CooperCompanies (September 2023): Completed integration of Cook Medical's reproductive health assets, broadening its retrieval and transfer device line and lifting fertility segment scale [7].
  • Chinese National Healthcare Security Administration (June 2024): Confirmed that more than 25 provinces had incorporated assisted reproduction items into basic medical insurance, standardizing reimbursement codes nationally [3].
  • US Office of Personnel Management (January 2024): Required FEHB carriers to offer IVF benefits, extending coverage to roughly 8 million federal enrollees and dependents [17].
  • Merck KGaA (November 2024): Announced a digital fertility platform partnership pairing stimulation protocol analytics with clinic outcome dashboards [20].
  • Genea Biomedx (May 2025): Released an upgraded Gavi automated vitrification platform aimed at reducing operator variability in high-volume laboratories [12].
  • Indian Ministry of Health (August 2023): Published National ART and Surrogacy Registry compliance rules, mandating outcome reporting from all licensed clinics [6].
  • Saudi Ministry of Health (February 2025): Licensed additional private reproductive medicine centres under Vision 2030 health privatization targets [15].


In-Vitro Fertilization (IVF) Market Report Scope

Parameter Detail
Market Scope Global In Vitro Fertilization Market covering reagents & media, instruments, consumables & disposables across fresh and frozen, donor and non-donor cycles
Study Period 2021–2035 (Historical 2021–2024; Base Year 2025; Forecast 2026–2035)
CAGR 7.70% (2026–2035)
Market Size Checkpoints USD 26.65 Bn (2025); USD 28.70 Bn (2026); USD 38.61 Bn (2030); USD 55.94 Bn (2035)
Fastest Growing Segments IVF with PGT/PGD (procedure); Frozen IVF Cycles – Non-Donor (cycle type); Asia-Pacific (region)
Companies Profiled 12 suppliers spanning media, instruments, devices, genomics and pharmaceuticals
Valuation Currency USD, nominal terms, revenue basis at supplier level

FAQs

What should investors diligence first when entering the In Vitro Fertilization Market?
Cycle volume per laboratory, not clinic count. Labs below roughly 300 annual cycles rarely sustain competitive live-birth rates or justify automation capex, which makes throughput the cleanest predictor of asset quality [7].
How do procurement teams evaluate culture media suppliers in the In Vitro Fertilization Market?
Lot-to-lot consistency data and mouse embryo assay results outweigh unit price. Switching media triggers full protocol revalidation, so buyers weight documented supply continuity and recall history heavily [12].
Does AI-based embryo grading actually improve outcomes?
Current evidence shows strong concordance with expert embryologists and better inter-operator consistency, but randomized live-birth superiority remains unproven. Its clearest value today is reducing variability in high-volume labs [20].
What regulatory nuance most affects cross-border donor cycles?
Donor anonymity rules diverge sharply — Spain permits anonymity while the UK mandates identity release at 18. Patients and clinics must reconcile the law of both the treatment country and the child's future residence [13][18].
How does accreditation variation shape supplier strategy in the In Vitro Fertilization Market?
CAP, ISO 15189, and national ART licences impose different documentation burdens. Suppliers that ship pre-validated protocol packages shorten clinic accreditation timelines and win specification lock-in early [11].
What integration problems arise when clinics adopt electronic witnessing?
Retrofitting RFID or barcode witnessing into legacy labs frequently breaks existing LIMS workflows and slows staff during the first quarter. Budget for parallel manual witnessing throughout the transition [12].
Which emerging use cases extend beyond infertility treatment?
Oncofertility preservation and elective oocyte banking now drive a growing share of retrievals. Both generate multi-year cryostorage annuities rather than one-time procedure revenue [14].      
Author
Author
Author Profile
Satyendra Maurya LinkedIn
Research Analyst
An accomplished research analyst with high proficiency in market forecasting, data visualization, competitive benchmarking, and others. He holds a pronounced track record in research and consulting projects for sectors such as life sciences, medical devices, and healthcare IT. His capabilities in qualitative and quantitative analysis have resulted in positive client outcomes. Working on niche market trends, opportunities, sales, and forecasted value is part of his skill set.
Co-Author
Co-Author Profile
Rahul Gotadki LinkedIn
Research Manager
He holds an experience of about 9+ years in Market Research and Business Consulting, working under the spectrum of Life Sciences and Healthcare domains. Rahul conceptualizes and implements a scalable business strategy and provides strategic leadership to the clients. His expertise lies in market estimation, competitive intelligence, pipeline analysis, customer assessment, etc.
Share::
Request Free Sample

Research Approach


Secondary Research

The secondary research process involved comprehensive analysis of regulatory databases, international ART registries, peer-reviewed reproductive medicine journals, and authoritative health organizations. Key sources included the US Centers for Disease Control and Prevention (CDC) National ART Surveillance System (NASS), US Food & Drug Administration (FDA) Center for Devices and Radiological Health, European Society of Human Reproduction and Embryology (ESHRE), American Society for Reproductive Medicine (ASRM), Society for Assisted Reproductive Technology (SART), International Committee Monitoring Assisted Reproductive Technologies (ICMART), Human Fertilisation and Embryology Authority (HFEA-UK), Health Canada Medical Devices Directorate, World Health Organization (WHO) Department of Sexual and Reproductive Health, National Institutes of Health (NIH) Eunice Kennedy Shriver National Institute of Child Health and Human Development (NICHD), PubMed/MEDLINE reproductive health databases, and national ART registries including the Australian and New Zealand Assisted Reproduction Database (ANZARD), Canadian Assisted Reproductive Technologies Register (CARTR), and Latin American Registry of Assisted Reproduction (RLA). These sources were used to collect procedure cycle statistics, clinical pregnancy success rates, regulatory approval data for embryology laboratory devices, cryopreservation technology safety studies, demographic infertility trends, and market landscape analysis for IVF equipment (imaging systems, incubators, micromanipulators, sperm separation devices), culture media (embryo culture, cryopreservation, sperm processing), and accessory technologies.


Primary Research

Qualitative and quantitative insights were obtained by interviewing supply-side and demand-side stakeholders during the primary research process. From IVF device manufacturers, culture media producers, and assisted reproductive technology laboratory apparatus suppliers, supply-side sources included CEOs, VPs of Research & Development, regulatory affairs heads, and commercial directors. The demand-side sources included procurement leads from hospital-based fertility centers, standalone IVF clinics, and cryobanking facilities, as well as laboratory directors/embryologists, board-certified reproductive endocrinologists (REIs), and medical directors of fertility clinics. Primary research has confirmed the product pipeline timelines for time-lapse incubators and AI-based embryo selection technologies, validated market segmentation across cycle types (fresh non-donor, frozen non-donor, fresh donor, frozen donor), and gathered insights on clinical adoption patterns, laboratory workflow integration, pricing strategies for capital equipment versus consumables, and insurance reimbursement dynamics for fertility treatments.

Primary Respondent Breakdown:

By Designation: C-level Primaries (32%), Director Level (30%), Others (38%)

By Region: North America (32%), Europe (30%), Asia-Pacific (33%), Rest of World (5%)


Market Size Estimation

Global market valuation was derived through revenue mapping and assisted reproductive technology procedure volume analysis. The methodology included:

Identification of 40+ key manufacturers across North America, Europe, Asia-Pacific, and Latin America specializing in capital equipment (incubators, micromanipulators, imaging systems), consumables (culture media, disposable labware), and cryopreservation systems

Product mapping across imaging systems, sperm separation devices, ovum aspiration pumps, embryo culture media, cryopreservation media, and micromanipulation systems

Analysis of reported and modeled annual revenues specific to IVF product portfolios, utilizing data from fertility clinic public filings and device company segment reporting

Coverage of manufacturers representing 75-80% of global market share in 2024

Extrapolation using bottom-up (national ART cycle volumes × average selling price per cycle by procedure type and region) and top-down (manufacturer revenue validation against registry-based cycle counts) approaches to derive segment-specific valuations for equipment, media/reagents, and accessories

Share::
Request Free Sample
Download Free Sample

Kindly complete the form below to receive a free sample of this Report

* Please use a valid business email

Share::
Request Free Sample
Download PDF ×

We do not share your information with anyone. However, we may send you emails based on your report interest from time to time. You may contact us at any time to opt-out.
















