In-Vitro Toxicology Testing Market (2026 - 2035)

In Vitro Toxicology Testing Market Research Report: Size, Share, Trend Analysis By Product & Service (Consumables, Assays (Bacterial Toxicity Assays, Enzyme Toxicity Assays, Cell-Based Elisa and Western Blots, Receptor-Binding Assays, Tissue Culture Assays, Other Assays), Services, Equipment and Software), By Toxicity Endpoint & Test (ADME, Genotoxicity, Skin Irritation Corrosion & Sensitization, Cytotoxicity, Ocular Toxicity, Organ Toxicity, Dermal Toxicity, Phototoxicity and Other End Point & Tests), By Industry (Pharmaceutical & Biopharmaceutical, Consumer Care, Food and Others), By Technology (Cell Culture, High-throughput and Toxicogenomic), By Method (Cellular Assays, Biochemical Assays, Molecular Toxicology Assays, Ex-vivo Models and In Silico Models) And By Region (North America, Europe, Asia-Pacific, And Rest Of The World) - Growth Outlook & Industry Forecast 2025 To 2035

Forecast Period
2026-2035
CAGR
11.2%
2025 Market Size
USD 12.07 Billion
2035 Market Size
USD 34.90 Billion
Healthcare ● Updated August 24, 2026 Report ID: MRFR/HC/20365-HCR | Pages: 128 | Author: Nidhi Mandole, Rahul Gotadki

In-Vitro Toxicology Testing Market Summary

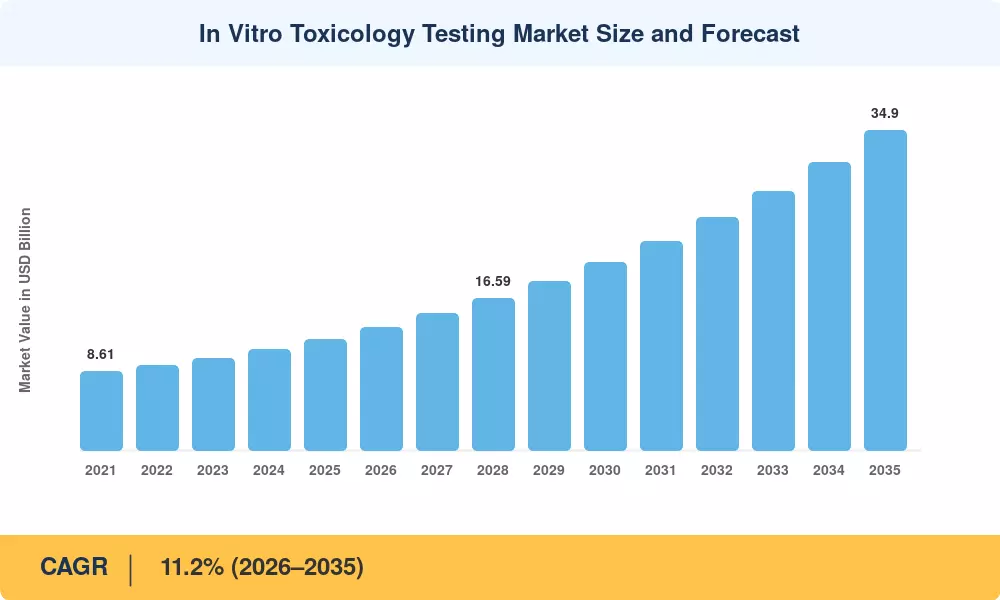
The In Vitro Toxicology Testing Market reached USD 12.07 billion in 2025 and opens the forecast window at USD 13.42 billion in 2026, climbing to USD 34.90 billion by 2035 at an 11.2% CAGR. Two catalysts anchor that trajectory. The FDA Modernization Act 2.0 removed the statutory requirement for animal testing in investigational new drug applications, and the European Commission's roadmap toward phasing out animal models has given laboratory directors a compliance reason — not merely an ethical one — to reallocate budget toward non-animal toxicology assays [1][3].

Laboratories are retiring a legacy stack built on two-dimensional monolayer cultures and rodent bridging studies. Replacing it are 3D spheroid systems, microphysiological organ-on-chip devices, and machine-learning models trained on high-content imaging output. The NIH's National Center for Advancing Translational Sciences has committed more than USD 130 million across its tissue-chip programs, and that public money has pulled private capital behind it [5][9]. Predictive accuracy improves; late-stage attrition costs fall.

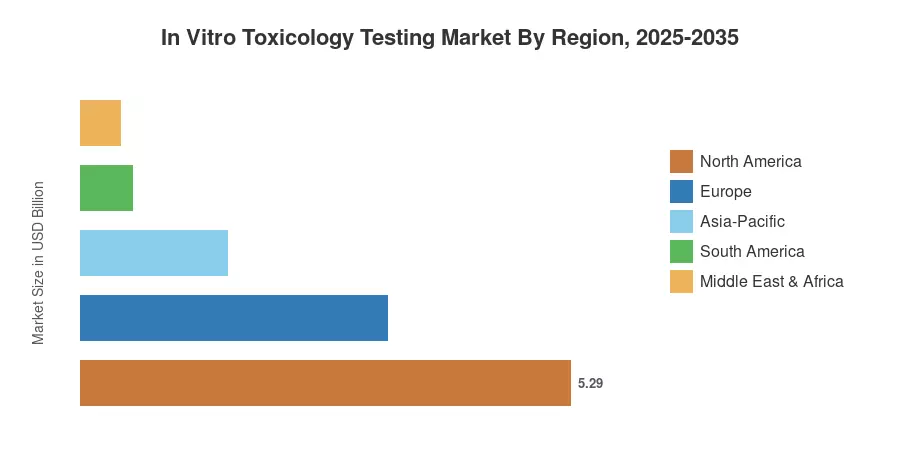
North America commands 43.8% of global revenue on the strength of its pharmaceutical R&D base and a permissive regulatory posture toward new approach methodologies. Asia-Pacific grows fastest at a 13.2% CAGR through 2035, driven by contract research capacity in China, India, and South Korea. Europe holds second position at 27.4%, where REACH and the Cosmetics Regulation continue to force substitution. The In Vitro Toxicology Testing Market is shifting from a compliance cost center toward a decision-making asset.


Key Report Takeaways

• By Technology

  • Cell culture platforms held 40.3% of In Vitro Toxicology Testing Market revenue in 2025, sustained by widespread hepatocyte and cardiomyocyte assay adoption
  • OMICS technologies are advancing at a 14.6% CAGR through 2035 as transcriptomic signatures gain regulatory traction
  • High throughput screening generated USD 3.20 billion in 2025 across pharmaceutical and agrochemical users

• By Sector

  • The pharmaceutical industry accounted for 44.4% of end-user demand in 2025
  • Diagnostics is the fastest-expanding end-user vertical at a 13.9% CAGR
  • Systemic toxicology applications posted USD 4.57 billion in 2025 revenue

• By Geography

  • North America contributed 43.8% of the In Vitro Toxicology Testing Market in 2025
  • Asia-Pacific is projected to grow at a 13.2% CAGR between 2026 and 2035
  • Europe delivered USD 3.31 billion in 2025, the second-largest regional pool


Market Size and Forecast (2021–2035)

Estimates below blend bottom-up revenue modeling of assay kit shipments, instrument installed base, and service contract values with top-down validation against pharmaceutical R&D expenditure disclosures and regulatory submission volumes. Historical years reflect audited company filings and trade association data; forecast years apply demand elasticity derived from regulatory milestone timing. The In Vitro Toxicology Testing Market accelerated visibly after 2023 as legislative changes converted pilot programs into procurement.
In Vitro Toxicology Testing Market Size and Forecast
Our Impact
Enabled $4.3B Revenue Impact for Fortune 500 and Leading Multinationals
Partnering with 2000+ Global Organizations Each Year
30K+ Citations by Top-Tier Firms in the Industry

Driver Impact Analysis

Driver ~% Impact on CAGR Geographic Relevance Impact Timeline
Statutory phase-out of animal testing mandates +2.4 Global Long-term (≥4 yr)
FDA New Alternative Methods Program funding +1.9 North America Medium-term (2–4 yr)
3D culture and organ-on-chip maturation +1.7 Global Medium-term (2–4 yr)
Pharmaceutical late-stage attrition cost pressure +1.5 North America, Europe Short-term (≤2 yr)
AI-enabled predictive toxicology models +1.3 Global Long-term (≥4 yr)
Contract research outsourcing growth +1.1 Asia-Pacific Short-term (≤2 yr)
REACH and Cosmetics Regulation enforcement +0.9 Europe Medium-term (2–4 yr)


Regulatory Substitution Is Now Statutory, Not Aspirational

Congress amended the Federal Food, Drug, and Cosmetic Act in December 2022 via the FDA Modernization Act 2.0, effectively ending the blanket statutory requirement for animal testing in drug approval and explicitly recognizing alternative methodologies such as cell-based assays, organ-on-a-chip systems, and computer models. Building on this legislative shift, the U.S. Food and Drug Administration (FDA) released its formal Roadmap to Reducing Animal Testing in Preclinical Safety Studies.

This federal strategy targets the reduction and replacement of traditional animal studies—initially focusing on monoclonal antibody (mAb) development—to rely more heavily on human-relevant New Approach Methodologies (NAMs). Sponsors treating in vitro toxicology and non-animal testing alternatives as optional now face a formalized regulatory expectation to scientifically justify any reliance on legacy animal models.

Attrition Economics Favor Earlier Screening

Roughly 90% of drug candidates entering clinical trials fail, and toxicity accounts for approximately 30% of those terminations [12]. Moving a hepatotoxicity or cardiotoxicity signal from Phase I to preclinical screening saves an estimated USD 15–25 million per compound in avoided trial spend. Sponsors have responded by shifting 8–12% of preclinical safety budgets toward higher-content platforms since 2023 [13].

Public Investment Is De-Risking Platform Adoption

Public health agencies and international research frameworks have scaled up funding to validate and standardize New Approach Methodologies (NAMs). In the United States, the National Center for Advancing Translational Sciences (NCATS) and the National Institute of Environmental Health Sciences (NIEHS) have spearheaded initiatives such as the Tissue Chip for Drug Screening program and specialized testing centers to build bioengineered human tissue models. Similarly, the European Union's Horizon Europe framework continues to channel multi-million-euro work programs directly into non-animal testing methods and regulatory safety validation. This public backing significantly lowers the burden of proof private laboratories must carry when introducing advanced in vitro toxicology assays to global regulators.


Restraints Impact Analysis

Restraint weightings mirror the driver methodology: each figure indicates directional drag on compound growth rather than a subtractable coefficient. Several restraints are transitional and should decay as validation infrastructure matures across the In Vitro Toxicology Testing Market.

Restraint ~% Impact on CAGR Geographic Relevance Impact Timeline
Regulatory validation lag for novel assays −1.6 Global Long-term (≥4 yr)
High capital cost of advanced platforms −1.2 Emerging markets Medium-term (2–4 yr)
Weak predictivity for chronic systemic endpoints −1.0 Global Long-term (≥4 yr)
Shortage of trained toxicologists and bioinformaticians −0.8 Global Short-term (≤2 yr)
Data standardization and reproducibility gaps −0.7 Global Medium-term (2–4 yr)


Validation Timelines Outrun Innovation Cycles

An OECD Test Guideline typically requires seven to eleven years from initial proposal to adoption, spanning ring trials across multiple laboratories [6]. Platform developers iterate hardware every 18 to 24 months. That mismatch strands capital: a chip validated in 2032 may reflect 2024 engineering. Buyers hedge by delaying purchase until guideline status is visible, which suppresses near-term revenue recognition for vendors.

Capital Intensity Limits Geographic Diffusion

A functional microphysiological screening suite — instrumentation, imaging, environmental control, and informatics — runs USD 400,000 to USD 1.2 million before staffing [18]. Laboratories in South America and Africa frequently operate annual equipment budgets below that threshold, which pushes them toward outsourcing rather than ownership and concentrates revenue in a handful of hub facilities.

Chronic Toxicity Remains an Unsolved Endpoint

Current systems reliably model acute cytotoxicity and organ-specific injury over 14 to 28 days. Carcinogenicity and reproductive toxicity, which require long exposure windows, still depend heavily on animal or epidemiological evidence; peer-reviewed concordance for chronic endpoints sits near 62% against historical rodent data [11]. Until that gap narrows, full substitution stays out of reach.


In-Vitro Toxicology Testing Market Opportunities

Multi-Organ Chip Systems for Integrated Safety Profiling

Linked multi-organ chips—such as integrated liver, kidney, and heart models—capture complex, metabolite-driven toxicity that single-organ testing models frequently miss. Driven by institutional validation commitments from bodies like the National Institutes of Health (NIH) and the National Center for Advancing Translational Sciences (NCATS), microphysiological systems are scaling rapidly within a global in-vitro toxicology testing market valued at over USD 10 billion. Concurrently, specialized organ-on-a-chip industry segments are expanding toward a multi-hundred-million-dollar valuation trajectory, exhibiting robust double-digit compound annual growth rates as platforms successfully demonstrate predictive validity and secure broader regulatory acceptance.

Emerging-Market Laboratory Build-Out

India's Central Drugs Standard Control Organisation and Brazil's ANVISA have both signaled acceptance pathways for validated non-animal data [17][18]. Combined with cost arbitrage of 40–55% against Western service pricing, this positions South Asian and Latin American contract laboratories to capture overflow demand rather than merely serve domestic sponsors.

Data Monetization Through Reference Toxicity Libraries

Every assay run generates structured dose-response data. Providers that aggregate and license anonymized reference libraries can build subscription revenue independent of plate throughput; comparable genomics reference businesses sustain 70–80% gross margins [9]. The In Vitro Toxicology Testing Market has barely begun to price this asset.

Cosmetics and Consumer Goods Reformulation Cycles

The EU Cosmetics Regulation bars animal-tested ingredients outright, and comparable rules now operate in South Korea, India, and ten US states [4][17]. Each reformulation cycle triggers fresh dermal and ocular screening demand, creating predictable recurring volume distinct from episodic pharmaceutical programs.

Agrochemical and Industrial Chemical Retesting

The EPA's commitment to reduce mammalian study requests has redirected pesticide registrants toward alternative toxicology methods, with more than 1,200 active ingredients scheduled for periodic review through 2035 [7].


In-Vitro Toxicology Testing Market Future Outlook

Regulatory Convergence Around New Approach Methodologies

By 2030, expect harmonized OECD guidance covering at least four additional endpoint categories, reducing the duplicate-testing burden sponsors currently carry across jurisdictions [6]. Convergence compresses per-study cost while expanding study count, a combination that historically expands total addressable value. The In Vitro Toxicology Testing Market should see service pricing fall 10–15% even as volume roughly triples.

Microphysiological Systems Move From Pilot to Standard

Multi-organ platforms will progress from research curiosity to routine tier-two screening. Adoption should pass 20% of eligible pharmaceutical programs by 2032, supported by the FDA's ISTAND pathway and cumulative federal validation spend exceeding USD 130 million [2][5].

Computational Toxicology Absorbs Screening Volume

In-silico prediction will displace a meaningful share of confirmatory wet-lab work. EPA's ToxCast library already supports read-across for thousands of data-poor chemicals, and agencies expect computational triage to reduce physical assay demand per registration by 25–35% while raising total chemicals screened [7][9]. Net effect: more coverage, different revenue mix.

Consolidation of Data Assets Becomes the Competitive Moat

Instruments commoditize; curated toxicity datasets do not. Providers holding decade-long longitudinal libraries will price analytics separately from testing, and the In Vitro Toxicology Testing Market will begin to resemble the clinical diagnostics sector in its revenue structure — hardware near cost, recurring interpretation at premium.


In-Vitro Toxicology Testing Market Segmentation

Segment structure across the In Vitro Toxicology Testing Market follows Mordor-consistent taxonomy spanning technology, method, application, and end user. Dominance concentrates in mature categories while growth clusters in computational and omics-adjacent segments.

By Technology

Technology composition within the In Vitro Toxicology Testing Market remains anchored by culture-based approaches, though analytical layers are gaining share fastest.

Segment Metric (2025) Primary Demand Driver
Cell Culture 40.3% share Established hepatocyte and cardiomyocyte protocols
High Throughput USD 3.20 Billion Library screening volume in early discovery
OMICS Technologies 14.6% CAGR Transcriptomic point-of-departure acceptance
Molecular Imaging 14.3% share High-content phenotypic profiling adoption


Cell culture retains leadership because it underpins nearly every other method — chips, spheroids, and imaging all depend on viable primary or iPSC-derived cells. Supply constraints in primary human hepatocytes have pushed vendors toward stem-cell-derived alternatives, which now represent close to a quarter of cardiomyocyte assay volume [13]. OMICS grows faster because regulators have begun accepting transcriptomic benchmark dose values as points of departure, a shift that converts an exploratory technique into a submission-grade one [6].

By Method

Method selection inside the In Vitro Toxicology Testing Market increasingly reflects budget tiering: cheap computational triage first, expensive cellular confirmation second.

Segment Metric (2025) Primary Demand Driver
Cellular Assay 33.2% share Regulatory familiarity and endpoint breadth
Biochemical Assay USD 3.45 Billion Enzyme inhibition and receptor binding panels
In-Silico 15.0% CAGR QSAR and read-across model maturity
Ex-Vivo 16.8% share Tissue-level relevance for dermal and ocular work


Cellular assays dominate on the strength of accumulated validation history; most OECD-adopted alternatives fall in this category. In-silico methods grow at nearly triple the cellular rate because marginal cost per additional compound approaches zero once a model is trained — economics that no wet-lab format can match [9].

By Application

Application demand across the In Vitro Toxicology Testing Market splits between broad systemic profiling and targeted endpoint testing tied to specific regulations.

Segment Metric (2025) Primary Demand Driver
Systemic Toxicology USD 4.57 Billion Hepatotoxicity and cardiotoxicity screening breadth
Dermal Toxicity 17.2% share Cosmetics and consumer-goods regulation
Endocrine Disruption 13.2% CAGR EPA and ECHA screening program expansion
Genotoxicity / Carcinogenicity 13.1% share Ames and micronucleus assay requirements
Ocular Toxicity USD 1.42 Billion Draize replacement protocols
Other Applications 6.4% share Neurotoxicity and immunotoxicity emergence


Systemic toxicology holds the largest pool because liver and heart injury account for the majority of safety-driven attrition. Endocrine disruption grows fastest as EPA's screening program and ECHA's identification criteria both expand the number of substances requiring dedicated assays [7].

By End User

Segment Metric (2025) Primary Demand Driver
Pharmaceutical Industry 44.4% share Preclinical safety packages and IND submissions
Cosmetics & Household Products USD 2.16 Billion Animal-testing bans across major markets
Chemicals Industry 12.6% share REACH and TSCA registration obligations
Food Industry USD 1.18 Billion Additive and contaminant safety assessment
Diagnostics 13.9% CAGR Companion-assay development and biomarker validation
Academic & Research Institutes 6.6% share Grant-funded methodology development


The end-user market is led by the Pharmaceutical Industry, which dominates with a 44.4% share driven by preclinical safety packages and IND submissions. Other sectors include Cosmetics and Household Products at USD 2.16 Billion, the Chemicals Industry at 12.6% share, the Food Industry at USD 1.18 Billion, and Academic & Research Institutes at 6.6% share. Diagnostics emerges as the fastest-growing segment, registering a 13.9% CAGR due to companion-assay development and biomarker validation.

Regional Market Share Analysis

Region Metric (2025) Primary Investment Themes
North America 43.8% share Organ-on-chip qualification, biologics safety, AI read-across
Europe 27.4% share REACH compliance, cosmetics substitution, chemical retesting
Asia-Pacific 13.2% CAGR (2026–2035) CRO capacity, domestic regulatory alignment, cost arbitrage
South America USD 0.56 Billion Agrochemical screening, ANVISA pathway development
Middle East & Africa 3.6% share Sovereign health investment, pharmaceutical localization
Total USD 12.07 Billion

Regional distribution within the In Vitro Toxicology Testing Market tracks pharmaceutical R&D concentration more closely than population or GDP. Regulatory permissiveness acts as the second variable: jurisdictions that have codified acceptance of non-animal data convert scientific interest into purchase orders faster.


North America

Country Metric (2025) Key Driver
US 82.4% of region FDA Modernization Act 2.0 and New Alternative Methods Program
Canada USD 0.61 Billion Health Canada alignment and academic contract capacity
Mexico 10.8% CAGR Nearshored pharmaceutical manufacturing and CRO growth


American dominance of the In Vitro Toxicology Testing Market rests on concentration: the top 20 pharmaceutical sponsors headquartered or operating research centers in the United States account for over half of global preclinical safety spend [12]. FDA's 2025 roadmap for monoclonal antibody development set explicit expectations that sponsors justify animal use, and the agency's Innovative Science and Technology Approaches for New Drugs program has reviewed more than 40 platform submissions [2]. Canadian growth flows through university-affiliated laboratories in Ontario and Quebec.

Europe

Country Metric (2025) Key Driver
Germany 23.6% of region Chemical industry REACH dossier volume
UK USD 0.58 Billion Post-Brexit MHRA innovation pathway
France 11.4% CAGR Cosmetics sector reformulation demand
Italy 9.2% of region Generic pharmaceutical safety filings
Spain USD 0.24 Billion Contract laboratory expansion in Catalonia
Nordic Countries 12.1% CAGR Public-sector research funding density
Russia 3.8% of region Domestic pharmaceutical localization
Rest of Europe USD 0.31 Billion Central European CRO consolidation


European demand is regulation-manufactured. ECHA has processed more than 26,000 REACH registration dossiers, and its guidance now positions animal testing as a last resort under Article 25 [4]. The Commission's 2023 response to the European Citizens' Initiative committed to a roadmap phasing out animal testing for chemical safety, with initial deliverables landing across 2025 and 2026 [3]. German chemical producers, facing the largest dossier burden, have moved earliest.

Asia-Pacific

Country Metric (2025) Key Driver
China 31.5% of region NMPA reform and domestic biotech pipeline scale
India 15.4% CAGR CDSCO acceptance pathway and cost-competitive CRO base
Japan USD 0.47 Billion JaCVAM validation leadership and pharmaceutical exports
South Korea 11.2% of region Cosmetics animal-testing ban and biosimilar output
ASEAN 13.6% CAGR Singapore and Malaysia laboratory infrastructure investment
Rest of Asia-Pacific USD 0.16 Billion Australian academic and agricultural screening


Growth leadership in the Asia-Pacific portion of the In Vitro Toxicology Testing Market comes from supply, not just demand. Indian and Chinese contract research organizations have added capacity aggressively, and India's 2023 amendment to the New Drugs and Clinical Trials Rules formally recognized non-animal methods for drug safety assessment [17]. Japan's JaCVAM has contributed several validated protocols to OECD guidelines, giving regional laboratories credibility with Western sponsors [6].

South America

Country Metric (2025) Key Driver
Brazil 56.3% of region ANVISA regulatory modernization and agrochemical volume
Argentina USD 0.09 Billion Veterinary and food safety testing demand
Rest of South America 9.8% CAGR Chilean and Colombian academic laboratory growth


Brazilian momentum reflects agricultural chemistry more than pharmaceuticals. The country registers several hundred pesticide products annually, and CONCEA has recognized 24 alternative methods as mandatory substitutes where validated protocols exist [18]. Regional constraint remains capital: most laboratories license assay kits rather than acquire imaging and microfluidics platforms outright.

Middle East & Africa

Country Metric (2025) Key Driver
Saudi Arabia 24.1% of region Vision 2030 biotech localization funding
UAE 13.4% CAGR Free-zone pharmaceutical manufacturing clusters
South Africa USD 0.08 Billion Established academic toxicology infrastructure
Egypt 9.4% of region Generic pharmaceutical production scale
Rest of MEA 11.6% CAGR Health-system modernization programs


Saudi Arabia's National Biotechnology Strategy targets USD 34 billion in sector GDP contribution by 2040 and has funded laboratory infrastructure at King Abdullah University and the Saudi Food and Drug Authority [19]. Regional volumes stay modest, but sovereign capital removes the financing constraint that limits South American and African adoption.


In Vitro Toxicology Testing Market By Region, 2025-2035

Competitive Benchmarking

Concentration sits in the medium band. The estimated HHI for the In Vitro Toxicology Testing Market falls near 520, with the top five suppliers holding a combined 34–38% of revenue. No single provider exceeds a tenth of the market, and the long tail of specialist assay developers and regional contract laboratories remains commercially significant — fragmentation persists because validation credibility, not manufacturing scale, determines who wins a given tender.

Company Est. Revenue Share Range Key Offerings for In Vitro Toxicology Testing Market Strategic Positioning
Thermo Fisher Scientific ~8–11% Cell culture reagents, high-content imaging, assay kits Breadth leader across consumables and instruments
Charles River Laboratories ~7–10% Integrated preclinical safety services, hepatotoxicity panels Service-led incumbent converting animal work to alternatives
Labcorp (Early Development) ~6–8% Genotoxicity, safety pharmacology, regulatory submission support Regulatory dossier expertise and global site network
Eurofins Scientific ~5–7% Chemical and cosmetics safety testing, REACH support Compliance-driven volume across Europe
Merck KGaA ~4–6% Cell lines, media, cytotoxicity assay reagents Upstream supply position with high switching cost
Danaher (Molecular Devices) ~4–6% High-content screening systems, 3D organoid imaging Instrumentation and workflow automation
Bio-Rad Laboratories ~3–5% Multiplex immunoassays, cell analysis platforms Mid-tier laboratory penetration
SGS SA ~3–5% Regulatory toxicology testing, product safety certification Certification credibility across consumer sectors
Agilent Technologies ~3–4% Metabolic analysis, real-time cell analysis instrumentation Analytical instrumentation adjacency
Evotec SE ~2–4% Panomics, iPSC-derived toxicity screening Discovery-stage partnership model
Inotiv (MatTek) ~2–3% Reconstructed human tissue models for dermal and ocular work Niche leadership in validated tissue constructs
Promega Corporation ~2–3% Bioluminescent cytotoxicity and apoptosis assays Reagent innovation and academic channel strength


Recent News & Developments

  • U.S. Food and Drug Administration (April 2025): Published a roadmap to reduce animal testing in monoclonal antibody development, naming organ-on-chip and computational models as primary substitutes and committing agency resources to qualification review [2]
  • European Commission (July 2023): Responded to the "Save Cruelty Free Cosmetics" citizens' initiative with a commitment to develop a roadmap phasing out animal testing for chemical safety assessment [3]
  • Charles River Laboratories (September 2024): Expanded its complex in vitro model portfolio through partnership agreements covering liver and kidney microphysiological systems, targeting sponsors preparing IND submissions without rodent bridging data [15]
  • U.S. Environmental Protection Agency (November 2023): Reaffirmed its new approach methodologies work plan, extending program targets for reducing mammalian study requests across pesticide and industrial chemical registrations [7]
  • Government of India, CDSCO (2023–2024): Amended the New Drugs and Clinical Trials Rules to formally permit non-animal methods, including organ-on-chip and 3D organoid data, in drug safety assessment filings [17]
  • National Center for Advancing Translational Sciences (February 2025): Extended tissue-chip validation funding through its Tissue Chip Testing Centers, bringing cumulative federal commitment past the USD 130 million mark [5]


In-Vitro Toxicology Testing Market Report Scope

Parameter Details
Market Scope Global In Vitro Toxicology Testing Market across technology, method, application, end user, and geography
Study Period 2021–2035 (Historical 2021–2024; Base Year 2025; Forecast 2026–2035)
CAGR 11.2% (2026–2035)
Market Size Checkpoints USD 12.07 Billion (2025); USD 13.42 Billion (2026); USD 34.90 Billion (2035)
Fastest Growing Segments In-Silico methods (15.0% CAGR); OMICS technologies (14.6% CAGR); Diagnostics end user (13.9% CAGR); Asia-Pacific (13.2% CAGR)
Companies Profiled Thermo Fisher Scientific, Charles River Laboratories, Labcorp, Eurofins Scientific, Merck KGaA, Danaher, Bio-Rad Laboratories, SGS SA, Agilent Technologies, Evotec SE, Inotiv, Promega Corporation
Valuation Currency USD Billion

FAQs

Should a mid-size sponsor build internal capability or outsource within the In Vitro Toxicology Testing Market?
Build only if annual compound volume exceeds roughly 150 screens; below that, outsourcing beats the USD 400,000–1.2 million capital threshold. Contract laboratories also carry accreditation that internal teams take years to earn [18].
What accreditations should buyers verify before signing a testing contract?
Confirm GLP certification for submission-grade work and ISO/IEC 17025 for analytical scope. Ask specifically which OECD Test Guidelines the laboratory holds validated protocols against, since scope varies widely between sites [6].
How do organ-on-chip platforms compare with 3D spheroids for entrants to the In Vitro Toxicology Testing Market?
Spheroids cost less and scale to screening volumes; chips add perfusion and multi-organ crosstalk that spheroids cannot replicate. Start with spheroids for triage and reserve chips for mechanistic follow-up [5].
What integration problems surface most often during platform adoption?
Data schema mismatch between imaging output and existing LIMS causes the majority of delays. Reproducibility across operators is the second issue; standardized SOPs and shared reference compounds materially reduce variance [10].
Which emerging use cases sit outside pharmaceuticals in the In Vitro Toxicology Testing Market?
Medical device leachables testing, microplastic toxicity assessment, and cultivated-meat ingredient safety are all growing. Each borrows validated protocols from pharmaceutical work while facing lighter regulatory precedent [21].
Does regulatory acceptance differ between cosmetics and pharmaceuticals?
Yes, substantially. Cosmetics regulators in the EU and South Korea accept non-animal data as the default, while pharmaceutical regulators still evaluate case by case and often request supporting rationale [3][20].
What should investors examine in a testing provider's revenue quality?
Look at the share of revenue from multi-year master service agreements versus one-off studies. Providers with licensed data or software components typically hold better margin durability than pure wet-lab operators [23].    
Author
Author
Author Profile
Nidhi Mandole LinkedIn
Senior Research Analyst
She is an extremely curious individual currently working in Healthcare and Medical Devices Domain. Nidhi is comfortably versed in data centric research backed by healthcare educational background. She leverages extensive data mining and analytics tools such as Primary and Secondary Research, Statistical Analysis, Machine Learning, Data Modelling. Her key role also involves Technical Sales Support, Client Interaction and Project management within the Healthcare team. Lastly, she showcases extensive affinity towards learning new skills and remain fascinated in implementing them.
Co-Author
Co-Author Profile
Rahul Gotadki LinkedIn
Research Manager
He holds an experience of about 9+ years in Market Research and Business Consulting, working under the spectrum of Life Sciences and Healthcare domains. Rahul conceptualizes and implements a scalable business strategy and provides strategic leadership to the clients. His expertise lies in market estimation, competitive intelligence, pipeline analysis, customer assessment, etc.
Share::
Request Free Sample
Download Free Sample

Kindly complete the form below to receive a free sample of this Report

* Please use a valid business email

Share::
Request Free Sample
Download PDF ×

We do not share your information with anyone. However, we may send you emails based on your report interest from time to time. You may contact us at any time to opt-out.
















