Pressure Sensitive Labels Market (2026 - 2035)

Pressure Sensitive Labels Market Research Report Information By Print Process (Flexography, Gravure, Inkjet, Screen, Letterpress, and Other), By End-User (Food, Beverage, Healthcare, Cosmetics, Household, Industrial, and Other), By Adhesive Type (Water-Based Acrylic, Hot-Melt Rubber-Based, Solvent-Based, and UV-Curable) – Forecast Till 2035
ID: MRFR/PCM/0968-HCR
119 Pages
Snehal Singh
Last Updated: July 28, 2026
Pressure Sensitive Labels Market
Market Size
Forecast Period2026-2035
CAGR (2026-2035)4.25%
2025 Market SizeUSD 25.12 Billion
2035 Market SizeUSD 38.08 Billion
Key Players
Avery Dennison
CCL Industries
UPM Raflatac
Multi-Color Corporation
Coveris
Constantia Flexibles
Opportunities
  • Smart and Connected Labels
  • Linerless and Sustainable Substrates
  • Emerging Market Capacity Build-Out

Pressure Sensitive Labels Market Summary

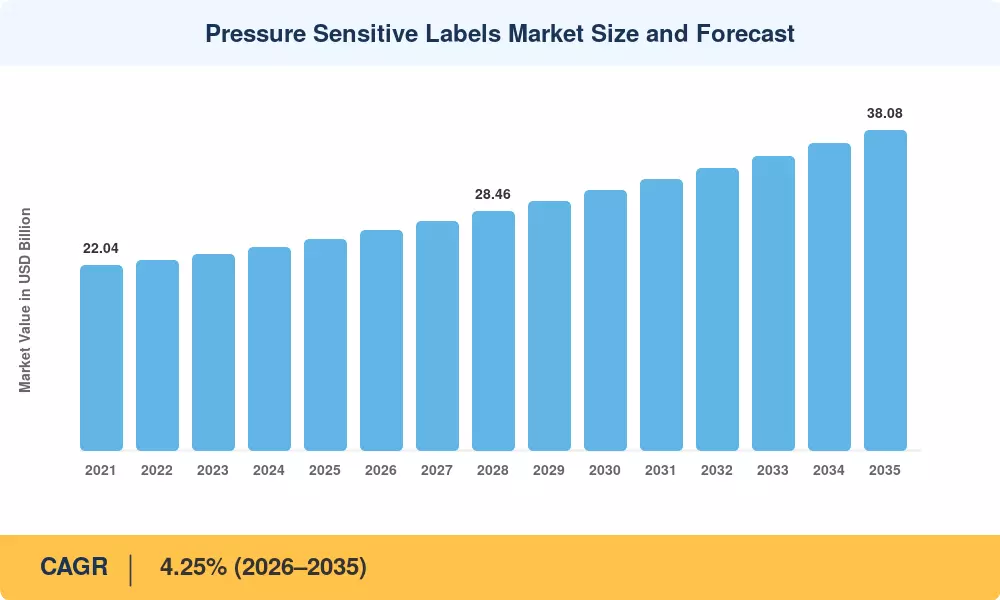
The Pressure Sensitive Labels Market reached a valuation of USD 25.12 Billion in 2025 and is projected to grow from USD 26.19 Billion in 2026 to USD 38.08 Billion by 2035, registering a CAGR of 4.25% during the forecast period. Growth is being shaped by two powerful catalysts: the global expansion of e-commerce logistics, which demands durable address and return labels at unprecedented volumes, and tightening traceability mandates across food and pharmaceutical supply chains. The EU's Falsified Medicines Directive and the U.S. FDA's Drug Supply Chain Security Act continue to impose serialization requirements that directly increase label consumption per unit shipped [1][2].

A technology shift is well underway in the Pressure Sensitive Labels Market. Conventional analog presses that dominated for decades are giving way to digital inkjet and electrophotographic platforms capable of economical short-run production. Global investment in digital label press installations exceeded USD 1.8 Billion cumulatively through 2024, driven by brand owners seeking versioned packaging, late-stage customization, and faster time-to-shelf [3]. Producers are simultaneously scaling sustainability efforts—linerless formats, compostable facestocks, and bio-based adhesives—to comply with Extended Producer Responsibility legislation expanding across the EU and parts of Southeast Asia [4].

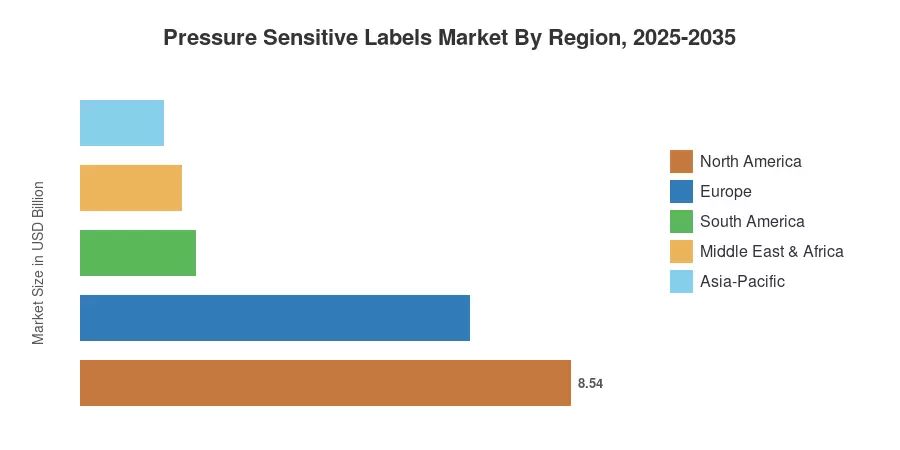
North America commands the largest share of the Pressure Sensitive Labels Market at roughly 34% of global revenue, supported by mature consumer goods and pharmaceutical end-use sectors. Asia-Pacific is the fastest-growing region with a CAGR of 5.75%, fueled by rising packaged-food penetration in India and ASEAN nations. Europe holds the second-largest share at approximately 27%, where regulatory harmonization under the EU Green Deal is accelerating the adoption of recyclable label substrates. The next decade will see intensifying competition as converters in developing markets build scale and challenge established Western suppliers.


Key Report Takeaways

• By Print Process

  • Flexography held a 41.2% share of the Pressure Sensitive Labels Market in 2025, reflecting its cost efficiency for long-run commodity labels.
  • Inkjet-based digital printing is the fastest-growing print process, expanding at a CAGR of 7.4% through 2035 as brand owners shift to shorter production runs.

• By End-User

  • Food and beverage sectors together accounted for USD 11.30 Billion in 2025, making them the dominant demand base in the Pressure Sensitive Labels Market.
  • Cosmetics end-use is projected to grow at a CAGR of 5.97% between 2026 and 2035, driven by premiumization and SKU proliferation.

• By Region

  • Asia-Pacific is expected to grow at a 5.75% CAGR during 2026–2035, the highest among all regions in the Pressure Sensitive Labels Market.
  • North America accounted for approximately 34% of global revenue in 2025, anchored by pharmaceutical serialization demand.


Pressure Sensitive Labels Market Size and Forecast (2021–2035)

The market sizing methodology integrates bottom-up revenue estimates from converter-level shipment data with top-down cross-validation using end-user industry consumption patterns. Historical figures (2021–2024) draw on trade association data from FINAT, TLMI, and national packaging federations, while forecast projections apply econometric modeling calibrated to GDP growth, industrial output indices, and regulatory timelines across 42 countries [5][6].
Pressure Sensitive Labels Market Size and Forecast
Our Impact
Enabled $4.3B Revenue Impact for Fortune 500 and Leading Multinationals
Partnering with 2000+ Global Organizations Each Year
30K+ Citations by Top-Tier Firms in the Industry

Driver Impact Analysis

Driver ~% Impact on CAGR Geographic Relevance Impact Timeline
E-commerce logistics expansion ~22% Global Short-term (≤2 yr)
Digital press adoption for short runs ~18% North America, Europe Medium-term (2–4 yr)
Pharmaceutical serialization mandates ~16% North America, EU, India Medium-term (2–4 yr)
Sustainability & linerless formats ~14% Europe, Asia-Pacific Long-term (≥4 yr)
Premiumization in cosmetics/personal care ~12% Global Medium-term (2–4 yr)
Food-safety labeling regulations ~10% Asia-Pacific, South America Long-term (≥4 yr)
Smart & connected label integration ~8% North America, Europe Long-term (≥4 yr)


E-Commerce Logistics Expansion

In 2024, there were more than 180 billion e-commerce parcels worldwide, and each one needed at least one address label and often a return label [9]. The Labels Sensitive to Pressure Because pressure-sensitive formats predominate in logistics labeling—they apply swiftly on automated lines and adhere consistently to corrugated substrates—the market directly benefits from this trend. Over 7 billion shipments are processed by Amazon alone each year, and regional fulfillment networks in Latin America and Southeast Asia are duplicating this model at double-digit growth rates, resulting in a steady increase in demand for high-volume label rolls [9][12].


Digital Press Adoption

Over 8,500 digital label presses are currently in use across commercial converters and brand-owner in-house facilities, a 14% increase in the installed base of digital label presses globally in 2024 [3]. Plate expenses are eliminated, changeover times are reduced to minutes, and variable-data printing—which is necessary for advertising campaigns and regulatory compliance—is made possible by digital presses. This change is increasing the addressable opportunity for the pressure-sensitive labels market: jobs that were previously completed by offset or letterpress are moving to digital workflows, and converters report that over the past five years, average order quantities have decreased by 30% while order frequency has increased by 45% [3][6].


Pharmaceutical Serialization Mandates

The U.S. DSCSA enforcement milestones, which reached enhanced product tracing requirements in November 2024, mandate unique serialized identifiers on each pharmaceutical package [2]. The EU Falsified Medicines Directive imposes comparable anti-tampering and track-and-trace obligations. These regulations increase label content density and often require specialized substrates with tamper-evident features, boosting per-unit label value in the Pressure Sensitive Labels Market. India's FSSAI labeling standards, expected to expand serialization to nutraceuticals by 2027, will add another high-growth compliance layer [2][10].

Sustainability and Linerless Formats

Extended Producer Responsibility frameworks now cover packaging waste in 27 EU member states, parts of Canada, and several Australian states, pressuring brand owners to reduce non-recyclable components in their label constructions [4][8]. Linerless label technology eliminates the silicone-coated release liner—historically 40–50% of label material waste—and can cut material consumption by up to 40% per linear meter. Major converters invested over USD 320 Million in linerless-capable press lines and adhesive R&D between 2022 and 2025, signaling a structural transition within the Pressure Sensitive Labels Market toward lower-waste formats [4].


Restraints Impact Analysis

Restraint ~% Impact on CAGR Geographic Relevance Impact Timeline
Raw material price volatility (films, adhesives) ~–18% Global Short-term (≤2 yr)
High capital cost of digital press migration ~–15% Emerging markets Medium-term (2–4 yr)
Recyclability challenges for multi-layer laminates ~–12% Europe, North America Long-term (≥4 yr)
Shrink sleeve substitution threat ~–10% Asia-Pacific, South America Medium-term (2–4 yr)
Skilled labor shortages in converting operations ~–8% Global Short-term (≤2 yr)


Raw Material Price Volatility

Between 2022 and 2024, petrochemical feedstock changes and logistics interruptions caused price swings of 18–25% for polypropylene and polyester films, which together account for around 55% of pressure-sensitive facestock use [6]. The trajectory of acrylic adhesive resins was comparable. In the Pressure Sensitive Labels Market, these input cost fluctuations put pressure on converter margins and can postpone capacity investment decisions, especially for mid-tier converters with narrow EBITDA margins of 8–12% [6][17].


Shrink Sleeve Substitution

Full-body shrink sleeves, which provide 360-degree printing surface area and adhere to intricate container geometries, directly compete with pressure-sensitive labels in beverage and personal care packaging. Between 2021 and 2024, shrink sleeve consumption in Asia-Pacific increased at a rate of about 5.8% CAGR, surpassing pressure-sensitive formats in several categories like ready-to-drink beverages. The Pressure Sensitive Labels Market is somewhat constrained in price-sensitive markets where brand owners place a higher priority on shelf impact than label-switching flexibility due to this replacement risk.


Recyclability Challenges

Multi-material label constructions—combining PET facestocks with acrylic adhesives and PE liners—create contamination problems in PET and HDPE recycling streams [8]. The Association of Plastic Recyclers has flagged pressure-sensitive labels as a leading source of recycling yield loss in North American MRFs. Until mono-material or wash-off adhesive systems achieve price parity, this recyclability gap will invite regulatory scrutiny and could expose the Pressure Sensitive Labels Market to material-substitution mandates in the medium term [4][8].


Pressure Sensitive Labels Market Opportunities

Smart and Connected Labels

NFC and RFID-enabled pressure-sensitive labels are opening a new value tier. The cost of embedding an NFC inlay into a standard label dropped below USD 0.08 per unit in 2024, making mass-market deployment economically viable for anti-counterfeiting, consumer engagement, and supply-chain visibility applications [13]. Spirits, luxury cosmetics, and pharmaceutical brands are early adopters, and the Pressure Sensitive Labels Market stands to capture incremental per-label revenue premiums of 3–5× compared to passive print labels.

Linerless and Sustainable Substrates

Brand owners under EPR obligations are actively seeking labeling formats that reduce waste at source. Linerless labels, compostable facestocks derived from wood pulp or PLA, and wash-off adhesive systems collectively represent a sustainability opportunity projected to account for over USD 4.5 Billion in annual revenue by 2035 within the Pressure Sensitive Labels Market [4].

Emerging Market Capacity Build-Out

India, Vietnam, and Brazil are experiencing rapid growth in organized retail and packaged-food consumption, yet local label converting capacity remains constrained. India's label converting industry operates at roughly 78% utilization, creating headroom for greenfield investments [10][12]. Multinational converters establishing regional manufacturing hubs can capture share in the Pressure Sensitive Labels Market while reducing lead times from weeks to days for domestic brand owners.

Data-Driven Label Customization as a Service

Variable-data printing capabilities enable a "labels-as-a-service" model, where converters offer subscription-based versioning for promotional campaigns, regional language variants, and seasonal SKUs [3]. This model shifts revenue from transactional per-roll pricing to recurring platform fees, improving converter margin profiles and deepening customer relationships within the Pressure Sensitive Labels Market.

Pharmaceutical Track-and-Trace Expansion

With serialization mandates expanding from prescription drugs to OTC products and nutraceuticals in India, Brazil, and ASEAN nations, the pharmaceutical end-use segment is expected to generate sustained demand for tamper-evident and serialized pressure-sensitive label constructions through 2035 [2][10].


Pressure Sensitive Labels Market Future Outlook

AI-Driven Quality Inspection and Press Automation

Machine-vision systems powered by deep-learning algorithms are transforming label quality control. Automated defect detection now achieves accuracy rates above 99.5% at press speeds exceeding 300 meters per minute, reducing waste and rework costs by an estimated 25–30% [13]. Over the next decade, the Pressure Sensitive Labels Market will see AI-enabled closed-loop press control become standard, with real-time adhesive coat-weight adjustment and color management reducing human intervention and enabling lights-out manufacturing shifts.

Circular Economy and Mono-Material Label Design

The EU Packaging and Packaging Waste Regulation targets 2030 for full recyclability of packaging components [8]. For the Pressure Sensitive Labels Market, this means an accelerating shift toward mono-material constructions—polyolefin facestocks paired with compatible adhesives—that do not contaminate recycling streams. CEFLEX, the European circular economy consortium for flexible packaging, estimates that design-for-recyclability investments across the label value chain will reach EUR 1.2 Billion cumulatively by 2032 [4][8].

Platform Economics and Converter Consolidation

The fragmented converter landscape—with an estimated Herfindahl-Hirschman Index below 500—is primed for consolidation [17]. Private equity interest in label converting businesses intensified during 2023–2025, with over 40 M&A transactions completed globally [18]. The Pressure Sensitive Labels Market will increasingly bifurcate between large-scale integrated converters offering end-to-end solutions and specialized niche players focusing on high-value segments such as pharmaceutical or electronics labeling.

ESG Reporting and Supply-Chain Transparency

Corporate Sustainability Reporting Directive (CSRD) requirements, effective for large EU companies from 2025, compel brand owners to disclose the environmental footprint of their packaging supply chains, including labels [8]. The Pressure Sensitive Labels Market will respond with lifecycle-assessment-verified product declarations, carbon-footprint labeling on label products themselves, and verified chain-of-custody certifications for sustainably sourced facestocks. These disclosures will increasingly influence procurement decisions, favoring converters with robust ESG credentials.


Pressure Sensitive Labels Market Segmentation

By Print Process

Segment Metric Primary Demand Driver
Flexography 41.2% share (2025) Cost-efficient long-run production
Gravure USD 3.14 Billion (2025) High-quality image reproduction
Inkjet CAGR 7.4% Short-run versioning and variable data
Screen 5.8% share (2025) Specialty tactile effects
Letterpress USD 1.38 Billion (2025) Legacy installed base in Europe
Other CAGR 3.1% Hybrid and offset niche applications


Flexography remains the dominant print process in the Pressure Sensitive Labels Market, commanding over 41% share thanks to its throughput advantages on runs exceeding 50,000 linear meters. HD flexo plate technology has narrowed the quality gap with gravure, enabling converters to consolidate onto a single press platform for both prime and promotional labels. Gravure retains a stronghold in premium segments—spirits, tobacco, and high-end cosmetics—where tonal consistency across millions of impressions justifies higher plate costs [6].

Inkjet digital printing is the clear growth leader, expanding at a 7.4% CAGR as brand owners demand faster turnaround and versioned packaging. Single-pass inkjet platforms from suppliers such as Durst, Domino, and Screen GP now match flexo-level throughput on runs under 20,000 meters, making them economically competitive for a growing share of the Pressure Sensitive Labels Market volume [3].

By End-User

Segment Metric Primary Demand Driver
Food 28% share (2025) Regulatory labeling, freshness dating
Beverage USD 4.55 Billion (2025) Brand differentiation, promotional labels
Healthcare CAGR 5.3% Serialization and tamper-evidence
Cosmetics CAGR 5.97% Premiumization, SKU proliferation
Household 8.5% share (2025) Private-label growth
Industrial USD 2.89 Billion (2025) Durability and GHS compliance
Other CAGR 3.4% Logistics, retail, automotive


Food is the single largest end-user segment in the Pressure Sensitive Labels Market, driven by mandatory nutritional labeling, allergen declarations, and freshness-date printing requirements that continue to expand globally. The beverage segment follows closely, with craft beer, premium spirits, and ready-to-drink categories fueling demand for differentiated label constructions featuring metallic inks, textured substrates, and embossed finishes [9].

Cosmetics represents the fastest-growing end-user category at a 5.97% CAGR, as beauty brands accelerate SKU launches—often exceeding 50 new SKUs per brand per year—and demand multi-page booklet labels, clear-on-clear constructions, and smart-label integrations that engage consumers via smartphone interactions.

By Adhesive Type

Segment Metric Primary Demand Driver
Water-Based Acrylic 50.6% share (2025) Regulatory preference, versatility
Hot-Melt Rubber-Based USD 5.82 Billion (2025) Cold-temperature performance
Solvent-Based CAGR 2.1% Declining due to VOC regulations
UV-Curable CAGR 6.2% High-speed curing, specialty applications


Water-based acrylic adhesives dominate the Pressure Sensitive Labels Market with over 50% share, favored for their broad substrate compatibility, low VOC emissions, and regulatory acceptance in food-contact applications [6]. Hot-melt rubber-based systems retain significant share in cold-chain logistics and freezer-grade applications where initial tack at sub-zero temperatures is critical. UV-curable adhesives, while still a niche, are growing rapidly as converters pursue faster curing speeds and reduced energy consumption on high-speed press lines.


Regional Market Share Analysis

Region Metric Primary Investment Themes
North America 34% share (2025) Pharma serialization, e-commerce labeling
Europe 27% share (2025) EPR compliance, recyclable substrates
Asia-Pacific 5.75% CAGR (2026–2035) Packaged food growth, capacity expansion
South America USD 2.01 Billion (2025) Organized retail expansion
Middle East & Africa USD 1.76 Billion (2025) Halal certification labeling, industrial growth
Total USD 25.12 Billion (2025)

The Pressure Sensitive Labels Market spans five macro-regions, with North America and Europe together accounting for over 60% of global revenue. Asia-Pacific's growth trajectory is reshaping competitive dynamics as domestic converters scale to serve fast-growing FMCG and pharmaceutical sectors.


North America

Country Metric Key Driver
US 62% of regional share Pharmaceutical DSCSA compliance
Canada CAGR 3.9% Cannabis and nutraceutical labeling
Mexico USD 1.37 Billion (2025) Nearshoring-driven industrial labeling


The United States drives the bulk of North American demand in the Pressure Sensitive Labels Market, supported by the world's largest pharmaceutical packaging sector and a mature e-commerce infrastructure. Canada's cannabis legalization has created a specialized labeling niche requiring child-resistant, compliance-heavy constructions. Mexico benefits from nearshoring trends that are expanding manufacturing output and, by extension, industrial labeling requirements [1][9].

Europe

Country Metric Key Driver
Germany CAGR 3.8% Automotive and chemical labeling
UK USD 1.25 Billion (2025) Retail private-label growth
France 15% of regional share Cosmetics and luxury packaging
Italy CAGR 3.6% Food and wine label heritage
Spain USD 0.62 Billion (2025) Agricultural export labeling
Nordic Countries 9% of regional share Sustainability-first substrate adoption
Russia CAGR 2.9% Import substitution in labeling
Rest of Europe 18% of regional share Regulatory harmonization


European demand in the Pressure Sensitive Labels Market is shaped by the EU Packaging and Packaging Waste Regulation, which mandates recyclability criteria for all packaging components, including labels, by 2030 [8]. Germany's industrial base generates high-volume demand for durable labels in automotive and chemical applications, while France's cosmetics industry—home to global brand owners—pushes premiumization in label materials and finishes.

Asia-Pacific

Country Metric Key Driver
China 38% of regional share Scale manufacturing, FMCG expansion
India CAGR 6.8% FSSAI food-labeling mandates
Japan USD 1.15 Billion (2025) Precision electronics labeling
South Korea 11% of regional share Beauty and skincare labeling
ASEAN CAGR 5.9% Rising packaged-food penetration
Rest of Asia-Pacific 8% of regional share Emerging pharma and agri-chem


Asia-Pacific represents the fastest-growing region in the Pressure Sensitive Labels Market. China's massive consumer goods sector generates the largest absolute volumes in the region, while India's FSSAI regulatory framework is mandating front-of-pack nutritional labeling that increases per-unit label area and complexity [10]. ASEAN markets—particularly Vietnam, Indonesia, and the Philippines—are transitioning from unpackaged to packaged food distribution, creating greenfield demand for self-adhesive labels [12].

South America

Country Metric Key Driver
Brazil 52% of regional share Beverage and agribusiness labeling
Argentina CAGR 3.7% Wine and food export compliance
Rest of South America USD 0.58 Billion (2025) Retail modernization


Brazil anchors the South American Pressure Sensitive Labels Market with strong beverage and personal-care sectors. ANVISA's evolving front-of-pack warning label regulations, modelled on Chile's successful program, are expanding label real estate and driving re-qualification of adhesive systems for tropical storage conditions [14].

Middle East & Africa

Country Metric Key Driver
Saudi Arabia CAGR 4.1% Vision 2030 industrial diversification
UAE 24% of regional share Re-export hub, logistics labeling
South Africa USD 0.32 Billion (2025) FMCG and pharmaceutical demand
Egypt CAGR 3.9% Food-processing sector growth
Rest of MEA 38% of regional share Halal and export certification


The Middle East and Africa region in the Pressure Sensitive Labels Market is benefiting from Saudi Arabia's Vision 2030 industrialization program, which is expanding domestic food processing and pharmaceutical manufacturing capacity. The UAE functions as a logistics hub, generating demand for durable shipping and compliance labels that withstand high-temperature environments [14].


Pressure Sensitive Labels Market By Region, 2025-2035

Competitive Benchmarking

The Pressure Sensitive Labels Market is characterized by low concentration, with an estimated HHI below 500 and the top five players collectively holding approximately 28–33% of global revenue. The landscape includes multinational material suppliers, integrated converter groups, and regional specialists. Competition centers on substrate innovation, geographic coverage, and digital-press capabilities, with vertical integration—from adhesive coating through converted label delivery—emerging as a key differentiator [17][18].

Company Est. Revenue Share Range Key Offerings for Pressure Sensitive Labels Market Strategic Positioning
Avery Dennison ~8–11% Facestock materials, intelligent labels, RFID inlays Vertically integrated material innovator
CCL Industries ~7–10% Multi-technology label converting, specialty films Global converter with broadest geographic footprint
UPM Raflatac ~4–6% Labelstock, Forest Film, RafCycle recycling Sustainability leader in facestock materials
Multi-Color Corporation ~3–5% Premium label converting for beverages and spirits Niche focus on high-value decoration
Coveris ~2–4% Flexible packaging, label films Integrated packaging-and-labels approach
Constantia Flexibles ~2–4% Pharma labels, flexible packaging laminates Pharmaceutical specialization
Lintec Corporation ~2–3% Specialty adhesive films, electronic labels Technology-driven adhesive R&D
Henkel AG ~2–3% Adhesive systems for label applications Upstream adhesive chemistry expertise
3M ~1–3% Industrial and specialty label solutions Diversified materials science platform
Huhtamaki ~1–2% Flexible packaging, label laminates Emerging markets manufacturing scale


Recent News & Developments


  • CCL Industries (June 2024): Acquired a German specialty label converter with EUR 45 Million annual revenue, strengthening its pharmaceutical labeling portfolio in Europe [18].


  • Lintec Corporation (November 2023): Commissioned a new adhesive-coating line in Vietnam with annual capacity of 120 Million square meters, addressing rising ASEAN demand [12].


  • FSSAI India (May 2023): Announced phased implementation of front-of-pack nutritional labeling on packaged foods, expanding mandatory label content and increasing per-unit label consumption in India's Pressure Sensitive Labels Market [10].


Pressure Sensitive Labels Market Report Scope

Parameter Detail
Market Scope Global Pressure Sensitive Labels Market covering materials, converting, and end-use demand
Study Period 2021–2035
CAGR (Forecast Period) 4.25% (2026–2035)
Base Year Market Size USD 25.12 Billion (2025)
Forecast Endpoint USD 38.08 Billion (2035)
Fastest Growing Segment Inkjet print process (CAGR 7.4%); Asia-Pacific (CAGR 5.75%)
Companies Profiled 10 (Avery Dennison, CCL Industries, UPM Raflatac, Multi-Color Corporation, Coveris, Constantia Flexibles, Lintec Corporation, Henkel AG, 3M, Huhtamaki)
Valuation Currency USD Billion


FAQs

How do wash-off adhesives affect recyclability of labeled PET containers?
Wash-off adhesives dissolve cleanly during the PET hot-wash recycling process at 80–85°C, preventing label contamination of flake streams. Recyclers report yield improvements of 12–15% when wash-off labels replace conventional permanent adhesives [4].
What minimum order quantities make digital label printing more cost-effective than flexography?
Digital printing typically breaks even against flexo at runs below 15,000–20,000 linear meters, depending on substrate and color count. Above that threshold, flexo's lower per-unit consumable cost regains its advantage [3].
How does humidity affect pressure-sensitive adhesive performance in tropical climates?
High humidity above 80% RH can reduce initial tack of water-based acrylics by 10–20%, requiring reformulated high-tack or hot-melt adhesive systems. Converters serving tropical markets routinely specify adhesives tested to ASTM D3654 under elevated humidity [6].
What role do release liners play in total label cost, and how can converters reduce liner waste?
Release liners constitute 25–35% of total material cost in a conventional pressure-sensitive label construction. Linerless formats and thin-liner technologies can reduce this cost component by up to 40% [11].
How are anti-counterfeiting features integrated into pressure-sensitive labels without increasing thickness?
Covert taggants, micro-text, and thin-film NFC inlays add less than 10 microns to total label caliper. These features embed within existing adhesive or facestock layers during coating [13].
What procurement criteria should brand owners prioritize when selecting a label converter?
Key criteria include substrate breadth, digital-and-flexo hybrid capability, food-contact compliance certifications (BRC/IoP, FDA 21 CFR), and demonstrated ESG reporting. Geographic proximity also reduces lead times significantly [17].
How will CSRD reporting obligations change label procurement for EU-based brand owners?
CSRD requires disclosure of Scope 3 packaging emissions starting 2025, incentivizing brand owners to source labels with verified lifecycle-assessment data. Converters offering carbon-footprint declarations will gain procurement preference [8].    
Author
Author
Author Profile
Snehal Singh LinkedIn
Manager - Research
High acumen in analyzing complex macro & micro markets with more than 6 years of work experience in the field of market research. By implementing her analytical skills in forecasting and estimation into market research reports, she has expertise in Packaging, Construction, and Equipment domains. She handles a team size of 20-25 resources and ensures smooth running of the projects, associated marketing activities, and client servicing.

Research Approach


Secondary Research

The secondary research process involved comprehensive analysis of regulatory databases, industry associations, packaging standards organizations, and authoritative trade publications. Key sources included the Tag and Label Manufacturers Institute (TLMI), FINAT (European Federation of Manufacturers of Self-Adhesive Labels), AFERA (European Association for the Self-Adhesive Tape Industry), Printing Industries of America (PIA), Flexible Packaging Association (FPA), World Packaging Organization (WPO), US Environmental Protection Agency (EPA), European Food Safety Authority (EFSA), US Food & Drug Administration (FDA), Occupational Safety and Health Administration (OSHA), Bureau of Labor Statistics (BLS), US Census Bureau (Annual Survey of Manufactures), Eurostat Packaging Database, US International Trade Commission (USITC) trade databases, United Nations Comtrade Database, National Institute of Standards and Technology (NIST), TAPPI (Technical Association of the Pulp and Paper Industry), Smithers Pira market data, NCBI/PubMed for adhesive safety studies, and patent databases (USPTO, EPO, WIPO).

These sources were employed to gather production capacity data, regulatory compliance standards (FDA 21 CFR 175.105 for adhesives, EU Regulation 1935/2004 for food contact materials), sustainability certifications, raw material pricing trends (paper, film, silicone release liners), and competitive intelligence across water-based, solvent-based, hot melt, and radiation-curable adhesive technologies.


Primary Research

Qualitative and quantitative insights were obtained by interviewing supply-side and demand-side stakeholders during the primary research process. The supply-side sources consist of CEOs, VPs of Manufacturing, R&D leaders in adhesive technologies, and commercial directors from pressure-sensitive label manufacturers, face stock suppliers (paper/film), release liner producers, and printing equipment OEMs. The demand-side sources included packaging directors, procurement chiefs, and regulatory compliance managers from Food & Beverage conglomerates, pharmaceutical manufacturers, personal care brands, third-party logistics providers, and e-commerce fulfillment centers. Primary research verified market segmentation by composition (face stock, adhesive, liner, topcoat), confirmed product development timelines for linerless and sustainable labeling solutions, and collected insights on the adoption of digital printing, pricing strategies per thousand labels, and supply chain dynamics for recycled content materials.

Primary Respondent Breakdown:

By Designation: C-level Primaries (32%), Director Level (30%), Others (38%)

By Region: North America (38%), Europe (28%), Asia-Pacific (28%), Rest of World (6%)


Market Size Estimation

Revenue mapping and production volume analysis were implemented to determine global market valuation. The methodology comprised the following:

Identification of over 40 significant manufacturers and converters in North America, Europe, Asia-Pacific, and Latin America, including Avery Dennison, 3M, CCL Industries, UPM Raflatac, and regional specialists

Product mapping for substrate types (paper, PP, PET, PE materials), permanent versus removable adhesives, and release liner versus linerless technologies Disaggregation of annual revenues for pressure-sensitive label portfolios, as reported and modeled, by technology (water-based, solvent-based, hot melt, UV/EB cured) and end-use application

Manufacturers that account for 75-80% of the global market share in 2024 are included in the coverage.

Cross-validation of segment-specific valuations against import/export trade data for self-adhesive label stock (HS Code 4821.10, 3919.10) and regional production statistics is achieved through extrapolation using bottom-up (square meter consumption × ASP by composition type and country) and top-down (manufacturer revenue triangulation) approaches.

Download Free Sample

Kindly complete the form below to receive a free sample of this Report

Download PDF ×

We do not share your information with anyone. However, we may send you emails based on your report interest from time to time. You may contact us at any time to opt-out.
















