×
Hero Background
English
Chinese
French
Japanese
Korean
German
Spanish

Process Spectroscopy Market Analysis

ID: MRFR/SEM/10814-HCR
128 Pages
Aarti Dhapte
October 2025

Process Spectroscopy Market Research Report Information By Technology (NIR, FT-IR, and Raman), By End-use (Polymer, Oil and Gas, Pharmaceuticals, Food, and Agriculture, Chemical, and Others), And By Region (North America, Europe, Asia-Pacific, And Rest Of The World) –Industry Size, Share and Forecast Till 2035

Share:
Download PDF ×

We do not share your information with anyone. However, we may send you emails based on your report interest from time to time. You may contact us at any time to opt-out.

Process Spectroscopy Market Infographic
Purchase Options

Market Analysis

In-depth Analysis of Process Spectroscopy Market Industry Landscape

The Process Spectroscopy Market is characterized by dynamic and evolving market dynamics that influence its growth and trends. One of the key driving forces is the increasing emphasis on quality control and process optimization across industries. As manufacturing processes become more complex, the demand for real-time monitoring and analysis of materials rises, propelling the adoption of process spectroscopy technologies. Industries such as pharmaceuticals, food and beverages, and chemicals seek to enhance product quality and operational efficiency, driving the market forward.

Technological advancements play a pivotal role in shaping the market dynamics of process spectroscopy. Continuous innovation in spectroscopy hardware, software, and analytical techniques results in improved accuracy, reliability, and versatility of spectroscopy solutions. The integration of artificial intelligence and machine learning further amplifies the capabilities of these systems, enabling predictive analytics and proactive process adjustments. This relentless pursuit of technological excellence not only meets the current industry demands but also expands the scope of applications, fostering market growth.

Regulatory landscape dynamics significantly impact the Process Spectroscopy Market. Stringent regulations and standards in industries such as pharmaceuticals and food processing propel the adoption of spectroscopy solutions for compliance and quality assurance. As regulatory bodies worldwide tighten their scrutiny on manufacturing processes, companies are increasingly investing in process spectroscopy technologies to ensure adherence to standards. The ability of spectroscopy solutions to provide accurate and traceable data aligns well with regulatory requirements, making them indispensable for compliance.

Economic factors also contribute to the market dynamics of process spectroscopy. Economic stability and growth stimulate investments in industrial processes, prompting companies to adopt advanced technologies like process spectroscopy for efficiency gains. Conversely, economic downturns may lead to budget constraints and a cautious approach toward technology investments. Understanding these economic fluctuations is essential for market players to tailor their strategies according to prevailing economic conditions.

The global nature of the Process Spectroscopy Market introduces geographical dynamics that impact its trajectory. Regions with established industrial bases and a culture of technological innovation, such as North America and Europe, often witness early adoption of process spectroscopy solutions. However, the market dynamics are shifting, with emerging economies in Asia-Pacific and Latin America gaining prominence. Rapid industrialization in these regions, coupled with a growing awareness of the benefits of process spectroscopy, presents significant growth opportunities.

Competitive dynamics form a critical aspect of the Process Spectroscopy Market. The presence of numerous players, ranging from established companies to startups, fosters a competitive landscape. Market players engage in continuous innovation, strategic partnerships, and mergers and acquisitions to strengthen their market position. This competitive environment not only spurs technological advancements but also provides customers with a diverse range of options, fostering healthy market dynamics.

Furthermore, environmental and sustainability considerations are increasingly influencing market dynamics. Process spectroscopy aids in optimizing resource utilization, reducing waste, and minimizing environmental impact. As industries face growing pressure to adopt sustainable practices, the demand for process spectroscopy solutions that contribute to environmental goals is on the rise, influencing market dynamics in favor of eco-friendly technologies.

Author
Aarti Dhapte
Team Lead - Research

She holds an experience of about 6+ years in Market Research and Business Consulting, working under the spectrum of Information Communication Technology, Telecommunications and Semiconductor domains. Aarti conceptualizes and implements a scalable business strategy and provides strategic leadership to the clients. Her expertise lies in market estimation, competitive intelligence, pipeline analysis, customer assessment, etc.

Leave a Comment

FAQs

What is the projected market valuation of the Process Spectroscopy Market by 2035?

The Process Spectroscopy Market is projected to reach a valuation of 51.46 USD Billion by 2035.

What was the overall market valuation of the Process Spectroscopy Market in 2024?

In 2024, the overall market valuation of the Process Spectroscopy Market was 23.22 USD Billion.

What is the expected CAGR for the Process Spectroscopy Market during the forecast period 2025 - 2035?

The expected CAGR for the Process Spectroscopy Market during the forecast period 2025 - 2035 is 7.5%.

Which technology segments are included in the Process Spectroscopy Market?

The technology segments in the Process Spectroscopy Market include NIR, FT-IR, and Raman.

What are the projected valuations for the NIR technology segment by 2035?

The NIR technology segment is projected to grow from 8.0 USD Billion to 18.0 USD Billion by 2035.

How does the pharmaceutical sector contribute to the Process Spectroscopy Market?

The pharmaceutical sector is expected to grow from 5.0 USD Billion to 12.0 USD Billion by 2035, indicating its significant contribution.

Market Summary

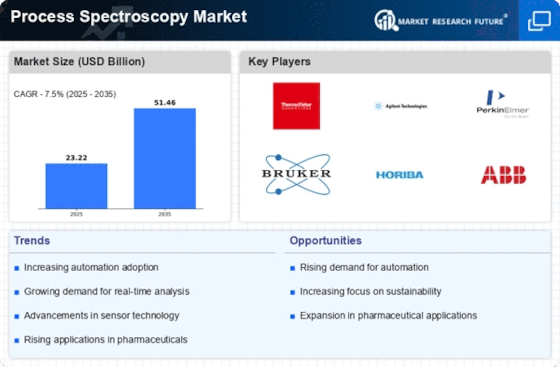
As per MRFR analysis, the Process Spectroscopy Market Size was estimated at 23.22 USD Billion in 2024. The Process Spectroscopy industry is projected to grow from 24.96 USD Billion in 2025 to 51.46 USD Billion by 2035, exhibiting a compound annual growth rate (CAGR) of 7.5 during the forecast period 2025 - 2035.

Key Market Trends & Highlights

The Process Spectroscopy Market is poised for substantial growth driven by technological advancements and increasing regulatory compliance.

  • North America remains the largest market for process spectroscopy, driven by robust industrial applications and technological innovation.
  • The Asia-Pacific region is emerging as the fastest-growing market, fueled by rapid industrialization and increasing investments in research and development.
  • The NIR segment holds the largest share in the market, while the FT-IR segment is experiencing the fastest growth due to advancements in spectroscopic techniques.
  • Key market drivers include the rising demand for real-time analysis and the integration of artificial intelligence, particularly in the pharmaceuticals and oil and gas sectors.

Market Size & Forecast

2024 Market Size 23.22 (USD Billion)
2035 Market Size 51.46 (USD Billion)
CAGR (2025 - 2035) 7.5%
Largest Regional Market Share in 2024 North America

Major Players

<p>Thermo Fisher Scientific (US), Agilent Technologies (US), PerkinElmer (US), Bruker Corporation (US), Horiba (JP), ABB (CH), Siemens (DE), Kett Electric (JP), Yokogawa Electric (JP)</p>

Market Trends

The Process Spectroscopy Market is currently experiencing a notable evolution, driven by advancements in technology and increasing demand for real-time analysis across various industries. This market encompasses a range of spectroscopic techniques that facilitate the analysis of materials and chemical compositions in situ, thereby enhancing efficiency and accuracy in production processes. Industries such as pharmaceuticals, food and beverage, and chemicals are increasingly adopting these technologies to ensure quality control and compliance with regulatory standards. As organizations strive for operational excellence, the integration of process spectroscopy into manufacturing workflows appears to be a strategic move that could yield significant benefits. Moreover, the growing emphasis on sustainability and environmental monitoring is likely to propel the Process Spectroscopy Market further. Companies are seeking innovative solutions to minimize waste and optimize resource utilization, which aligns with the capabilities of spectroscopic methods. These techniques not only provide insights into material properties but also support the development of greener processes. As the market continues to evolve, it seems poised to play a crucial role in shaping the future of industrial operations, fostering a more sustainable and efficient approach to production.

Technological Advancements

Recent innovations in spectroscopic instruments are enhancing the capabilities of the Process Spectroscopy Market. These advancements include the development of portable devices and improved software for data analysis, which facilitate on-site measurements and real-time monitoring. Such technologies are likely to increase the adoption of spectroscopy in various sectors, enabling more precise and efficient processes.

Regulatory Compliance

The increasing stringency of regulations in industries such as pharmaceuticals and food safety is driving the demand for reliable analytical techniques. The Process Spectroscopy Market is responding to this need by providing solutions that ensure compliance with quality standards. This trend suggests that organizations are prioritizing the integration of spectroscopy to meet regulatory requirements effectively.

Sustainability Initiatives

There is a growing focus on sustainability within the Process Spectroscopy Market, as companies seek to reduce their environmental impact. Spectroscopic methods can aid in monitoring and optimizing resource use, thereby supporting greener production practices. This trend indicates a shift towards more environmentally conscious operations, aligning with global sustainability goals.

Process Spectroscopy Market Market Drivers

Growing Focus on Quality Assurance

Quality assurance remains a critical driver in the Process Spectroscopy Market, particularly in sectors such as pharmaceuticals, where product integrity is non-negotiable. The increasing complexity of products and regulatory requirements necessitates robust quality control measures. Process spectroscopy offers a non-destructive method for monitoring product quality in real-time, which is becoming essential for manufacturers. The market is expected to witness a surge in demand for spectroscopy solutions that facilitate compliance with international quality standards. This focus on quality assurance is projected to contribute to a market growth rate of approximately 10% annually, reflecting the industry's commitment to maintaining high standards.

Rising Demand for Real-Time Analysis

The Process Spectroscopy Market is experiencing a notable increase in demand for real-time analysis across various sectors, including pharmaceuticals and food and beverage. This trend is driven by the need for immediate data to ensure quality control and compliance with stringent regulations. As industries strive for efficiency, the ability to conduct in-line analysis without interrupting production processes becomes paramount. The market for process spectroscopy is projected to grow significantly, with estimates suggesting a compound annual growth rate of over 8% in the coming years. This growth is indicative of the industry's shift towards automation and real-time monitoring, which enhances operational efficiency and reduces waste.

Integration of Artificial Intelligence

The integration of artificial intelligence (AI) into the Process Spectroscopy Market is transforming how data is analyzed and interpreted. AI algorithms can process vast amounts of spectral data, identifying patterns and anomalies that may not be apparent to human analysts. This capability not only improves accuracy but also accelerates decision-making processes. As industries increasingly adopt AI technologies, the demand for advanced spectroscopy solutions is likely to rise. Market analysts project that the incorporation of AI could lead to a 15% increase in the efficiency of spectroscopic analysis, thereby driving further investment in this sector and enhancing the overall value proposition of the Process Spectroscopy Market.

Advancements in Spectroscopic Techniques

Recent advancements in spectroscopic techniques are significantly influencing the Process Spectroscopy Market. Innovations such as near-infrared (NIR) spectroscopy and Raman spectroscopy are enhancing the capabilities of process analysis. These techniques allow for more precise measurements and broader applications across various industries, including chemicals and materials science. The introduction of portable and user-friendly spectroscopic devices is also expanding the market reach, enabling smaller enterprises to adopt these technologies. Analysts predict that the ongoing development of new spectroscopic methods will drive market growth, with an anticipated increase in adoption rates by approximately 12% over the next few years.

Increased Investment in Research and Development

Investment in research and development (R&D) within the Process Spectroscopy Market is on the rise, as companies seek to innovate and improve their product offerings. This trend is particularly evident in sectors such as biotechnology and environmental monitoring, where advanced spectroscopic techniques can lead to breakthroughs in analysis and application. Enhanced R&D efforts are likely to result in the development of more sophisticated instruments and software solutions, catering to the evolving needs of various industries. Market forecasts indicate that R&D investments could lead to a 20% increase in new product launches, thereby stimulating competition and driving overall market growth.

Market Segment Insights

By Technology: NIR (Largest) vs. FT-IR (Fastest-Growing)

<p>The Process Spectroscopy Market showcases a diverse technological landscape, with Near-Infrared (NIR) spectroscopy leading in market share due to its widespread application in industries such as food and pharmaceuticals. NIR systems benefit from their non-destructive nature and rapid analysis capabilities, securing a substantial portion of market adoption. Meanwhile, Fourier Transform Infrared (FT-IR) spectroscopy is experiencing tremendous growth, driven by advancements in technology that enhance sensitivity and precision, appealing particularly to chemical and material sectors.</p>

<p>Technology: NIR (Dominant) vs. FT-IR (Emerging)</p>

<p>NIR spectroscopy stands out as the dominant technology within the Process Spectroscopy Market, leveraging its ability to provide quick and reliable analyses for a variety of applications. This technology is preferred for its efficiency in quality control and process monitoring, especially in food and beverage production. On the other hand, FT-IR is emerging rapidly, as it offers more detailed molecular information, allowing for complex sample analyses. The growing adoption in pharmaceutical applications showcases its versatility and increasing acceptance, positioning FT-IR as a vital tool for future research and development.</p>

By End-use: Pharmaceuticals (Largest) vs. Oil and Gas (Fastest-Growing)

<p>The Process Spectroscopy Market showcases a diverse range of end-use applications, with the Pharmaceuticals sector commanding the largest share. This segment benefits from stringent quality control requirements and advancements in drug development, driving its substantial market representation. Following closely, the Oil and Gas sector emerges as a significant player, renowned for its critical need for real-time analysis and monitoring, enhancing safety protocols and operational efficiencies.</p>

<p>Pharmaceuticals (Dominant) vs. Oil and Gas (Emerging)</p>

<p>The Pharmaceuticals segment stands out as a dominant force in the Process Spectroscopy Market due to its reliance on precise analytical methods for drug formulation, quality assurance, and regulatory compliance. The drive for efficiency and accuracy in pharmaceutical processes has led to increased adoption of spectroscopy technologies. Conversely, the Oil and Gas sector is recognized as an emerging market segment, experiencing rapid growth due to the need for enhanced exploration and production techniques. The adoption of advanced spectroscopy methods supports exploration and refining processes, ensuring compliance with environmental standards while optimizing operational efficiency.</p>

Get more detailed insights about Process Spectroscopy Market Research Report—Global Forecast till 2035

Regional Insights

North America : Innovation and Market Leadership

North America is the largest market for process spectroscopy, holding approximately 45% of the global share. The region's growth is driven by advancements in technology, increasing demand for quality control in manufacturing, and stringent regulatory standards. The presence of major players like Thermo Fisher Scientific and Agilent Technologies further fuels market expansion, supported by government initiatives promoting innovation in analytical technologies. The United States leads the North American market, followed by Canada, which is witnessing a rise in adoption of spectroscopy solutions across various industries, including pharmaceuticals and food safety. The competitive landscape is characterized by significant investments in R&D and collaborations among key players, ensuring a robust supply chain and innovative product offerings. Companies are focusing on enhancing their product portfolios to meet the evolving needs of end-users.

Europe : Regulatory Framework and Growth

Europe is the second-largest market for process spectroscopy, accounting for around 30% of the global market share. The region's growth is propelled by stringent regulations regarding product quality and safety, particularly in the pharmaceutical and food industries. The European Union's commitment to innovation and sustainability also acts as a catalyst for market expansion, encouraging the adoption of advanced analytical techniques. Germany and the United Kingdom are the leading countries in this market, with a strong presence of key players such as Siemens and Bruker Corporation. The competitive landscape is marked by a focus on technological advancements and strategic partnerships among companies to enhance their market position. The region is also witnessing an increase in demand for portable and user-friendly spectroscopy solutions, driven by the need for on-site analysis in various applications.

Asia-Pacific : Rapid Growth and Adoption

Asia-Pacific is witnessing rapid growth in the process spectroscopy market, holding approximately 20% of the global share. The region's expansion is driven by increasing industrialization, rising investments in research and development, and a growing emphasis on quality control across various sectors. Countries like China and India are at the forefront, with significant government initiatives aimed at enhancing manufacturing capabilities and technological advancements. China is the largest market in the region, followed by Japan and India, where the presence of key players like Horiba and Yokogawa Electric is notable. The competitive landscape is evolving, with local companies emerging alongside established global players, fostering innovation and affordability in spectroscopy solutions. The increasing demand for environmental monitoring and safety regulations is further propelling market growth in this dynamic region.

Middle East and Africa : Emerging Opportunities and Challenges

The Middle East and Africa region is gradually emerging in the process spectroscopy market, holding about 5% of the global share. The growth is primarily driven by increasing investments in the oil and gas sector, along with a rising focus on quality assurance in manufacturing processes. Regulatory frameworks are evolving, encouraging the adoption of advanced analytical technologies to meet international standards and improve operational efficiency. Countries like South Africa and the UAE are leading the market, with a growing presence of international players and local companies. The competitive landscape is characterized by partnerships and collaborations aimed at enhancing technological capabilities. However, challenges such as limited infrastructure and varying regulatory environments may hinder rapid growth, necessitating strategic investments and innovations to overcome these barriers.

Key Players and Competitive Insights

The Process Spectroscopy Market is currently characterized by a dynamic competitive landscape, driven by technological advancements and increasing demand for real-time analysis across various industries. Key players such as Thermo Fisher Scientific (US), Agilent Technologies (US), and Bruker Corporation (US) are strategically positioned to leverage innovation and expand their market presence. These companies focus on enhancing their product offerings through research and development, while also pursuing strategic partnerships to bolster their capabilities. The collective strategies of these firms contribute to a competitive environment that is increasingly focused on technological differentiation and customer-centric solutions.

In terms of business tactics, companies are increasingly localizing manufacturing and optimizing supply chains to enhance operational efficiency. The Process Spectroscopy Market appears moderately fragmented, with several key players exerting influence over specific segments. This fragmentation allows for niche players to thrive, while larger corporations capitalize on economies of scale and advanced technological capabilities. The interplay between these dynamics shapes a competitive structure that is both diverse and complex, fostering innovation and collaboration.

In August 2025, Thermo Fisher Scientific (US) announced the launch of a new line of portable spectrometers designed for field applications. This strategic move is significant as it addresses the growing need for on-site analysis in industries such as pharmaceuticals and environmental monitoring. By enhancing accessibility to advanced spectroscopy tools, Thermo Fisher aims to capture a larger share of the market, particularly among customers requiring immediate results in dynamic environments.

In September 2025, Agilent Technologies (US) unveiled a partnership with a leading AI firm to integrate artificial intelligence into their spectroscopy software. This collaboration is poised to revolutionize data analysis, enabling users to derive insights more efficiently and accurately. The integration of AI not only enhances Agilent's product offerings but also positions the company as a leader in the digital transformation of the spectroscopy market, potentially attracting a broader customer base.

In July 2025, Bruker Corporation (US) expanded its global footprint by acquiring a European-based spectroscopy company specializing in advanced materials analysis. This acquisition is strategically important as it allows Bruker to diversify its product portfolio and strengthen its position in the European market. By integrating the acquired company's technologies, Bruker is likely to enhance its competitive edge and offer more comprehensive solutions to its customers.

As of October 2025, the Process Spectroscopy Market is witnessing trends such as digitalization, sustainability, and the integration of artificial intelligence, which are reshaping competitive dynamics. Strategic alliances are becoming increasingly vital, as companies seek to combine strengths and innovate collaboratively. Looking ahead, it is anticipated that competitive differentiation will evolve, with a shift from price-based competition to a focus on innovation, technological advancements, and supply chain reliability. This evolution underscores the importance of adaptability and forward-thinking strategies in maintaining a competitive advantage.

Key Companies in the Process Spectroscopy Market market include

Industry Developments

April 2024: Shimadzu Corporation launched a gas chromatograph-mass spectrometer that selects elements called ELEM-SPOT. The first-of-its-kind system in the world is capable of detecting oxygen and nitrogen-containing compounds that affect biofuel quality from among many raw material ingredients. It was developed together with global energy company TotalEnergies, France’s University of Pau et Pays de l’Adour (UPPA), and the Spain-based University of Oviedo (UO). For instance, this machine can identify substances present in biofuel feedstocks that cause deterioration in production efficiency and quality. Users can easily find these compounds, measure them, and confirm whether they have been removed successfully or not.

In so doing, it will contribute to the establishment of analytical methods for biofuels, thereby accelerating the transition from fossil fuels.

July 2023: Technology Networks interviewed Steve Smith, vice president of discovery and development at Waters Corporation, during the American Society for Mass Spectrometry Annual Conference (ASMS). Our discussion covered a range of topics, including different applications where this technology can be used, from spatial biology using mass spectrometry imaging (MSI) to solving bottlenecks encountered in biopharmaceutical development. He also talked about how sustainability remains a key priority for Waters whilst pushing limits on what is achievable by its clients.

During the 71st Annual Society for Mass Spectrometry (ASMS) meeting in June 2023, President of Life Sciences Mass Spectrometry at Bruker Daltonics, Rohan Thakur, introduced new product launches from Bruker and discussed applications of the company’s latest mass spectrometer times of Ultra for immunopeptidomics. Over the years, there has been an emphasis on making mass spectroscopy more sensitive, which is useful when studying low-abundant proteins in small amounts of samples. The Times of Ultra provides breakthrough single-cell analysis sensitivity, robustness, and high sequence coverage, allowing scientists to see more proteins and their associated pathways, according to Thakur.

Thermo Fisher Scientific Inc. has released a new Raman spectroscopic analyzer for process monitoring in various fields, such as biopharmaceutical manufacturing, according to an announcement made in April 2022. The Thermo Scientific Ramina Process Analyzer carries out non-destructive and continuous analysis without sample preparation needed; hence, rapid system setup takes only 15 minutes, and then, within seconds, spectral data on target analytes are generated. This user-friendly system simplifies performing Raman spectroscopy measurements, thus making it possible even at the beginner level while maintaining high precision as well as accuracy.

The compact size allows fast results using patented probes, thus enabling fully automated in situ measurements for concentration calculation in a reaction vessel.

June 2022: The triple quadrupole mass spectrometer DART-EVOQ was unveiled by Bruker Corporation. The product is employed in quantitative analysis with high throughput. Additionally, the DART-EVOQ mass spectrometer's debut is to provide applicable markets with a workflow that is straightforward, reliable, sensitive, and targeted.

April 2022: The new Xevo G3 quadrupole time-of-flight (QTof) mass spectrometer, CONFIRM Sequence, and Multi-reflection time-of-flight (MRT) mass spectrometer are all offered by Waters Corporation. In applications including biotherapeutics, forensics, metabolite identification, metabolomics, extractables and leachables, the novel solutions are designed to measure thermally fragile compounds.

.webp

Future Outlook

Process Spectroscopy Market Future Outlook

<p>The Process Spectroscopy Market is projected to grow at a 7.5% CAGR from 2024 to 2035, driven by advancements in technology, increasing demand for quality control, and regulatory compliance.</p>

New opportunities lie in:

  • <p>Integration of AI-driven analytics for real-time process optimization.</p>
  • <p>Development of portable spectroscopy devices for field applications.</p>
  • <p>Expansion into emerging markets with tailored solutions for local industries.</p>

<p>By 2035, the Process Spectroscopy Market is expected to be robust, driven by innovation and strategic expansion.</p>

Market Segmentation

Process Spectroscopy Market End-use Outlook

  • Polymer
  • Oil and Gas
  • Pharmaceuticals
  • Food and Agriculture
  • Chemical
  • Others

Process Spectroscopy Market Technology Outlook

  • NIR
  • FT-IR
  • Raman

Report Scope

MARKET SIZE 202423.22(USD Billion)
MARKET SIZE 202524.96(USD Billion)
MARKET SIZE 203551.46(USD Billion)
COMPOUND ANNUAL GROWTH RATE (CAGR)7.5% (2024 - 2035)
REPORT COVERAGERevenue Forecast, Competitive Landscape, Growth Factors, and Trends
BASE YEAR2024
Market Forecast Period2025 - 2035
Historical Data2019 - 2024
Market Forecast UnitsUSD Billion
Key Companies ProfiledMarket analysis in progress
Segments CoveredMarket segmentation analysis in progress
Key Market OpportunitiesIntegration of artificial intelligence in Process Spectroscopy Market enhances real-time analysis and decision-making capabilities.
Key Market DynamicsTechnological advancements drive competitive forces, enhancing efficiency and accuracy in the Process Spectroscopy Market.
Countries CoveredNorth America, Europe, APAC, South America, MEA

FAQs

What is the projected market valuation of the Process Spectroscopy Market by 2035?

The Process Spectroscopy Market is projected to reach a valuation of 51.46 USD Billion by 2035.

What was the overall market valuation of the Process Spectroscopy Market in 2024?

In 2024, the overall market valuation of the Process Spectroscopy Market was 23.22 USD Billion.

What is the expected CAGR for the Process Spectroscopy Market during the forecast period 2025 - 2035?

The expected CAGR for the Process Spectroscopy Market during the forecast period 2025 - 2035 is 7.5%.

Which technology segments are included in the Process Spectroscopy Market?

The technology segments in the Process Spectroscopy Market include NIR, FT-IR, and Raman.

What are the projected valuations for the NIR technology segment by 2035?

The NIR technology segment is projected to grow from 8.0 USD Billion to 18.0 USD Billion by 2035.

How does the pharmaceutical sector contribute to the Process Spectroscopy Market?

The pharmaceutical sector is expected to grow from 5.0 USD Billion to 12.0 USD Billion by 2035, indicating its significant contribution.

  1. SECTION I: EXECUTIVE SUMMARY AND KEY HIGHLIGHTS
    1. EXECUTIVE SUMMARY
      1. Market Overview
      2. Key Findings
      3. Market Segmentation
      4. Competitive Landscape
      5. Challenges and Opportunities
      6. Future Outlook
  2. SECTION II: SCOPING, METHODOLOGY AND MARKET STRUCTURE
    1. MARKET INTRODUCTION
      1. Definition
      2. Scope of the study
    2. RESEARCH METHODOLOGY
      1. Overview
      2. Data Mining
      3. Secondary Research
      4. Primary Research
      5. Forecasting Model
      6. Market Size Estimation
      7. Data Triangulation
      8. Validation
  3. SECTION III: QUALITATIVE ANALYSIS
    1. MARKET DYNAMICS
      1. Overview
      2. Drivers
      3. Restraints
      4. Opportunities
    2. MARKET FACTOR ANALYSIS
      1. Value chain Analysis
      2. Porter's Five Forces Analysis
      3. COVID-19 Impact Analysis
  4. SECTION IV: QUANTITATIVE ANALYSIS
    1. Semiconductor & Electronics, BY Technology (USD Billion)
      1. NIR
      2. FT-IR
      3. Raman
    2. Semiconductor & Electronics, BY End-use (USD Billion)
      1. Polymer
      2. Oil and Gas
      3. Pharmaceuticals
      4. Food and Agriculture
      5. Chemical
      6. Others
    3. Semiconductor & Electronics, BY Region (USD Billion)
      1. North America
      2. Europe
      3. APAC
      4. South America
      5. MEA
  5. SECTION V: COMPETITIVE ANALYSIS
    1. Competitive Landscape
      1. Overview
      2. Competitive Analysis
      3. Market share Analysis
      4. Major Growth Strategy in the Semiconductor & Electronics
      5. Competitive Benchmarking
      6. Leading Players in Terms of Number of Developments in the Semiconductor & Electronics
      7. Key developments and growth strategies
      8. Major Players Financial Matrix
    2. Company Profiles
      1. Thermo Fisher Scientific (US)
      2. Agilent Technologies (US)
      3. PerkinElmer (US)
      4. Bruker Corporation (US)
      5. Horiba (JP)
      6. ABB (CH)
      7. Siemens (DE)
      8. Kett Electric (JP)
      9. Yokogawa Electric (JP)
    3. Appendix
      1. References
      2. Related Reports
  6. LIST OF FIGURES
    1. MARKET SYNOPSIS
    2. NORTH AMERICA MARKET ANALYSIS
    3. US MARKET ANALYSIS BY TECHNOLOGY
    4. US MARKET ANALYSIS BY END-USE
    5. CANADA MARKET ANALYSIS BY TECHNOLOGY
    6. CANADA MARKET ANALYSIS BY END-USE
    7. EUROPE MARKET ANALYSIS
    8. GERMANY MARKET ANALYSIS BY TECHNOLOGY
    9. GERMANY MARKET ANALYSIS BY END-USE
    10. UK MARKET ANALYSIS BY TECHNOLOGY
    11. UK MARKET ANALYSIS BY END-USE
    12. FRANCE MARKET ANALYSIS BY TECHNOLOGY
    13. FRANCE MARKET ANALYSIS BY END-USE
    14. RUSSIA MARKET ANALYSIS BY TECHNOLOGY
    15. RUSSIA MARKET ANALYSIS BY END-USE
    16. ITALY MARKET ANALYSIS BY TECHNOLOGY
    17. ITALY MARKET ANALYSIS BY END-USE
    18. SPAIN MARKET ANALYSIS BY TECHNOLOGY
    19. SPAIN MARKET ANALYSIS BY END-USE
    20. REST OF EUROPE MARKET ANALYSIS BY TECHNOLOGY
    21. REST OF EUROPE MARKET ANALYSIS BY END-USE
    22. APAC MARKET ANALYSIS
    23. CHINA MARKET ANALYSIS BY TECHNOLOGY
    24. CHINA MARKET ANALYSIS BY END-USE
    25. INDIA MARKET ANALYSIS BY TECHNOLOGY
    26. INDIA MARKET ANALYSIS BY END-USE
    27. JAPAN MARKET ANALYSIS BY TECHNOLOGY
    28. JAPAN MARKET ANALYSIS BY END-USE
    29. SOUTH KOREA MARKET ANALYSIS BY TECHNOLOGY
    30. SOUTH KOREA MARKET ANALYSIS BY END-USE
    31. MALAYSIA MARKET ANALYSIS BY TECHNOLOGY
    32. MALAYSIA MARKET ANALYSIS BY END-USE
    33. THAILAND MARKET ANALYSIS BY TECHNOLOGY
    34. THAILAND MARKET ANALYSIS BY END-USE
    35. INDONESIA MARKET ANALYSIS BY TECHNOLOGY
    36. INDONESIA MARKET ANALYSIS BY END-USE
    37. REST OF APAC MARKET ANALYSIS BY TECHNOLOGY
    38. REST OF APAC MARKET ANALYSIS BY END-USE
    39. SOUTH AMERICA MARKET ANALYSIS
    40. BRAZIL MARKET ANALYSIS BY TECHNOLOGY
    41. BRAZIL MARKET ANALYSIS BY END-USE
    42. MEXICO MARKET ANALYSIS BY TECHNOLOGY
    43. MEXICO MARKET ANALYSIS BY END-USE
    44. ARGENTINA MARKET ANALYSIS BY TECHNOLOGY
    45. ARGENTINA MARKET ANALYSIS BY END-USE
    46. REST OF SOUTH AMERICA MARKET ANALYSIS BY TECHNOLOGY
    47. REST OF SOUTH AMERICA MARKET ANALYSIS BY END-USE
    48. MEA MARKET ANALYSIS
    49. GCC COUNTRIES MARKET ANALYSIS BY TECHNOLOGY
    50. GCC COUNTRIES MARKET ANALYSIS BY END-USE
    51. SOUTH AFRICA MARKET ANALYSIS BY TECHNOLOGY
    52. SOUTH AFRICA MARKET ANALYSIS BY END-USE
    53. REST OF MEA MARKET ANALYSIS BY TECHNOLOGY
    54. REST OF MEA MARKET ANALYSIS BY END-USE
    55. KEY BUYING CRITERIA OF SEMICONDUCTOR & ELECTRONICS
    56. RESEARCH PROCESS OF MRFR
    57. DRO ANALYSIS OF SEMICONDUCTOR & ELECTRONICS
    58. DRIVERS IMPACT ANALYSIS: SEMICONDUCTOR & ELECTRONICS
    59. RESTRAINTS IMPACT ANALYSIS: SEMICONDUCTOR & ELECTRONICS
    60. SUPPLY / VALUE CHAIN: SEMICONDUCTOR & ELECTRONICS
    61. SEMICONDUCTOR & ELECTRONICS, BY TECHNOLOGY, 2024 (% SHARE)
    62. SEMICONDUCTOR & ELECTRONICS, BY TECHNOLOGY, 2024 TO 2035 (USD Billion)
    63. SEMICONDUCTOR & ELECTRONICS, BY END-USE, 2024 (% SHARE)
    64. SEMICONDUCTOR & ELECTRONICS, BY END-USE, 2024 TO 2035 (USD Billion)
    65. BENCHMARKING OF MAJOR COMPETITORS
  7. LIST OF TABLES
    1. LIST OF ASSUMPTIONS
    2. North America MARKET SIZE ESTIMATES; FORECAST
      1. BY TECHNOLOGY, 2025-2035 (USD Billion)
      2. BY END-USE, 2025-2035 (USD Billion)
    3. US MARKET SIZE ESTIMATES; FORECAST
      1. BY TECHNOLOGY, 2025-2035 (USD Billion)
      2. BY END-USE, 2025-2035 (USD Billion)
    4. Canada MARKET SIZE ESTIMATES; FORECAST
      1. BY TECHNOLOGY, 2025-2035 (USD Billion)
      2. BY END-USE, 2025-2035 (USD Billion)
    5. Europe MARKET SIZE ESTIMATES; FORECAST
      1. BY TECHNOLOGY, 2025-2035 (USD Billion)
      2. BY END-USE, 2025-2035 (USD Billion)
    6. Germany MARKET SIZE ESTIMATES; FORECAST
      1. BY TECHNOLOGY, 2025-2035 (USD Billion)
      2. BY END-USE, 2025-2035 (USD Billion)
    7. UK MARKET SIZE ESTIMATES; FORECAST
      1. BY TECHNOLOGY, 2025-2035 (USD Billion)
      2. BY END-USE, 2025-2035 (USD Billion)
    8. France MARKET SIZE ESTIMATES; FORECAST
      1. BY TECHNOLOGY, 2025-2035 (USD Billion)
      2. BY END-USE, 2025-2035 (USD Billion)
    9. Russia MARKET SIZE ESTIMATES; FORECAST
      1. BY TECHNOLOGY, 2025-2035 (USD Billion)
      2. BY END-USE, 2025-2035 (USD Billion)
    10. Italy MARKET SIZE ESTIMATES; FORECAST
      1. BY TECHNOLOGY, 2025-2035 (USD Billion)
      2. BY END-USE, 2025-2035 (USD Billion)
    11. Spain MARKET SIZE ESTIMATES; FORECAST
      1. BY TECHNOLOGY, 2025-2035 (USD Billion)
      2. BY END-USE, 2025-2035 (USD Billion)
    12. Rest of Europe MARKET SIZE ESTIMATES; FORECAST
      1. BY TECHNOLOGY, 2025-2035 (USD Billion)
      2. BY END-USE, 2025-2035 (USD Billion)
    13. APAC MARKET SIZE ESTIMATES; FORECAST
      1. BY TECHNOLOGY, 2025-2035 (USD Billion)
      2. BY END-USE, 2025-2035 (USD Billion)
    14. China MARKET SIZE ESTIMATES; FORECAST
      1. BY TECHNOLOGY, 2025-2035 (USD Billion)
      2. BY END-USE, 2025-2035 (USD Billion)
    15. India MARKET SIZE ESTIMATES; FORECAST
      1. BY TECHNOLOGY, 2025-2035 (USD Billion)
      2. BY END-USE, 2025-2035 (USD Billion)
    16. Japan MARKET SIZE ESTIMATES; FORECAST
      1. BY TECHNOLOGY, 2025-2035 (USD Billion)
      2. BY END-USE, 2025-2035 (USD Billion)
    17. South Korea MARKET SIZE ESTIMATES; FORECAST
      1. BY TECHNOLOGY, 2025-2035 (USD Billion)
      2. BY END-USE, 2025-2035 (USD Billion)
    18. Malaysia MARKET SIZE ESTIMATES; FORECAST
      1. BY TECHNOLOGY, 2025-2035 (USD Billion)
      2. BY END-USE, 2025-2035 (USD Billion)
    19. Thailand MARKET SIZE ESTIMATES; FORECAST
      1. BY TECHNOLOGY, 2025-2035 (USD Billion)
      2. BY END-USE, 2025-2035 (USD Billion)
    20. Indonesia MARKET SIZE ESTIMATES; FORECAST
      1. BY TECHNOLOGY, 2025-2035 (USD Billion)
      2. BY END-USE, 2025-2035 (USD Billion)
    21. Rest of APAC MARKET SIZE ESTIMATES; FORECAST
      1. BY TECHNOLOGY, 2025-2035 (USD Billion)
      2. BY END-USE, 2025-2035 (USD Billion)
    22. South America MARKET SIZE ESTIMATES; FORECAST
      1. BY TECHNOLOGY, 2025-2035 (USD Billion)
      2. BY END-USE, 2025-2035 (USD Billion)
    23. Brazil MARKET SIZE ESTIMATES; FORECAST
      1. BY TECHNOLOGY, 2025-2035 (USD Billion)
      2. BY END-USE, 2025-2035 (USD Billion)
    24. Mexico MARKET SIZE ESTIMATES; FORECAST
      1. BY TECHNOLOGY, 2025-2035 (USD Billion)
      2. BY END-USE, 2025-2035 (USD Billion)
    25. Argentina MARKET SIZE ESTIMATES; FORECAST
      1. BY TECHNOLOGY, 2025-2035 (USD Billion)
      2. BY END-USE, 2025-2035 (USD Billion)
    26. Rest of South America MARKET SIZE ESTIMATES; FORECAST
      1. BY TECHNOLOGY, 2025-2035 (USD Billion)
      2. BY END-USE, 2025-2035 (USD Billion)
    27. MEA MARKET SIZE ESTIMATES; FORECAST
      1. BY TECHNOLOGY, 2025-2035 (USD Billion)
      2. BY END-USE, 2025-2035 (USD Billion)
    28. GCC Countries MARKET SIZE ESTIMATES; FORECAST
      1. BY TECHNOLOGY, 2025-2035 (USD Billion)
      2. BY END-USE, 2025-2035 (USD Billion)
    29. South Africa MARKET SIZE ESTIMATES; FORECAST
      1. BY TECHNOLOGY, 2025-2035 (USD Billion)
      2. BY END-USE, 2025-2035 (USD Billion)
    30. Rest of MEA MARKET SIZE ESTIMATES; FORECAST
      1. BY TECHNOLOGY, 2025-2035 (USD Billion)
      2. BY END-USE, 2025-2035 (USD Billion)
    31. PRODUCT LAUNCH/PRODUCT DEVELOPMENT/APPROVAL
    32. ACQUISITION/PARTNERSHIP

Process Spectroscopy Market Segmentation

Process Spectroscopy Technology Outlook (USD Billion, 2020-2034)

  • NIR
  • FT-IR
  • Raman

Process Spectroscopy End use Outlook (USD Billion, 2020-2034)

  • Oil and Gas
  • Pharmaceuticals
  • Food and Agriculture
  • Chemical
  • Others

Process Spectroscopy Regional Outlook (USD Billion, 2020-2034)

  • North America Outlook (USD Billion, 2020-2034)
    • North America Process Spectroscopy by Technology
      • NIR
      • FT-IR
      • Raman
    • North America Process Spectroscopy by End use
      • Oil and Gas
      • Pharmaceuticals
      • Food and Agriculture
      • Chemical
      • Others
    • US Outlook (USD Billion, 2020-2034)
    • US Process Spectroscopy by Technology
      • NIR
      • FT-IR
      • Raman
    • US Process Spectroscopy by End use
      • Oil and Gas
      • Pharmaceuticals
      • Food and Agriculture
      • Chemical
      • Others
    • CANADA Outlook (USD Billion, 2020-2034)
    • CANADA Process Spectroscopy by Technology
      • NIR
      • FT-IR
      • Raman
    • CANADA Process Spectroscopy by End use
      • Oil and Gas
      • Pharmaceuticals
      • Food and Agriculture
      • Chemical
      • Others
    • Europe Outlook (USD Billion, 2020-2034)
      • Europe Process Spectroscopy by Technology
        • NIR
        • FT-IR
        • Raman
      • Europe Process Spectroscopy by End use
        • Oil and Gas
        • Pharmaceuticals
        • Food and Agriculture
        • Chemical
        • Others
      • Germany Outlook (USD Billion, 2020-2034)
      • Germany Process Spectroscopy by Technology
        • NIR
        • FT-IR
        • Raman
      • Germany Process Spectroscopy by End use
        • Oil and Gas
        • Pharmaceuticals
        • Food and Agriculture
        • Chemical
        • Others
      • France Outlook (USD Billion, 2020-2034)
      • France Process Spectroscopy by Technology
        • NIR
        • FT-IR
        • Raman
      • France Process Spectroscopy by End use
        • Oil and Gas
        • Pharmaceuticals
        • Food and Agriculture
        • Chemical
        • Others
      • UK Outlook (USD Billion, 2020-2034)
      • UK Process Spectroscopy by Technology
        • NIR
        • FT-IR
        • Raman
      • UK Process Spectroscopy by End use
        • Oil and Gas
        • Pharmaceuticals
        • Food and Agriculture
        • Chemical
        • Others
      • ITALY Outlook (USD Billion, 2020-2034)
      • ITALY Process Spectroscopy by Technology
        • NIR
        • FT-IR
        • Raman
      • ITALY Process Spectroscopy by End use
        • Oil and Gas
        • Pharmaceuticals
        • Food and Agriculture
        • Chemical
        • Others
      • SPAIN Outlook (USD Billion, 2020-2034)
      • Spain Process Spectroscopy by Technology
        • NIR
        • FT-IR
        • Raman
      • Spain Process Spectroscopy by End use
        • Oil and Gas
        • Pharmaceuticals
        • Food and Agriculture
        • Chemical
        • Others
      • Rest Of Europe Outlook (USD Billion, 2020-2034)
      • Rest Of Europe Process Spectroscopy by Technology
        • NIR
        • FT-IR
        • Raman
      • REST OF EUROPE Process Spectroscopy by End use
        • Oil and Gas
        • Pharmaceuticals
        • Food and Agriculture
        • Chemical
        • Others
      • Asia-Pacific Outlook (USD Billion, 2020-2034)
        • Asia-Pacific Process Spectroscopy by Technology
          • NIR
          • FT-IR
          • Raman
        • Asia-Pacific Process Spectroscopy by End use
          • Oil and Gas
          • Pharmaceuticals
          • Food and Agriculture
          • Chemical
          • Others
        • China Outlook (USD Billion, 2020-2034)
        • China Process Spectroscopy by Technology
          • NIR
          • FT-IR
          • Raman
        • China Process Spectroscopy by End use
          • Oil and Gas
          • Pharmaceuticals
          • Food and Agriculture
          • Chemical
          • Others
        • Japan Outlook (USD Billion, 2020-2034)
        • Japan Process Spectroscopy by Technology
          • NIR
          • FT-IR
          • Raman
        • Japan Process Spectroscopy by End use
          • Oil and Gas
          • Pharmaceuticals
          • Food and Agriculture
          • Chemical
          • Others
        • India Outlook (USD Billion, 2020-2034)
        • India Process Spectroscopy by Technology
          • NIR
          • FT-IR
          • Raman
        • India Process Spectroscopy by End use
          • Oil and Gas
          • Pharmaceuticals
          • Food and Agriculture
          • Chemical
          • Others
        • Australia Outlook (USD Billion, 2020-2034)
        • Australia Process Spectroscopy by Technology
          • NIR
          • FT-IR
          • Raman
        • Australia Process Spectroscopy by End use
          • Oil and Gas
          • Pharmaceuticals
          • Food and Agriculture
          • Chemical
          • Others
        • Rest of Asia-Pacific Outlook (USD Billion, 2020-2034)
        • Rest of Asia-Pacific Process Spectroscopy by Technology
          • NIR
          • FT-IR
          • Raman
        • Rest of Asia-Pacific Process Spectroscopy by End use
          • Oil and Gas
          • Pharmaceuticals
          • Food and Agriculture
          • Chemical
          • Others
        • Rest of the World Outlook (USD Billion, 2020-2034)
          • Rest of the World Process Spectroscopy by Technology
            • NIR
            • FT-IR
            • Raman
          • Rest of the World Process Spectroscopy by End use
            • Oil and Gas
            • Pharmaceuticals
            • Food and Agriculture
            • Chemical
            • Others
          • Middle East Outlook (USD Billion, 2020-2034)
          • Middle East Process Spectroscopy by Technology
            • NIR
            • FT-IR
            • Raman
          • Middle East Process Spectroscopy by End use
            • Oil and Gas
            • Pharmaceuticals
            • Food and Agriculture
            • Chemical
            • Others
          • Africa Outlook (USD Billion, 2020-2034)
          • Africa Process Spectroscopy by Technology
            • NIR
            • FT-IR
            • Raman
          • Africa Process Spectroscopy by End use
            • Oil and Gas
            • Pharmaceuticals
            • Food and Agriculture
            • Chemical
            • Others
          • Latin America Outlook (USD Billion, 2020-2034)
          • Latin America Process Spectroscopy by Technology
            • NIR
            • FT-IR
            • Raman
          • Latin America Process Spectroscopy by End use
            • Oil and Gas
            • Pharmaceuticals
            • Food and Agriculture
            • Chemical
            • Others
Infographic

Free Sample Request

Kindly complete the form below to receive a free sample of this Report

Get Free Sample

Customer Strories

“I am very pleased with how market segments have been defined in a relevant way for my purposes (such as "Portable Freezers & refrigerators" and "last-mile"). In general the report is well structured. Thanks very much for your efforts.”

Victoria Milne

Founder

Compare Licence

×
Features License Type
Single User Multiuser License Enterprise User
Price $4,950 $5,950 $7,250
Maximum User Access Limit 1 User Upto 10 Users Unrestricted Access Throughout the Organization
Free Customization
Direct Access to Analyst
Deliverable Format
Platform Access
Discount on Next Purchase 10% 15% 15%
Printable Versions