• Cat-intel
  • MedIntelliX
  • Resources
  • About Us
  • Hero Background
    English
    Chinese
    French
    Japanese
    Korean
    German
    Spanish

    Process Spectroscopy Market Share

    ID: MRFR/SEM/10814-HCR
    128 Pages
    Aarti Dhapte
    October 2025

    Process Spectroscopy Market Research Report Information By Technology (NIR, FT-IR, and Raman), By End-use (Polymer, Oil and Gas, Pharmaceuticals, Food, and Agriculture, Chemical, and Others), And By Region (North America, Europe, Asia-Pacific, And Rest Of The World) –Industry Size, Share and Forecast Till 2035

    Share:
    Download PDF ×

    We do not share your information with anyone. However, we may send you emails based on your report interest from time to time. You may contact us at any time to opt-out.

    Process Spectroscopy Market Infographic
    $ 4,950.0
    $ 5,950.0
    $ 7,250.0

    Market Share

    Process Spectroscopy Market Share Analysis

    In the highly competitive arena of the Process Spectroscopy Market, effective market share positioning strategies are crucial for companies aiming to carve out a niche and thrive in this dynamic landscape. One key strategy employed by market players is differentiation through technological innovation. Companies invest heavily in research and development to enhance the capabilities of their process spectroscopy solutions, introducing features that set them apart from competitors. This differentiation not only attracts new customers seeking advanced functionalities but also helps in retaining existing clients by offering superior performance. Another pivotal strategy revolves around strategic partnerships and collaborations. Many companies in the Process Spectroscopy Market opt for alliances with complementary technology providers or industry players. Such partnerships enable the creation of integrated solutions that address the diverse needs of customers. For instance, collaborations between spectroscopy solution providers and data analytics firms result in comprehensive offerings that provide not only real-time monitoring but also sophisticated data analysis capabilities. By aligning with strategic partners, companies can broaden their product portfolios and strengthen their market position. Furthermore, a focus on customer-centric strategies plays a significant role in market share positioning. Understanding the unique requirements of different industries and tailoring spectroscopy solutions to meet those needs is a key aspect. Offering customizable solutions that can seamlessly integrate into existing processes provides a competitive edge. Additionally, companies that excel in customer support, training, and after-sales services enhance their reputation and foster long-term relationships, leading to customer loyalty and positive word-of-mouth in the market. Market players also leverage pricing strategies to influence their market share positioning. Some companies opt for a cost leadership approach, offering competitive pricing to appeal to price-sensitive customers. Others focus on premium pricing, emphasizing the superior features and benefits of their advanced spectroscopy solutions. Striking the right balance between pricing and perceived value is crucial for success in the market. This involves a nuanced understanding of customer preferences, industry trends, and the competitive landscape. Geographical expansion is another strategy employed by companies aiming to bolster their market share. Identifying and entering untapped markets, especially in emerging economies, allows companies to tap into new customer bases and diversify their revenue streams. Adapting solutions to meet the specific needs of different regions is essential for successful expansion. Companies need to navigate regulatory environments, cultural nuances, and local preferences to effectively establish their presence and gain a competitive advantage in diverse markets. Moreover, continuous efforts in marketing and brand building contribute significantly to market share positioning. Establishing a strong brand presence through targeted marketing campaigns, participation in industry events, and thought leadership initiatives enhances a company's visibility and credibility in the market. A positive brand image not only attracts new customers but also instills confidence in existing ones.

    Market Summary

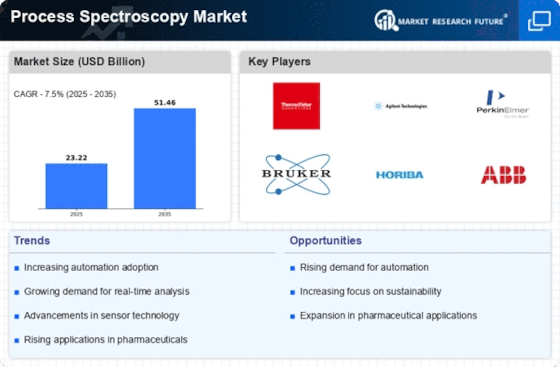
    The Global Process Spectroscopy Market is projected to grow from 23.22 USD Billion in 2024 to 51.46 USD Billion by 2035.

    Key Market Trends & Highlights

    Process Spectroscopy Key Trends and Highlights

    • The market is expected to experience a compound annual growth rate (CAGR) of 7.5 percent from 2025 to 2035.
    • By 2035, the market valuation is anticipated to reach 51.5 USD Billion, indicating robust growth potential.
    • in 2024, the market is valued at 23.22 USD Billion, reflecting a strong foundation for future expansion.
    • Growing adoption of process spectroscopy due to increasing demand for real-time analysis is a major market driver.

    Market Size & Forecast

    2024 Market Size 23.22 (USD Billion)
    2035 Market Size 51.46 (USD Billion)
    CAGR (2025-2035) 7.50%
    Largest Regional Market Share in 2024 latin_america)

    Major Players

    ABB Ltd., Shimadzu Corporation, Agilent Technologies, Inc., Sartorius AG, Bruker Corporation, Kett Electric Laboratory, Buchi Labortechnik AG, Horiba Limited, Danaher Corporation, Foss A/S

    Market Trends

    Growing technological advancements are driving the market growth

    Process spectroscopy is a real-time technology that analyzes the properties of materials and chemical compounds. It is undergoing numerous noteworthy trends. First, there is a growing trend toward the integration of machine learning and artificial intelligence (AI) with process spectroscopic systems. These innovations facilitate more rapid and precise decision-making across a range of industries by improving the analysis and interpretation of complicated data derived from spectroscopic observations. AI-driven models can improve productivity and product quality by identifying anomalies, optimizing processes, and predicting outcomes, in turn surging the market CAGR.

    Similarly, there's an increasing movement in spectroscopic equipment miniaturization and portability. Compact, portable spectrometers that are simple to use in the field or on the production floor are being developed by manufacturers. These movable gadgets offer real-time analysis, which facilitates speedier decision-making and boosts output. This trend is especially helpful to the pharmaceutical, agricultural, and environmental monitoring industries since it enables on-site analysis and prompt action based on the findings.

    The Global Process Spectroscopy Market is poised for expansion as industries increasingly adopt advanced analytical techniques to enhance quality control and process efficiency.

    U.S. Department of Commerce

    Process Spectroscopy Market Market Drivers

    Rising Demand for Real-Time Analysis

    The Global Process Spectroscopy Market Industry experiences a notable surge in demand for real-time analysis across various sectors, including pharmaceuticals and food and beverage. This demand is driven by the need for immediate quality control and process optimization. For instance, industries are increasingly adopting spectroscopy techniques to monitor chemical compositions in real-time, ensuring compliance with safety regulations. As a result, the market is projected to reach 23.2 USD Billion in 2024, reflecting a growing reliance on advanced analytical methods to enhance operational efficiency and product quality.

    Market Segment Insights

    Process Spectroscopy Technology Insights

    The Process Spectroscopy Market segmentation, based on Technology, includes NIR, FT-IR, and Raman. The NIR category is the largest technology sector in the worldwide process spectroscopy industry. With its many uses, NIR spectroscopy provides a flexible and non-destructive analytical method that enables the quick and simultaneous study of different chemicals. Because it is non-invasive, the chemical, food, beverage, and pharmaceutical industries find it particularly appealing. These businesses can use it for raw material analysis, process optimization, and quality control.

    Improvements in data analysis and software capabilities, along with other advances in NIR technology, are driving the substantial expansion of this segment in the Process Spectroscopy Market and increasing its demand.

    Source: Secondary Research, Primary Research, MRFR Database and Analyst Review

    Process Spectroscopy End-use Insights

    The Process Spectroscopy Market segmentation, based on End-use, includes Polymer, Oil and Gas, Pharmaceuticals, Food and Agriculture, Chemical, and Others. The pharmaceutical category makes up the biggest portion of the Process Spectroscopy Market by end-use. Process spectroscopy is widely used in the pharmaceutical business for formulation analysis, process monitoring, and quality control. Spectroscopy's capacity to offer non-destructive, real-time examination of pharmaceutical substances greatly improves product quality and guarantees adherence to legal requirements.

    Additionally, the need for process spectroscopy is further driven by the growing emphasis on medication research and manufacturing efficiency, making the pharmaceutical segment the primary driver of the market's growth.

    Get more detailed insights about Process Spectroscopy Market Research Report—Global Forecast till 2034

    Regional Insights

    By region, the study provides market insights into North America, Europe, Asia-Pacific and the Rest of the World. The North American Process Spectroscopy market is the largest in 2022. Due to the adoption of advanced technologies, the strength of key market players, increased R&D activities, and a focus on improving manufacturing processes across industries, particularly chemicals and pharmaceuticals, North America has the largest market share in the Process Spectroscopy market. These factors have also driven regional growth.

    Further, the major countries studied in the market report are The US, Canada, Germany, France, the UK, Italy, Spain, China, Japan, India, Australia, South Korea, and Brazil.

    Figure 2: PROCESS SPECTROSCOPY MARKET SHARE BY REGION 2022 (USD Billion)

    PROCESS SPECTROSCOPY MARKET SHARE BY REGION 2022

    Source: Secondary Research, Primary Research, MRFR Database and Analyst Review

    Europe's Process Spectroscopy market is the second-largest market. Strong emphasis on R&D, a stable industrial base, the expanding pharmaceutical industry, and the growing use of process spectroscopy for improved quality monitoring and process optimization are all factors propelling growth and expanding the market in this area. Further, the Germany Process Spectroscopy market held the largest market share, and the UK Process Spectroscopy market was the fastest-growing market in the European region.

    The Asia-Pacific Process Spectroscopy Market is anticipated to expand at the fastest rate possible between 2023 and 2032. Due to growing industrial sectors, a greater emphasis on quality control, rising investments in the food and pharmaceutical industries, and an increasing uptake of cutting-edge analytical technologies, the demand for process spectroscopy solutions is propelling the growth of the regional market. As a result, the Asia-Pacific region is experiencing the fastest growth in the process spectroscopy market. Moreover, China’s Process Spectroscopy market held the largest market share, and the Indian Process Spectroscopy market was the fastest-growing market in the Asia-Pacific region.

    Key Players and Competitive Insights

    Leading market players in the highly competitive Process Spectroscopy Market are attempting to gain market share through partnerships, mergers, acquisitions, and product developments. Businesses concentrate on market developments such as technological innovation, diversifying their product lines, and creating easy-to-use, application-specific solutions. The competitive landscape is further characterized by investments in R&D for improved spectroscopic techniques, partnerships with end users, and strategic relationships with academic and research organizations in the Process Spectroscopy industry.

    Intense rivalry and the expansion and sustainability of the industry are fostered by the continued focus on snatching up expanding markets, making sure regulations are followed, and providing elite customer service in the Process Spectroscopy industry. Major players in the Process Spectroscopy market, including ABB Ltd., Shimadzu Corporation, Agilent Technologies, Inc., Sartorius AG, Bruker Corporation, Kett Electric Laboratory, Buchi Labortechnik AG, Horiba Limited, Danaher Corporation, and Foss A/S.

    ABB is a multinational technology corporation providing innovative solutions for automation, digitalization, robotics, and electrification in a range of sectors. ABB offers cutting-edge solutions in the field of Process Spectroscopy, such as the ABB AbilityTM Process Analytical Technology (PAT) for monitoring and analyzing processes in real time. They provide a variety of spectroscopic methods, such as Fourier Transform Infrared (FT-IR) and Near-Infrared (NIR) spectroscopy. Solutions from ABB are used in a wide range of industries, including mining, food, beverage, petrochemicals, and pharmaceuticals. Their products help enterprises improve quality, safety, and productivity by ensuring efficient, accurate, and fast process analysis.

    Agilent Technologies, Inc. is a well-known international business that supplies the analytical laboratory industry with a broad range of scientific instruments, software, services, and consumables. Agilent provides solutions in the field of Process Spectroscopy, such as the Agilent 4500 Series FTIR, which allows for precise and dependable infrared spectroscopy analysis in a range of applications. Their area of expertise is in Fourier Transform Infrared (FT-IR) spectroscopy technology, which enables accurate identification and study of chemical substances. The food, beverage, environmental, petrochemical, and materials industries all use these goods.

    Agilent's Process Spectroscopy solutions improve productivity and product integrity by supporting quality assurance, research, and process monitoring.

    Key Companies in the Process Spectroscopy Market market include

    Industry Developments

    April 2024: Shimadzu Corporation launched a gas chromatograph-mass spectrometer that selects elements called ELEM-SPOT. The first-of-its-kind system in the world is capable of detecting oxygen and nitrogen-containing compounds that affect biofuel quality from among many raw material ingredients. It was developed together with global energy company TotalEnergies, France’s University of Pau et Pays de l’Adour (UPPA), and the Spain-based University of Oviedo (UO). For instance, this machine can identify substances present in biofuel feedstocks that cause deterioration in production efficiency and quality. Users can easily find these compounds, measure them, and confirm whether they have been removed successfully or not.

    In so doing, it will contribute to the establishment of analytical methods for biofuels, thereby accelerating the transition from fossil fuels.

    July 2023: Technology Networks interviewed Steve Smith, vice president of discovery and development at Waters Corporation, during the American Society for Mass Spectrometry Annual Conference (ASMS). Our discussion covered a range of topics, including different applications where this technology can be used, from spatial biology using mass spectrometry imaging (MSI) to solving bottlenecks encountered in biopharmaceutical development. He also talked about how sustainability remains a key priority for Waters whilst pushing limits on what is achievable by its clients.

    During the 71st Annual Society for Mass Spectrometry (ASMS) meeting in June 2023, President of Life Sciences Mass Spectrometry at Bruker Daltonics, Rohan Thakur, introduced new product launches from Bruker and discussed applications of the company’s latest mass spectrometer times of Ultra for immunopeptidomics. Over the years, there has been an emphasis on making mass spectroscopy more sensitive, which is useful when studying low-abundant proteins in small amounts of samples. The Times of Ultra provides breakthrough single-cell analysis sensitivity, robustness, and high sequence coverage, allowing scientists to see more proteins and their associated pathways, according to Thakur.

    Thermo Fisher Scientific Inc. has released a new Raman spectroscopic analyzer for process monitoring in various fields, such as biopharmaceutical manufacturing, according to an announcement made in April 2022. The Thermo Scientific Ramina Process Analyzer carries out non-destructive and continuous analysis without sample preparation needed; hence, rapid system setup takes only 15 minutes, and then, within seconds, spectral data on target analytes are generated. This user-friendly system simplifies performing Raman spectroscopy measurements, thus making it possible even at the beginner level while maintaining high precision as well as accuracy.

    The compact size allows fast results using patented probes, thus enabling fully automated in situ measurements for concentration calculation in a reaction vessel.

    June 2022: The triple quadrupole mass spectrometer DART-EVOQ was unveiled by Bruker Corporation. The product is employed in quantitative analysis with high throughput. Additionally, the DART-EVOQ mass spectrometer's debut is to provide applicable markets with a workflow that is straightforward, reliable, sensitive, and targeted.

    April 2022: The new Xevo G3 quadrupole time-of-flight (QTof) mass spectrometer, CONFIRM Sequence, and Multi-reflection time-of-flight (MRT) mass spectrometer are all offered by Waters Corporation. In applications including biotherapeutics, forensics, metabolite identification, metabolomics, extractables and leachables, the novel solutions are designed to measure thermally fragile compounds.

    Future Outlook

    Process Spectroscopy Market Future Outlook

    The Global Process Spectroscopy Market is projected to grow at a 7.50% CAGR from 2025 to 2035, driven by advancements in analytical technologies and increasing demand for real-time monitoring.

    New opportunities lie in:

    • Develop AI-driven spectroscopy solutions for enhanced data analysis.
    • Expand applications in pharmaceuticals for quality control and compliance.
    • Leverage IoT integration for remote monitoring and predictive maintenance.

    By 2035, the market is expected to achieve substantial growth, reflecting its critical role in various industries.

    Market Segmentation

    Process Spectroscopy End-use Outlook

    • Polymer
    • Oil and Gas
    • Pharmaceuticals
    • Food and Agriculture
    • Chemical
    • Others

    Process Spectroscopy Regional Outlook

    North America
    • US
    • Canada

    Process Spectroscopy Technology Outlook

    • NIR
    • FT-IR
    • Raman

    Report Scope

    Report Attribute/Metric Details
    Market Size 2024 USD 23.22 Billion
    Market Size 2025 USD 24.96 Billion
    Market Size 2035 51.46 (Value (USD Billion))
    Compound Annual Growth Rate (CAGR) 7.50% (2025 - 2035)
    Base Year 2024
    Market Forecast Period 2025 - 2035
    Historical Data 2020- 2023
    Market Forecast Units Value (USD Billion)
    Report Coverage Revenue Forecast, Market Competitive Landscape, Growth Factors, and Trends
    Segments Covered Technology, End-Use, and Region
    Geographies Covered North America, Europe, Asia Pacific, and the Rest of the World
    Countries Covered The US, Canada, Germany, France, UK, Italy, Spain, China, Japan, India, Australia, South Korea, and Brazil
    Key Companies Profiled ABB Ltd., Shimadzu Corporation, Agilent Technologies, Inc., Sartorius AG, Bruker Corporation, Kett Electric Laboratory, Buchi Labortechnik AG, Horiba Limited, Danaher Corporation, and Foss A/S.
    Key Market Opportunities ·       Technology Advancements
    Key Market Dynamics ·       Continuous research and development ·       Customization and Integration

    Market Highlights

    Author

    Aarti Dhapte
    Team Lead - Research

    She holds an experience of about 6+ years in market research and business consulting, working under the spectrum of information communication technology, telecommunications and semiconductor domains. aarti conceptualizes and implements a scalable business strategy and provides strategic leadership to the clients. her expertise lies in market estimation, competitive intelligence, pipeline analysis, customer assessment, etc.

    Leave a Comment

    Latest Comments

    John Doe
    john@example.com

    This is a great article! Really helped me understand the topic better.

    Posted on July 23, 2025, 10:15 AM
    Jane Smith
    jane@domain.com

    Thanks for sharing this. I’ve bookmarked it for later reference.

    Posted on July 22, 2025, 7:45 PM

    FAQs

    How much is the Process Spectroscopy market?

    The Process Spectroscopy Market size was valued at USD 23.22 Billion in 2024.

    What is the growth rate of the Process Spectroscopy market?

    The global market is projected to grow at a CAGR of 7.5% during the forecast period, 2025-2034.

    Which region held the largest market share in the Process Spectroscopy market?

    North America had the largest share of the global market in 2022.

    Who are the key players in the Process Spectroscopy market?

    The key players in the market are ABB Ltd., Shimadzu Corporation, Agilent Technologies, Inc., Sartorius AG, Bruker Corporation, Kett Electric Laboratory, Buchi Labortechnik AG, Horiba Limited, Danaher Corporation, and Foss A/S.

    Which Technology led the Process Spectroscopy market?

    The HDPE category dominated the market in 2022.

    Which End use had the main market share in the Process Spectroscopy market?

    The hard hats had the major share in the global market in 2022.

    1. Table of Contents
    2. Executive Summary
    3. Market Introduction
      1. Definition
      2. Scope of the Study
        1. Research Objective
        2. Assumptions
        3. Limitations
    4. Research Methodology
      1. Overview
      2. Data Mining
      3. Secondary Research
      4. Primary Research
        1. Primary Interviews and Information Gathering Process
        2. Breakdown of Primary Respondents
      5. Forecasting Model
      6. Market Size Estimation
        1. Bottom-up Approach
        2. Top-Down Approach
      7. Data Triangulation
      8. Validation
    5. MARKET DYNAMICS
      1. Overview
      2. Drivers
      3. Restraints
      4. Opportunities
    6. MARKET FACTOR ANALYSIS
      1. Value Chain Analysis
      2. Porter’s Five Forces Analysis
        1. Bargaining Power of Suppliers
        2. Bargaining Power of Buyers
        3. Threat of New Entrants
        4. Threat of Substitutes
        5. Intensity of Rivalry
      3. COVID-19 Impact Analysis
        1. Market Impact Analysis
        2. Regional Impact
        3. Opportunity and Threat Analysis
    7. GLOBAL PROCESS SPECTROSCOPY MARKET, BY TECHNOLOGY
      1. Overview
      2. NIR
      3. FT-IR
      4. Raman
    8. GLOBAL PROCESS SPECTROSCOPY MARKET, BY END USE
      1. Overview
      2. Oil and Gas
      3. Pharmaceuticals
      4. Food and Agriculture
      5. Chemical
      6. Others
    9. GLOBAL PROCESS SPECTROSCOPY MARKET, BY REGION
      1. Overview
      2. North America
        1. US
        2. Canada
      3. Europe
        1. Germany
        2. France
        3. UK
        4. Italy
        5. Spain
        6. Rest of Europe
      4. Asia-Pacific
        1. China
        2. India
        3. Japan
        4. South Korea
        5. Australia
        6. Rest of Asia-Pacific
      5. Rest of the World
        1. Middle East
        2. Africa
        3. Latin America
    10. Competitive Landscape
      1. Overview
      2. Competitive Analysis
      3. Market Share Analysis
      4. Major Growth Strategy in the Global Process Spectroscopy Market,
      5. Competitive Benchmarking
      6. Leading Players in Terms of Number of Developments in the Global Process Spectroscopy Market,
      7. Key developments and Growth Strategies
        1. New End use Launch/Service Deployment
        2. Merger & Acquisitions
        3. Joint Ventures
      8. Major Players Financial Matrix
        1. Sales & Operating Income, 2024
        2. Major Players R&D Expenditure. 2024
    11. COMPANY PROFILES
      1. ABB Ltd.
        1. Company Overview
        2. Financial Overview
        3. End uses Offered
        4. Key Developments
        5. SWOT Analysis
        6. Key Strategies
      2. Shimadzu Corporation
        1. Company Overview
        2. Financial Overview
        3. End uses Offered
        4. Key Developments
        5. SWOT Analysis
        6. Key Strategies
      3. AGILENT TECHNOLOGIES, INC
        1. Company Overview
        2. Financial Overview
        3. End uses Offered
        4. Key Developments
        5. SWOT Analysis
        6. Key Strategies
      4. Sartorius AG
        1. Company Overview
        2. Financial Overview
        3. End uses Offered
        4. Key Developments
        5. SWOT Analysis
        6. Key Strategies
      5. Bruker Corporation
        1. Company Overview
        2. Financial Overview
        3. End uses Offered
        4. Key Developments
        5. SWOT Analysis
        6. Key Strategies
      6. Kett Electric Laboratory
        1. Company Overview
        2. Financial Overview
        3. End uses Offered
        4. Key Developments
        5. SWOT Analysis
        6. Key Strategies
      7. Buchi Labortechnik AG.
        1. Company Overview
        2. Financial Overview
        3. End uses Offered
        4. Key Developments
        5. SWOT Analysis
        6. Key Strategies
      8. HORIBA LIMITED
        1. Company Overview
        2. Financial Overview
        3. End uses Offered
        4. Key Developments
        5. SWOT Analysis
        6. Key Strategies
      9. Danaher Corporation
        1. Company Overview
        2. Financial Overview
        3. End uses Offered
        4. Key Developments
        5. SWOT Analysis
        6. Key Strategies
      10. Foss A/S
        1. Company Overview
        2. Financial Overview
        3. End uses Offered
        4. Key Developments
        5. SWOT Analysis
        6. Key Strategies
    12. APPENDIX
      1. References
      2. Related Reports
    13. List of Tables and Figures
      1. LIST OF TABLES
      2. TABLE 1 GLOBAL PROCESS SPECTROSCOPY MARKET, SYNOPSIS, 2018-2032
      3. TABLE 2 GLOBAL PROCESS SPECTROSCOPY MARKET, ESTIMATES & FORECAST, 2020-2034(USD BILLION)
      4. TABLE 3 GLOBAL PROCESS SPECTROSCOPY MARKET, BY TECHNOLOGY, 2020-2034(USD BILLION)
      5. TABLE 4 GLOBAL PROCESS SPECTROSCOPY MARKET, BY END USE, 2020-2034(USD BILLION)
      6. TABLE 5 NORTH AMERICA: PROCESS SPECTROSCOPY MARKET, BY TECHNOLOGY, 2020-2034(USD BILLION)
      7. TABLE 6 NORTH AMERICA: PROCESS SPECTROSCOPY MARKET, BY END USE, 2020-2034(USD BILLION)
      8. TABLE 7 US: PROCESS SPECTROSCOPY MARKET, BY TECHNOLOGY, 2020-2034(USD BILLION)
      9. TABLE 8 US: PROCESS SPECTROSCOPY MARKET, BY END USE, 2020-2034(USD BILLION)
      10. TABLE 9 CANADA: PROCESS SPECTROSCOPY MARKET, BY TECHNOLOGY, 2020-2034(USD BILLION)
      11. TABLE 10 CANADA: PROCESS SPECTROSCOPY MARKET, BY END USE, 2020-2034(USD BILLION)
      12. TABLE 1 EUROPE: PROCESS SPECTROSCOPY MARKET, BY TECHNOLOGY, 2020-2034(USD BILLION)
      13. TABLE 2 EUROPE: PROCESS SPECTROSCOPY MARKET, BY END USE, 2020-2034(USD BILLION)
      14. TABLE 3 GERMANY: PROCESS SPECTROSCOPY MARKET, BY TECHNOLOGY, 2020-2034(USD BILLION)
      15. TABLE 4 GERMANY: PROCESS SPECTROSCOPY MARKET, BY END USE, 2020-2034(USD BILLION)
      16. TABLE 5 FRANCE: PROCESS SPECTROSCOPY MARKET, BY TECHNOLOGY, 2020-2034(USD BILLION)
      17. TABLE 6 FRANCE: PROCESS SPECTROSCOPY MARKET, BY END USE, 2020-2034(USD BILLION)
      18. TABLE 7 ITALY: PROCESS SPECTROSCOPY MARKET, BY TECHNOLOGY, 2020-2034(USD BILLION)
      19. TABLE 8 ITALY: PROCESS SPECTROSCOPY MARKET, BY END USE, 2020-2034(USD BILLION)
      20. TABLE 9 SPAIN: PROCESS SPECTROSCOPY MARKET, BY TECHNOLOGY, 2020-2034(USD BILLION)
      21. TABLE 10 SPAIN: PROCESS SPECTROSCOPY MARKET, BY END USE, 2020-2034(USD BILLION)
      22. TABLE 11 UK: PROCESS SPECTROSCOPY MARKET, BY TECHNOLOGY, 2020-2034(USD BILLION)
      23. TABLE 12 UK: PROCESS SPECTROSCOPY MARKET, BY END USE, 2020-2034(USD BILLION)
      24. TABLE 13 REST OF EUROPE: PROCESS SPECTROSCOPY MARKET, BY TECHNOLOGY, 2020-2034(USD BILLION)
      25. TABLE 14 REST OF EUROPE: PROCESS SPECTROSCOPY MARKET, BY END USE, 2020-2034(USD BILLION)
      26. TABLE 15 ASIA-PACIFIC: PROCESS SPECTROSCOPY MARKET, BY TECHNOLOGY, 2020-2034(USD BILLION)
      27. TABLE 16 ASIA-PACIFIC: PROCESS SPECTROSCOPY MARKET, BY END USE, 2020-2034(USD BILLION)
      28. TABLE 17 JAPAN: PROCESS SPECTROSCOPY MARKET, BY TECHNOLOGY, 2020-2034(USD BILLION)
      29. TABLE 18 JAPAN: PROCESS SPECTROSCOPY MARKET, BY END USE, 2020-2034(USD BILLION)
      30. TABLE 19 CHINA: PROCESS SPECTROSCOPY MARKET, BY TECHNOLOGY, 2020-2034(USD BILLION)
      31. TABLE 20 CHINA: PROCESS SPECTROSCOPY MARKET, BY END USE, 2020-2034(USD BILLION)
      32. TABLE 21 INDIA: PROCESS SPECTROSCOPY MARKET, BY TECHNOLOGY, 2020-2034(USD BILLION)
      33. TABLE 22 INDIA: PROCESS SPECTROSCOPY MARKET, BY END USE, 2020-2034(USD BILLION)
      34. TABLE 23 AUSTRALIA: PROCESS SPECTROSCOPY MARKET, BY TECHNOLOGY, 2020-2034(USD BILLION)
      35. TABLE 24 AUSTRALIA: PROCESS SPECTROSCOPY MARKET, BY END USE, 2020-2034(USD BILLION)
      36. TABLE 25 SOUTH KOREA: PROCESS SPECTROSCOPY MARKET, BY TECHNOLOGY, 2020-2034(USD BILLION)
      37. TABLE 26 SOUTH KOREA: PROCESS SPECTROSCOPY MARKET, BY END USE, 2020-2034(USD BILLION)
      38. TABLE 27 REST OF ASIA-PACIFIC: PROCESS SPECTROSCOPY MARKET, BY TECHNOLOGY, 2020-2034(USD BILLION)
      39. TABLE 28 REST OF ASIA-PACIFIC: PROCESS SPECTROSCOPY MARKET, BY END USE, 2020-2034(USD BILLION)
      40. TABLE 29 REST OF THE WORLD: PROCESS SPECTROSCOPY MARKET, BY TECHNOLOGY, 2020-2034(USD BILLION)
      41. TABLE 30 REST OF THE WORLD: PROCESS SPECTROSCOPY MARKET, BY END USE, 2020-2034(USD BILLION)
      42. TABLE 31 MIDDLE EAST: PROCESS SPECTROSCOPY MARKET, BY TECHNOLOGY, 2020-2034(USD BILLION)
      43. TABLE 32 MIDDLE EAST: PROCESS SPECTROSCOPY MARKET, BY END USE, 2020-2034(USD BILLION)
      44. TABLE 33 AFRICA: PROCESS SPECTROSCOPY MARKET, BY TECHNOLOGY, 2020-2034(USD BILLION)
      45. TABLE 34 AFRICA: PROCESS SPECTROSCOPY MARKET, BY END USE, 2020-2034(USD BILLION)
      46. TABLE 35 LATIN AMERICA: PROCESS SPECTROSCOPY MARKET, BY TECHNOLOGY, 2020-2034(USD BILLION)
      47. TABLE 36 LATIN AMERICA: PROCESS SPECTROSCOPY MARKET, BY END USE, 2020-2034(USD BILLION) LIST OF FIGURES
      48. FIGURE 1 RESEARCH PROCESS
      49. FIGURE 2 MARKET STRUCTURE FOR THE GLOBAL PROCESS SPECTROSCOPY MARKET
      50. FIGURE 3 MARKET DYNAMICS FOR THE GLOBAL PROCESS SPECTROSCOPY MARKET
      51. FIGURE 4 GLOBAL PROCESS SPECTROSCOPY MARKET, SHARE (%), BY TECHNOLOGY, 2024
      52. FIGURE 5 GLOBAL PROCESS SPECTROSCOPY MARKET, SHARE (%), BY END USE, 2024
      53. FIGURE 6 GLOBAL PROCESS SPECTROSCOPY MARKET, SHARE (%), BY REGION, 2024
      54. FIGURE 7 NORTH AMERICA: PROCESS SPECTROSCOPY MARKET, SHARE (%), BY REGION, 2024
      55. FIGURE 8 EUROPE: PROCESS SPECTROSCOPY MARKET, SHARE (%), BY REGION, 2024
      56. FIGURE 9 ASIA-PACIFIC: PROCESS SPECTROSCOPY MARKET, SHARE (%), BY REGION, 2024
      57. FIGURE 10 REST OF THE WORLD: PROCESS SPECTROSCOPY MARKET, SHARE (%), BY REGION, 2024
      58. FIGURE 11 GLOBAL PROCESS SPECTROSCOPY MARKET: COMPANY SHARE ANALYSIS, 2024 (%)
      59. FIGURE 12 ABB LTD.: FINANCIAL OVERVIEW SNAPSHOT
      60. FIGURE 13 ABB LTD.: SWOT ANALYSIS
      61. FIGURE 14 SHIMADZU CORPORATION: FINANCIAL OVERVIEW SNAPSHOT
      62. FIGURE 15 SHIMADZU CORPORATION: SWOT ANALYSIS
      63. FIGURE 16 AGILENT TECHNOLOGIES, INC: FINANCIAL OVERVIEW SNAPSHOT
      64. FIGURE 17 AGILENT TECHNOLOGIES, INC: SWOT ANALYSIS
      65. FIGURE 18 SARTORIUS AG: FINANCIAL OVERVIEW SNAPSHOT
      66. FIGURE 19 SARTORIUS AG: SWOT ANALYSIS
      67. FIGURE 20 BRUKER CORPORATION.: FINANCIAL OVERVIEW SNAPSHOT
      68. FIGURE 21 BRUKER CORPORATION.: SWOT ANALYSIS
      69. FIGURE 22 KETT ELECTRIC LABORATORY: FINANCIAL OVERVIEW SNAPSHOT
      70. FIGURE 23 KETT ELECTRIC LABORATORY: SWOT ANALYSIS
      71. FIGURE 24 BUCHI LABORTECHNIK AG.: FINANCIAL OVERVIEW SNAPSHOT
      72. FIGURE 25 BUCHI LABORTECHNIK AG.: SWOT ANALYSIS
      73. FIGURE 26 HORIBA LIMITED: FINANCIAL OVERVIEW SNAPSHOT
      74. FIGURE 27 HORIBA LIMITED: SWOT ANALYSIS
      75. FIGURE 28 DANAHER CORPORATION: FINANCIAL OVERVIEW SNAPSHOT
      76. FIGURE 29 DANAHER CORPORATION: SWOT ANALYSIS
      77. FIGURE 30 FOSS A/S: FINANCIAL OVERVIEW SNAPSHOT
      78. FIGURE 31 FOSS A/S: SWOT ANALYSIS

    Process Spectroscopy Market Segmentation

    Process Spectroscopy Technology Outlook (USD Billion, 2020-2034)

    • NIR
    • FT-IR
    • Raman

    Process Spectroscopy End use Outlook (USD Billion, 2020-2034)

    • Oil and Gas
    • Pharmaceuticals
    • Food and Agriculture
    • Chemical
    • Others

    Process Spectroscopy Regional Outlook (USD Billion, 2020-2034)

    • North America Outlook (USD Billion, 2020-2034)
      • North America Process Spectroscopy by Technology
        • NIR
        • FT-IR
        • Raman
      • North America Process Spectroscopy by End use
        • Oil and Gas
        • Pharmaceuticals
        • Food and Agriculture
        • Chemical
        • Others
      • US Outlook (USD Billion, 2020-2034)
      • US Process Spectroscopy by Technology
        • NIR
        • FT-IR
        • Raman
      • US Process Spectroscopy by End use
        • Oil and Gas
        • Pharmaceuticals
        • Food and Agriculture
        • Chemical
        • Others
      • CANADA Outlook (USD Billion, 2020-2034)
      • CANADA Process Spectroscopy by Technology
        • NIR
        • FT-IR
        • Raman
      • CANADA Process Spectroscopy by End use
        • Oil and Gas
        • Pharmaceuticals
        • Food and Agriculture
        • Chemical
        • Others
      • Europe Outlook (USD Billion, 2020-2034)
        • Europe Process Spectroscopy by Technology
          • NIR
          • FT-IR
          • Raman
        • Europe Process Spectroscopy by End use
          • Oil and Gas
          • Pharmaceuticals
          • Food and Agriculture
          • Chemical
          • Others
        • Germany Outlook (USD Billion, 2020-2034)
        • Germany Process Spectroscopy by Technology
          • NIR
          • FT-IR
          • Raman
        • Germany Process Spectroscopy by End use
          • Oil and Gas
          • Pharmaceuticals
          • Food and Agriculture
          • Chemical
          • Others
        • France Outlook (USD Billion, 2020-2034)
        • France Process Spectroscopy by Technology
          • NIR
          • FT-IR
          • Raman
        • France Process Spectroscopy by End use
          • Oil and Gas
          • Pharmaceuticals
          • Food and Agriculture
          • Chemical
          • Others
        • UK Outlook (USD Billion, 2020-2034)
        • UK Process Spectroscopy by Technology
          • NIR
          • FT-IR
          • Raman
        • UK Process Spectroscopy by End use
          • Oil and Gas
          • Pharmaceuticals
          • Food and Agriculture
          • Chemical
          • Others
        • ITALY Outlook (USD Billion, 2020-2034)
        • ITALY Process Spectroscopy by Technology
          • NIR
          • FT-IR
          • Raman
        • ITALY Process Spectroscopy by End use
          • Oil and Gas
          • Pharmaceuticals
          • Food and Agriculture
          • Chemical
          • Others
        • SPAIN Outlook (USD Billion, 2020-2034)
        • Spain Process Spectroscopy by Technology
          • NIR
          • FT-IR
          • Raman
        • Spain Process Spectroscopy by End use
          • Oil and Gas
          • Pharmaceuticals
          • Food and Agriculture
          • Chemical
          • Others
        • Rest Of Europe Outlook (USD Billion, 2020-2034)
        • Rest Of Europe Process Spectroscopy by Technology
          • NIR
          • FT-IR
          • Raman
        • REST OF EUROPE Process Spectroscopy by End use
          • Oil and Gas
          • Pharmaceuticals
          • Food and Agriculture
          • Chemical
          • Others
        • Asia-Pacific Outlook (USD Billion, 2020-2034)
          • Asia-Pacific Process Spectroscopy by Technology
            • NIR
            • FT-IR
            • Raman
          • Asia-Pacific Process Spectroscopy by End use
            • Oil and Gas
            • Pharmaceuticals
            • Food and Agriculture
            • Chemical
            • Others
          • China Outlook (USD Billion, 2020-2034)
          • China Process Spectroscopy by Technology
            • NIR
            • FT-IR
            • Raman
          • China Process Spectroscopy by End use
            • Oil and Gas
            • Pharmaceuticals
            • Food and Agriculture
            • Chemical
            • Others
          • Japan Outlook (USD Billion, 2020-2034)
          • Japan Process Spectroscopy by Technology
            • NIR
            • FT-IR
            • Raman
          • Japan Process Spectroscopy by End use
            • Oil and Gas
            • Pharmaceuticals
            • Food and Agriculture
            • Chemical
            • Others
          • India Outlook (USD Billion, 2020-2034)
          • India Process Spectroscopy by Technology
            • NIR
            • FT-IR
            • Raman
          • India Process Spectroscopy by End use
            • Oil and Gas
            • Pharmaceuticals
            • Food and Agriculture
            • Chemical
            • Others
          • Australia Outlook (USD Billion, 2020-2034)
          • Australia Process Spectroscopy by Technology
            • NIR
            • FT-IR
            • Raman
          • Australia Process Spectroscopy by End use
            • Oil and Gas
            • Pharmaceuticals
            • Food and Agriculture
            • Chemical
            • Others
          • Rest of Asia-Pacific Outlook (USD Billion, 2020-2034)
          • Rest of Asia-Pacific Process Spectroscopy by Technology
            • NIR
            • FT-IR
            • Raman
          • Rest of Asia-Pacific Process Spectroscopy by End use
            • Oil and Gas
            • Pharmaceuticals
            • Food and Agriculture
            • Chemical
            • Others
          • Rest of the World Outlook (USD Billion, 2020-2034)
            • Rest of the World Process Spectroscopy by Technology
              • NIR
              • FT-IR
              • Raman
            • Rest of the World Process Spectroscopy by End use
              • Oil and Gas
              • Pharmaceuticals
              • Food and Agriculture
              • Chemical
              • Others
            • Middle East Outlook (USD Billion, 2020-2034)
            • Middle East Process Spectroscopy by Technology
              • NIR
              • FT-IR
              • Raman
            • Middle East Process Spectroscopy by End use
              • Oil and Gas
              • Pharmaceuticals
              • Food and Agriculture
              • Chemical
              • Others
            • Africa Outlook (USD Billion, 2020-2034)
            • Africa Process Spectroscopy by Technology
              • NIR
              • FT-IR
              • Raman
            • Africa Process Spectroscopy by End use
              • Oil and Gas
              • Pharmaceuticals
              • Food and Agriculture
              • Chemical
              • Others
            • Latin America Outlook (USD Billion, 2020-2034)
            • Latin America Process Spectroscopy by Technology
              • NIR
              • FT-IR
              • Raman
            • Latin America Process Spectroscopy by End use
              • Oil and Gas
              • Pharmaceuticals
              • Food and Agriculture
              • Chemical
              • Others
    Infographic

    Free Sample Request

    Kindly complete the form below to receive a free sample of this Report

    Get Free Sample

    Customer Strories

    “I am very pleased with how market segments have been defined in a relevant way for my purposes (such as "Portable Freezers & refrigerators" and "last-mile"). In general the report is well structured. Thanks very much for your efforts.”

    Victoria Milne

    Founder
    Case Study
    Chemicals and Materials