Download Free Sample
Kindly complete the form below to receive a free sample of this Report
Prototyping Services via 3D Printing Market Research Report: Size, Share, Trend Analysis By Technology Outlook (Fused Deposition Modeling, Stereolithography, Selective Laser Sintering, Digital Light Processing, Binder Jetting) By Application Outlook (Prototyping, Tooling, Production, Design Validation, Functional Testing) By Service Type Outlook (Rapid Prototyping, On-Demand Manufacturing, Design Services, Consultation Services, Post-Processing Services) By Material Type Outlook (Plastic, Metal, Ceramic, Composite, Bio-material) By End Use Industry Outlook (Aerospace, Automotive, Healthcare, Consumer Goods, Electronics) By Region (North America, Europe, APAC, South America, MEA) - Growth Outlook & Industry Forecast To 2035
As per MRFR analysis, the Prototyping Services via 3D Printing Market Size was estimated at 5.2 USD Billion in 2024. The Prototyping Services via 3D Printing industry is projected to grow from 5.73 in 2025 to 15.0 by 2035, exhibiting a compound annual growth rate (CAGR) of 10.11% during the forecast period 2025 - 2035.
The Prototyping Services via 3D Printing Market is experiencing robust growth driven by customization and technological advancements.
| 2024 Market Size | 5.2 (USD Billion) |
| 2035 Market Size | 15.0 (USD Billion) |
| CAGR (2025 - 2035) | 10.11% |
Stratasys (US), 3D Systems (US), Materialise (BE), HP (US), Siemens (DE), GE Additive (US), Formlabs (US), Carbon (US), Desktop Metal (US)
Our Impact
Enabled $4.3B Revenue Impact for Fortune 500 and Leading Multinationals
Partnering with 2000+ Global Organizations Each Year
30K+ Citations by Top-Tier Firms in the Industry
The Prototyping Services via 3D Printing Market is currently experiencing a transformative phase, characterized by rapid advancements in technology and increasing adoption across various industries. This market appears to be driven by the need for faster product development cycles and the ability to create complex geometries that traditional manufacturing methods struggle to achieve. Companies are increasingly recognizing the potential of 3D printing to reduce costs and enhance design flexibility, which may lead to a broader acceptance of these services in sectors such as automotive, aerospace, and healthcare. Furthermore, the integration of artificial intelligence and machine learning into the prototyping process seems to be enhancing efficiency and precision, thereby attracting more businesses to explore these innovative solutions. In addition, sustainability concerns are becoming more prominent, prompting organizations to seek eco-friendly materials and processes. The Prototyping Services via 3D Printing Market is likely to witness a shift towards biodegradable and recyclable materials, aligning with global efforts to reduce environmental impact. As the technology continues to evolve, it is anticipated that new applications will emerge, further expanding the market's scope. Overall, the current landscape suggests a dynamic environment where innovation and sustainability are at the forefront of development, potentially reshaping how products are designed and manufactured in the future.
The demand for personalized products is on the rise, leading to a greater emphasis on customization within the Prototyping Services via 3D Printing Market. Businesses are leveraging 3D printing to create tailored solutions that meet specific customer needs, which traditional manufacturing methods often cannot accommodate. This trend indicates a shift towards more consumer-centric approaches in product development.
There is a growing focus on sustainability within the Prototyping Services via 3D Printing Market, as companies seek to minimize their environmental footprint. The adoption of eco-friendly materials and processes is becoming more prevalent, reflecting a broader commitment to sustainable practices. This trend suggests that businesses are increasingly aware of their impact on the environment and are taking steps to address it.
The incorporation of advanced technologies, such as artificial intelligence and machine learning, is transforming the Prototyping Services via 3D Printing Market. These technologies enhance the efficiency and accuracy of the prototyping process, allowing for quicker iterations and improved product quality. This trend indicates a move towards more sophisticated and automated solutions in the industry.
The Prototyping Services via 3D Printing Market is experiencing a notable surge in demand for rapid prototyping solutions. Companies across various sectors, including automotive, aerospace, and consumer goods, are increasingly adopting 3D printing technologies to accelerate product development cycles. This trend is driven by the need for faster time-to-market and the ability to iterate designs quickly. According to recent data, the prototyping services market is projected to grow at a compound annual growth rate of approximately 25% over the next five years. This growth is indicative of a broader shift towards agile manufacturing processes, where businesses prioritize speed and flexibility in their operations. As a result, the Prototyping Services via 3D Printing Market is likely to expand significantly, catering to the evolving needs of manufacturers seeking competitive advantages.
Cost efficiency remains a pivotal driver in the Prototyping Services via 3D Printing Market. Traditional prototyping methods often involve substantial material waste and high labor costs. In contrast, 3D printing technologies enable manufacturers to produce prototypes with minimal waste, utilizing only the necessary materials for each design. This efficiency not only reduces production costs but also allows for more sustainable practices. Recent analyses suggest that companies can save up to 40% on prototyping costs by integrating 3D printing into their workflows. Furthermore, the ability to produce complex geometries without the constraints of traditional manufacturing processes enhances design possibilities, making 3D printing an attractive option for businesses aiming to optimize their prototyping efforts. Consequently, the Prototyping Services via 3D Printing Market is poised for growth as organizations seek to enhance their operational efficiencies.
Customization and personalization are increasingly influencing the Prototyping Services via 3D Printing Market. As consumer preferences shift towards unique and tailored products, manufacturers are compelled to adopt 3D printing technologies that facilitate bespoke designs. This trend is particularly evident in sectors such as fashion, jewelry, and consumer electronics, where individualized products are gaining traction. The ability to create prototypes that reflect specific customer requirements not only enhances customer satisfaction but also fosters brand loyalty. Market Research Future suggest that the demand for customized prototypes is expected to grow by approximately 30% over the next few years, as businesses recognize the value of offering personalized solutions. Consequently, the Prototyping Services via 3D Printing Market is likely to evolve, with companies investing in technologies that enable them to meet the rising expectations of consumers.
Technological advancements are a critical driver of growth in the Prototyping Services via 3D Printing Market. Innovations in 3D printing technologies, such as improved printing speeds, enhanced resolution, and the development of new materials, are expanding the capabilities of prototyping services. These advancements enable manufacturers to produce high-quality prototypes that closely resemble final products, thereby reducing the gap between prototyping and production. Furthermore, the integration of artificial intelligence and machine learning into 3D printing processes is streamlining operations and enhancing design accuracy. As these technologies continue to evolve, they are likely to attract more businesses to the Prototyping Services via 3D Printing Market, fostering a competitive landscape that encourages continuous improvement and innovation.
The Prototyping Services via 3D Printing Market is witnessing an increased adoption of additive manufacturing technologies. This shift is largely attributed to advancements in 3D printing materials and techniques, which have expanded the range of applications for prototyping services. Industries such as healthcare, where custom implants and prosthetics are in demand, are leveraging 3D printing to create tailored solutions that meet specific patient needs. Additionally, the aerospace sector is utilizing additive manufacturing to produce lightweight components that enhance fuel efficiency. Market data indicates that the additive manufacturing segment is expected to account for a significant portion of the overall prototyping services market, with projections suggesting a growth rate of over 20% in the coming years. This trend underscores the transformative potential of 3D printing technologies in various industries, driving the Prototyping Services via 3D Printing Market forward.
The application segment of the Prototyping Services via 3D Printing Market showcases a diverse distribution of market share among its various components. Prototyping emerges as the dominant application, owing to its widespread adoption across industries seeking rapid development cycles and innovation. Following closely is the tooling segment, which, while smaller in share, has gained traction through advances in 3D printing technology that enhance precision and reduce material waste.
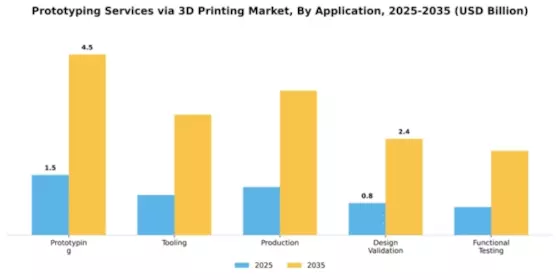
Prototyping (Dominant) vs. Tooling (Emerging)
Prototyping remains the cornerstone of this market, characterized by its ability to accelerate product development and validation processes. Companies leverage 3D printing to create functional prototypes quickly, enabling iterative testing and design improvements. On the other hand, the tooling segment is emerging rapidly, with industries recognizing the potential of 3D printed tooling solutions for bespoke manufacturing needs. This shift towards customized tools not only enhances efficiency but also significantly reduces lead times and costs, positioning tooling as a game-changer in the production workflow.
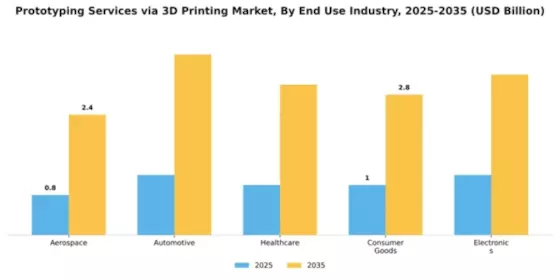
The Prototyping Services via 3D Printing Market is significantly influenced by various end-use industries. Aerospace holds the largest share, driven by the demand for lightweight and complex structures that enhance fuel efficiency and performance. Healthcare follows closely, benefiting from innovative medical solutions and customized components. Meanwhile, the automotive sector also plays a crucial role with its emphasis on rapid design iterations and cost-effective production methods. Consumer goods and electronics are growing steadily, reflecting advancements in consumer preferences and technological integration.
Aerospace: Dominant vs. Healthcare: Emerging
Aerospace remains a dominating force in the Prototyping Services via 3D Printing Market due to its extensive use of additive manufacturing for producing lightweight components and prototypes that optimize aircraft performance and reduce emissions. This sector requires precision and compliance with stringent safety standards, making it an ideal area for 3D printing technologies. On the other hand, healthcare is emerging rapidly, leveraging 3D printing for personalized medical devices, surgical tools, and bioprinting solutions. The ability to quickly produce patient-specific models and implants addresses individual healthcare needs and paves the way for innovations in medical treatment.
In the Prototyping Services via 3D Printing Market, the distribution of material types showcases Plastic as the leading segment, capturing a significant portion of the market share. This popularity is largely attributed to its versatility, cost-effectiveness, and the ability to produce complex geometries that traditional manufacturing cannot achieve. Additionally, Plastic materials suit a wide range of applications across industries such as automotive, aerospace, and consumer goods, enhancing their dominance in prototyping services. Conversely, Metal is emerging as the fastest-growing segment within the market. As industries increasingly seek durable and high-performance prototypes, the demand for metal prototyping is surging. Key drivers of this trend include improvements in 3D printing technologies that enable precise metal fabrication and a growing focus on lightweight, strong materials, such as titanium and aluminum, particularly in sectors like aerospace and medical implants.
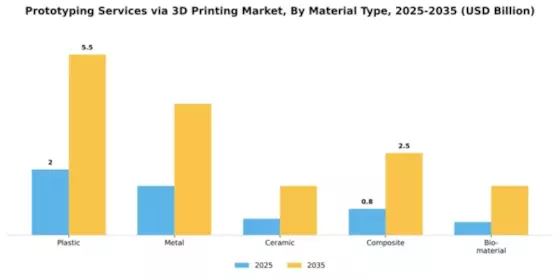
Plastic (Dominant) vs. Metal (Emerging)
The dominant segment, Plastic, plays a crucial role in the Prototyping Services via 3D Printing Market, as its properties allow for rapid prototyping, intricate detailing, and customizable designs at a lower cost. Plastic materials such as PLA, ABS, and nylon are favored for their ease of use and adaptability across various applications. In contrast, the emerging segment of Metal is gaining traction due to advancements in technology that enhance metal 3D printing techniques, such as Direct Metal Laser Sintering (DMLS). Metals like steel, aluminum, and titanium offer increased durability and strength, making them ideal for functional prototypes in demanding industries. The competition between these materials highlights an evolving landscape in additive manufacturing where flexibility and performance are balanced.
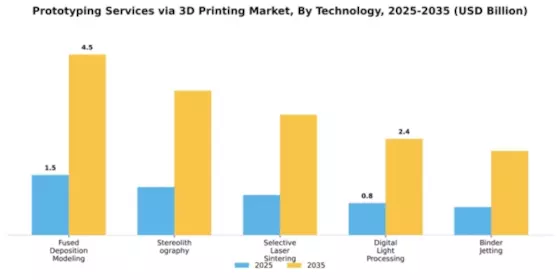
In the Prototyping Services via 3D Printing Market, Fused Deposition Modeling (FDM) holds the largest market share due to its versatility and cost-effectiveness, widely preferred for producing durable prototypes in various industries. Following FDM, Stereolithography (SLA) is gaining traction as a faster alternative for producing high-resolution parts, leading to its rapid growth in market adoption. As companies look for efficient prototyping solutions, SLA's appeal continues to rise, appealing particularly to the medical and aerospace sectors.
Fused Deposition Modeling (Dominant) vs. Stereolithography (Emerging)
Fused Deposition Modeling (FDM) stands as the dominant technology in the Prototyping Services via 3D Printing Market, known for its simplicity and cost-efficiency. It uses thermoplastic materials to create robust prototypes quickly, making it an ideal choice for low-volume production runs. In contrast, Stereolithography (SLA) represents an emerging technology, well-suited for applications requiring intricate detail and smooth surface finishes. SLA uses UV light to cure liquid resin, resulting in high accuracy. As design complexity increases across different sectors, SLA is expected to expand its market reach, appealing to industries focused on precision and quality.
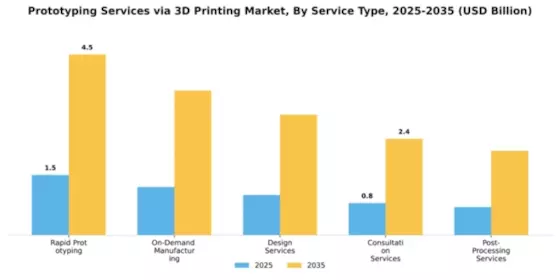
In the Prototyping Services via 3D Printing Market, the service type segment exhibits a diverse mix of offerings. Rapid Prototyping holds the largest share, being favored by businesses for its speed and efficiency in delivering prototypes. Other services like Design Services and Consultation Services also contribute significantly, but On-Demand Manufacturing is gaining traction as it caters to the increasing demand for customized products and short production runs, which enhances its market presence.
Rapid Prototyping (Dominant) vs. On-Demand Manufacturing (Emerging)
Rapid Prototyping is the dominant service in the Prototyping Services market, credited for its ability to produce models quickly and accurately, thus meeting the fast-paced needs of product development. This segment harnesses advanced 3D printing technologies to reduce lead times and ensure iterative design processes. Meanwhile, On-Demand Manufacturing is emerging as a strong contender, driven by the shift towards personalized solutions and a focus on sustainability. This service allows manufacturers to produce items based on real-time demand, minimizing waste and delivering products tailored to consumer needs. Despite its emerging status, On-Demand Manufacturing's adaptability and responsiveness position it well for future growth.
Get more detailed insights about Prototyping Services via 3D Printing Market Request Free Sample
North America dominates the Prototyping Services via 3D Printing Market, holding a significant market share of 2.6B in 2025. The region's growth is driven by rapid technological advancements, increasing demand for customized solutions, and supportive regulatory frameworks. The presence of major players like Stratasys and 3D Systems further fuels market expansion, as they invest heavily in R&D and innovation to meet diverse industry needs. The U.S. stands out as the leading country, contributing the majority of the market share. The competitive landscape is characterized by a mix of established companies and emerging startups, all vying for a piece of the lucrative market. Key players are focusing on strategic partnerships and collaborations to enhance their service offerings and expand their reach, ensuring North America's position as a leader in the global 3D printing landscape.
Europe's Prototyping Services via 3D Printing Market is projected to reach 1.5B by 2025, driven by increasing adoption across various sectors, including automotive and healthcare. The region benefits from robust regulatory support aimed at fostering innovation and sustainability. Countries like Germany and the UK are at the forefront, with initiatives promoting advanced manufacturing technologies and digital transformation in production processes. Germany leads the European market, supported by a strong industrial base and significant investments in 3D printing technologies. The competitive landscape features key players such as Siemens and Materialise, who are actively enhancing their capabilities through strategic investments and collaborations. This dynamic environment is expected to propel Europe into a leading position in the global 3D printing market.
The Asia-Pacific region is witnessing a burgeoning Prototyping Services via 3D Printing Market, projected to reach 1.0B by 2025. This growth is fueled by increasing industrialization, a rising number of startups, and a growing emphasis on innovation in manufacturing processes. Countries like China and Japan are leading the charge, supported by government initiatives aimed at enhancing technological capabilities and fostering a culture of innovation. China is particularly noteworthy, with significant investments in 3D printing technologies across various sectors, including aerospace and healthcare. The competitive landscape is becoming increasingly vibrant, with both local and international players, such as HP and GE Additive, striving to capture market share. This dynamic environment is expected to drive further advancements and adoption of 3D printing technologies in the region.
The Middle East and Africa region is in the nascent stages of developing its Prototyping Services via 3D Printing Market, currently valued at 0.1B in 2025. The growth potential is significant, driven by increasing investments in technology and infrastructure, as well as a growing interest in additive manufacturing across various industries. Countries like the UAE are leading efforts to integrate 3D printing into their manufacturing sectors, supported by government initiatives promoting innovation. The competitive landscape is still evolving, with a mix of local startups and international players beginning to establish a presence. As the region continues to invest in technology and education, the adoption of 3D printing is expected to accelerate, paving the way for new opportunities and advancements in the market.
The Prototyping Services via 3D Printing Market is characterized by a dynamic competitive landscape, driven by technological advancements and increasing demand for rapid prototyping across various industries. Key players such as Stratasys (US), 3D Systems (US), and Materialise (BE) are at the forefront, each adopting distinct strategies to enhance their market positioning. Stratasys (US) focuses on innovation through continuous product development, while 3D Systems (US) emphasizes strategic partnerships to expand its service offerings. Materialise (BE) is leveraging its expertise in software solutions to integrate seamlessly with 3D printing technologies, thereby enhancing operational efficiency. Collectively, these strategies contribute to a competitive environment that is increasingly centered around technological differentiation and customer-centric solutions.In terms of business tactics, companies are increasingly localizing manufacturing to reduce lead times and optimize supply chains. This approach appears to be particularly effective in a market that is moderately fragmented, with numerous players vying for market share. The collective influence of key players is significant, as they not only drive innovation but also set industry standards that smaller firms often follow. The competitive structure is evolving, with larger companies acquiring smaller firms to bolster their technological capabilities and market reach.In November HP (US) announced a strategic partnership with a leading automotive manufacturer to develop customized 3D printed components for electric vehicles. This collaboration is poised to enhance HP's position in the automotive sector, showcasing its commitment to innovation and sustainability. The partnership is likely to facilitate the integration of advanced 3D printing technologies into the automotive supply chain, thereby streamlining production processes and reducing costs.In October GE Additive (US) unveiled a new metal 3D printing system designed for high-volume production. This launch signifies GE's focus on expanding its capabilities in additive manufacturing, particularly for industries such as aerospace and healthcare. The introduction of this system is expected to enhance production efficiency and reduce material waste, aligning with the growing emphasis on sustainability within the industry.In September Carbon (US) expanded its operations by opening a new facility in Europe dedicated to the production of 3D printed medical devices. This strategic move reflects Carbon's commitment to addressing the increasing demand for personalized healthcare solutions. By establishing a local presence, Carbon aims to enhance its supply chain responsiveness and better serve its European clientele, thereby solidifying its competitive edge in the medical sector.As of December the competitive trends in the Prototyping Services via 3D Printing Market are increasingly defined by digitalization, sustainability, and the integration of artificial intelligence. Strategic alliances are becoming more prevalent, as companies recognize the value of collaboration in driving innovation and enhancing operational capabilities. Looking ahead, competitive differentiation is likely to evolve from traditional price-based competition to a focus on technological innovation, supply chain reliability, and sustainable practices. This shift underscores the importance of adaptability and forward-thinking strategies in navigating the complexities of the modern market.






The Prototyping Services via 3D Printing Market is projected to grow at a 10.11% CAGR from 2025 to 2035, driven by technological advancements, increased customization, and demand for rapid prototyping.
New opportunities lie in:
By 2035, the market is expected to be robust, driven by innovation and diverse applications.
| MARKET SIZE 2024 | 5.2(USD Billion) |
| MARKET SIZE 2025 | 5.73(USD Billion) |
| MARKET SIZE 2035 | 15.0(USD Billion) |
| COMPOUND ANNUAL GROWTH RATE (CAGR) | 10.11% (2025 - 2035) |
| REPORT COVERAGE | Revenue Forecast, Competitive Landscape, Growth Factors, and Trends |
| BASE YEAR | 2024 |
| Market Forecast Period | 2025 - 2035 |
| Historical Data | 2019 - 2024 |
| Market Forecast Units | USD Billion |
| Key Companies Profiled | Stratasys (US), 3D Systems (US), Materialise (BE), HP (US), Siemens (DE), GE Additive (US), Formlabs (US), Carbon (US), Desktop Metal (US) |
| Segments Covered | Application, End Use Industry, Material Type, Technology, Service Type |
| Key Market Opportunities | Integration of advanced materials enhances customization in the Prototyping Services via 3D Printing Market. |
| Key Market Dynamics | Rising demand for rapid prototyping drives innovation and competition in the 3D printing services market. |
| Countries Covered | North America, Europe, APAC, South America, MEA |
The projected market valuation for Prototyping Services via 3D Printing in 2035 is expected to reach 15.0 USD Billion.
The market valuation for Prototyping Services via 3D Printing was 5.2 USD Billion in 2024.
The expected CAGR for the Prototyping Services via 3D Printing Market during the forecast period 2025 - 2035 is 10.11%.
Key players in the market include Stratasys, 3D Systems, Materialise, HP, Siemens, GE Additive, Formlabs, Carbon, and Desktop Metal.
By 2035, the Prototyping application segment is projected to reach 4.5 USD Billion.
The Automotive sector is projected to contribute 3.6 USD Billion to the Prototyping Services market by 2035.
The expected market size for Plastic materials in the Prototyping Services market is projected to be 5.5 USD Billion by 2035.
The Fused Deposition Modeling technology segment is anticipated to have the highest valuation of 4.5 USD Billion by 2035.
The projected value of Design Services in the Prototyping Services market is expected to reach 3.0 USD Billion by 2035.
By 2035, the Healthcare sector is projected to reach 3.0 USD Billion, while the Consumer Goods sector is expected to reach 2.8 USD Billion.


Kindly complete the form below to receive a free sample of this Report

“This is really good guys. Excellent work on a tight deadline. I will continue to use you going forward and recommend you to others. Nice job”


“Thanks. It’s been a pleasure working with you, please use me as reference with any other Intel employees.”


“Thanks for sending the report it gives us a good global view of the Betaïne market.”


“Thank you, this will be very helpful for OQS.”


“We found the report very insightful! we found your research firm very helpful. I'm sending this email to secure our future business.”


“I am very pleased with how market segments have been defined in a relevant way for my purposes (such as "Portable Freezers & refrigerators" and "last-mile"). In general the report is well structured. Thanks very much for your efforts.”


“I have been reading the first document or the study, ,the Global HVAC and FP market report 2021 till 2026. Must say, good info! I have not gone in depth at all parts, but got a good indication of the data inside!”


“We got the report in time, we really thank you for your support in this process. I also thank to all of your team as they did a great job.”


“The Automotive 48V ECU Components Procurement Intelligence Study” was a complex project, but the Market Research Future (MRFR) team handled it with quality, agility, and customer-centricity. They delivered all requested data on time and within the agreed scope. The team, including Shubhendra Anand and Rahul Gotadki, was always readily available to clarify questions and swiftly implement necessary adjustments, driving the project to a successful conclusion within a very demanding timeframe.
I would also like to specifically commend Akshay Agarwal for his responsiveness and support at every stage—from our initial inquiry on May 6th through to final delivery on June 18th. His dedication made the entire process seamless.”



