Quartz Market (2025 - 2035)

Quartz Market Research Report Information By Type (High-purity Quartz (Quartz Surface and Tile, Fused Quartz Crucible, Quartz Glass), Quartz Crystal, and Silicon Metal), By End-User Industry (Electronics and Semiconductor Solar, Buildings and Construction, Optical fiber and Telecommunication, Automotive, and Other End-user Industries), And By Region (North America, Europe, Asia-Pacific, And Rest Of The World) –Market Forecast Till 2035
ID: MRFR/CnM/17307-HCR
128 Pages
Chitranshi Jaiswal
Last Updated: July 02, 2026
Quartz Market
Market Size
Forecast Period2025-2035
CAGR (2025-2035)6.30%
2025 Market SizeUSD 9,850 Million
2035 Market SizeUSD 18,150 Million
Key Players
Sibelco
The Quartz Corp
Jiangsu Pacific Quartz
Momentive Technologies
Heraeus Conamic
Shin-Etsu Quartz Products
Opportunities
  • African Greenfield Mining Development
  • Recycled Quartz Feedstock and Circular Processing
  • Quantum-Computing Substrate Demand

Quartz Market Summary

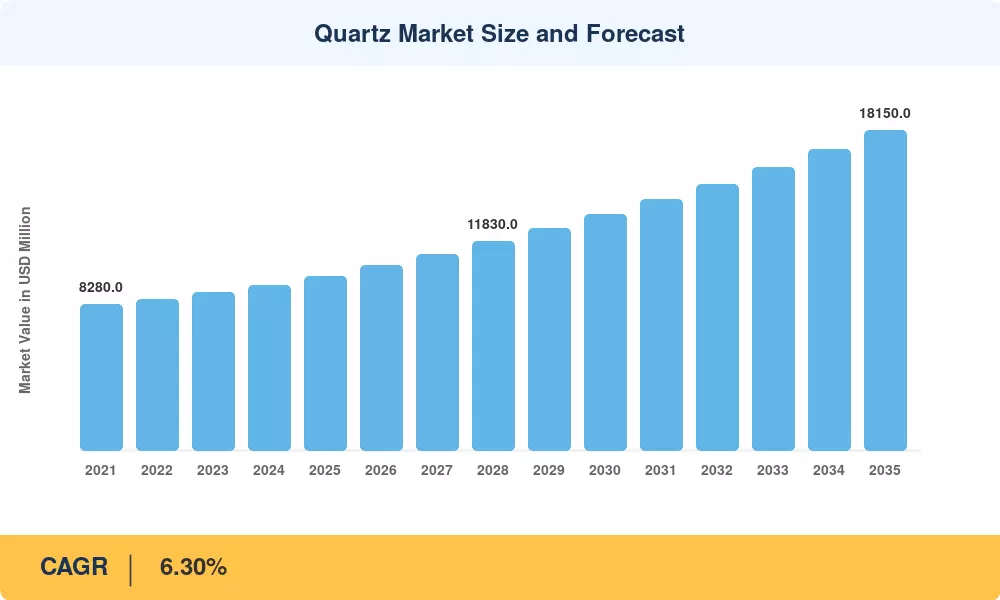
The Quartz Market reached an estimated USD 9,850 million in 2025 and is projected to grow from USD 10,470 million in 2026 to approximately USD 18,150 million by 2035, registering a CAGR of 6.30% across the forecast period. Two forces are propelling this trajectory: semiconductor fabs pushing node geometries below 5 nm now demand crucible-grade feedstock with impurity thresholds measured in parts per billion, and global photovoltaic capacity additions—exceeding 350 GW annually since 2024—are consuming ever-larger volumes of solar-grade material [2][3].

A structural revolution is taking place in the way the mineral is moved from mine to finished product. Chlorination and plasma-assisted methods are replacing legacy acid-leach purification lines, and can attain 99.998% SiO 2 purity at commercial scale. In 2024, the U.S. Department of Energy granted USD 150 million to reduce the risk of domestic critical-mineral processing through the CHIPS and Science Act, while the European Critical Raw Materials Act declared silicon metal a strategic material, setting mandatory stockpiling targets across member states of the EU [4][5].


The Asia-Pacific region is estimated to account for 51% of the Quartz Market, with China dominating the silicon-metal smelting and Japan leading the semiconductor-grade fabrication segment. The region also has the fastest growth trajectory with a CAGR of 6.75% until 2035. North America is the No. 2 market at about 23%, aided by reshoring incentives and the concentration of sophisticated chip production in Arizona, Ohio and Texas. Europe is next with an 18% share, helped by the expansion of solar production and optical-fiber installations under EU broadband ambitions.


Key Quartz Market Report Takeaways

By Product Type

  • Silicon metal accounted for approximately 91.0% of the global Quartz Market volume in 2025, reflecting its central role in metallurgical and chemical industries.
  • The high-purity segment is advancing at a 7.75% CAGR through 2035, outpacing all other product categories as semiconductor and photovoltaic specifications tighten.

By End-User Industry

  • Electronics and semiconductor end users represented roughly 37.2% of the Quartz Market value in 2025, driven by wafer-fabrication capacity build-outs across three continents.
  • The solar segment is expanding at a 6.95% CAGR, supported by utility-scale installations and next-generation heterojunction cell production.

By Geography

  • Asia-Pacific held approximately 51.2% of the global Quartz Market share in 2025, led by China, Japan, and South Korea.
  • North America is the second-largest region, with USD 2,216 million in 2025 revenue and strong policy tailwinds from the CHIPS Act and Inflation Reduction Act.


Quartz Market Size and Forecast (2021–2035)

Market Research Future (MRFR) uses a triangulating sizing technique that combines top-down revenue models with bottom-up consumption data from customs, trade groups, and corporate filings in 28 countries. Historical data are based on actual reported volumes; forecast estimates include demand side modeling for semiconductor, solar and construction verticals calibrated against announced capacity additions.
Quartz Market Size and Forecast
Our Impact
Enabled $4.3B Revenue Impact for Fortune 500 and Leading Multinationals
Partnering with 2000+ Global Organizations Each Year
30K+ Citations by Top-Tier Firms in the Industry

Driver Impact Analysis

Driver ~% Impact on CAGR Geographic Relevance Impact Timeline
Semiconductor node shrinkage below 5 nm +1.4% Asia-Pacific, North America Medium-term (2–4 yr)
Utility-scale solar capacity expansion +1.2% Global Short-term (≤2 yr)
Critical-mineral reshoring policies +0.9% North America, Europe Medium-term (2–4 yr)
Optical-fiber broadband deployment +0.6% Europe, Asia-Pacific Long-term (≥4 yr)
EV powertrain sensor proliferation +0.5% Global Long-term (≥4 yr)
Supply-chain diversification from Spruce Pine +0.4% North America, Europe Short-term (≤2 yr)
Advanced purification technology adoption +0.3% Global Medium-term (2–4 yr)


Semiconductor Node Shrinkage

Leading-edge chipmakers—including TSMC, Samsung, and Intel—are aggressively expanding capacity to support the artificial intelligence infrastructure boom. Global semiconductor industry investment is now scaling to support a market projected to reach nearly $1 trillion in annual sales by the end of 2026. This transition to sub-2 nm process nodes requires increasingly stringent purity standards for crucible-grade feedstock to manage defect densities. While specific chemical concentration limits are proprietary, the demand for High-Purity Quartz (HPQ) is rising alongside the move toward larger-diameter (300mm+) wafer fabrication and advanced packaging, driving sustained growth in fab clusters across North America and Asia-Pacific.


Utility-Scale Solar Expansion

The International Energy Agency projects global annual PV additions will surpass 500 GW by 2028 [3]. Czochralski ingot pullers used in monocrystalline cell production consume quartz crucibles that are single-use, creating a recurring demand stream tied directly to wafer output. China's dominance in polysilicon refining and ingot pulling means its Quartz Market consumption alone could account for one-third of incremental global demand through 2030.

Critical-Mineral Reshoring Policies

The U.S. CHIPS and Science Act earmarks USD 52.7 billion for domestic semiconductor manufacturing, with ancillary provisions supporting upstream mineral supply chains [4]. The EU Critical Raw Materials Act mandates that at least 10% of strategic mineral consumption be sourced domestically by 2030, a target that is catalyzing greenfield quartz exploration in Scandinavia and Iberia [5]. These policy frameworks reduce single-source risk and create new capacity investment cycles.

Optical-Fiber Broadband Deployment

The EU’s Digital Decade program serves as a primary policy driver for gigabit connectivity, aiming to cover all households with high-speed networks by 2030. This infrastructure buildout requires massive quantities of high-purity synthetic fused quartz for fiber-optic preforms. Similar national broadband initiatives in India and Brazil are creating parallel demand corridors, significantly expanding the addressable market for quartz in the telecommunications sector. As digital transformation accelerates globally, high-quality silica remains a foundational input for the physical layer of the internet.


Restraints Impact Analysis

The restraint impacts below are directional offsets that temper the baseline growth rate. They are not subtracted directly from the forecast CAGR and should be evaluated as risk-weighted drag factors.

Restraint ~% Drag on CAGR Geographic Relevance Impact Timeline
Geographic concentration of HPQ deposits –0.7% Global Short-term (≤2 yr)
Energy-intensive processing costs –0.5% Europe, North America Medium-term (2–4 yr)
Substitution by synthetic alternatives –0.4% Asia-Pacific Long-term (≥4 yr)
Environmental permitting delays –0.3% North America, Europe Medium-term (2–4 yr)
Trade restrictions and export controls –0.3% Global Short-term (≤2 yr)


Geographic Concentration of HPQ Deposits

Over 80% of the world's ultra-high-purity quartz feedstock has historically originated from a single geological formation near Spruce Pine, North Carolina [8]. Hurricane Helene's 2024 disruption exposed this vulnerability in stark terms, with spot prices for 4N-grade material spiking 40% within weeks. While diversification projects in Norway, Brazil, and Mozambique are underway, most will not reach commercial scale before 2028, leaving the Quartz Market exposed to repeated supply shocks in the interim.

Energy-Intensive Processing Costs

Producing semiconductor-grade fused quartz requires sustained furnace temperatures above 2,000°C, making energy the single largest variable cost—typically 30–35% of total production expense [10]. European producers face electricity prices roughly 2.5 times those of Chinese competitors following the post-2022 energy repricing, compressing margins and slowing capacity additions outside Asia. Carbon-border adjustment mechanisms may partially offset this disparity but add regulatory complexity.

Substitution by Synthetic Alternatives

Sol-gel and chemical vapor deposition processes now produce synthetic silica glass that meets certain optical and semiconductor specifications without natural quartz feedstock [11]. While synthetic routes remain cost-prohibitive for bulk applications, their performance in niche segments—particularly extreme-UV lithography optics—introduces a ceiling on pricing power for the highest-purity natural grades.


Quartz Market Opportunities

African Greenfield Mining Development

Madagascar, Mozambique, and Namibia hold under-explored pegmatite formations with HPQ potential comparable to Spruce Pine geology [8]. Early-stage exploration by Norwegian and Brazilian mining groups suggests commercial-grade deposits could reach 50,000-ton annual output by 2030, diversifying the global supply base and creating cost-competitive feedstock corridors for European and Asian refiners.

Recycled Quartz Feedstock and Circular Processing

Used quartz crucibles from solar ingot production currently enter landfill after a single thermal cycle. Emerging acid-wash and re-fusion technologies can recover up to 60% of spent crucible material at roughly half the cost of virgin HPQ [9]. This circular model addresses both cost and supply-security concerns while aligning with ESG disclosure requirements that institutional investors increasingly apply to Quartz Market participants.

Quantum-Computing Substrate Demand

Quantum processors based on trapped-ion and photonic architectures require ultra-low-defect quartz substrates with surface roughness below 0.3 nm [14]. While the addressable volume remains small, average selling prices for quantum-grade material exceed USD 5,000 per kilogram—orders of magnitude above conventional grades. Early movers in this niche stand to capture disproportionate margins as quantum hardware scales from laboratory to commercial deployment.

Emerging-Market Construction Boom

India's Smart Cities Mission and Southeast Asia's urban infrastructure pipeline are generating demand for engineered stone surfaces and architectural glass, broadening the Quartz Market beyond its traditional industrial base [15]. Residential construction starts across ASEAN economies are projected to grow 7% annually through 2030, creating a volume-driven opportunity distinct from the technology-driven segments that dominate headline growth.

Digital Supply-Chain Platforms and Data Monetization

Real-time quality-tracing platforms—linking mine-site assay data to downstream specification requirements—enable producers to command premium pricing through verified provenance [16]. Blockchain-based chain-of-custody solutions piloted by The Quartz Corp and Sibelco in 2024 reduced customer qualification timelines by 40%, suggesting that data-layer investments can unlock both revenue premiums and procurement efficiency gains across the Quartz Market value chain.


Quartz Market Future Outlook

AI-Driven Semiconductor Demand Supercycle

Artificial intelligence workloads are reshaping chip architectures in ways that directly amplify Quartz Market consumption. Training clusters for large language models require custom silicon running on 3 nm and 2 nm process nodes, each demanding crucibles with contamination profiles below 0.1 ppm total metals [2]. BloombergNEF projects global data-center capital expenditure will exceed USD 400 billion annually by 2028, a significant fraction of which flows upstream into wafer-fabrication consumables, including HPQ crucibles and quartz-ware [17].

Energy-Transition Materials Supercycle

The International Renewable Energy Agency estimates cumulative global solar PV capacity will reach 5,400 GW by 2030 [3]. This expansion locks in structural demand for quartz crucibles, with replacement cycles averaging 200–300 ingot pulls per crucible. Simultaneously, silicon-anode battery chemistries—now entering automotive qualification—introduce a new consumption channel for metallurgical-grade silicon derived from quartz feedstock, connecting the Quartz Market to the electrification trajectory in ways that were negligible a decade ago [7].

ESG and Supply-Chain Transparency Mandates

The EU Corporate Sustainability Reporting Directive and the U.S. SEC climate-disclosure rule are pushing mineral producers to quantify Scope 1–3 emissions at the mine and processing-plant level [12][16]. Quartz Market participants that invest early in auditable carbon accounting and provenance tracing will hold a competitive advantage in customer qualification processes, particularly for semiconductor and solar OEMs that face their own downstream reporting obligations.

Consolidation and Vertical Integration

The Quartz Market has moved from a fragmented artisanal supply toward a mid-concentration structure dominated by fewer than ten vertically integrated producers. Sibelco's acquisition of Covia and The Quartz Corp's ongoing capacity expansions illustrate a consolidation wave driven by customer demand for assured quality and supply continuity [18]. By 2030, the top five producers are expected to control over 55% of global HPQ output, giving them pricing power that smaller competitors will struggle to match.


Quartz Market Segmentation

By Product Type

Segment Key Metric Primary Demand Driver
Silicon Metal 91.0% share (2025) Metallurgical alloys; chemical-grade silicone feedstock
High-Purity Quartz 7.75% CAGR (2026–2035) Semiconductor crucibles; solar ingot pullers
Quartz Crystal USD 540 Million (2025) Optical components; frequency-control devices


Silicon metal overwhelmingly dominates the Quartz Market by volume, consumed primarily in aluminum alloying, silicone chemical production, and polysilicon refining. China's Yunnan and Xinjiang provinces account for the majority of global smelting capacity, where abundant hydroelectric power keeps processing costs 30–40% below competitors in Europe and South America. The segment's massive base means that even modest percentage growth translates into substantial absolute ton increases year over year.

High-purity quartz, while small in volume terms, generates outsized value and is expanding faster than any other product category. The segment's growth is directly tied to tightening impurity specifications in semiconductor and photovoltaic manufacturing. A single 300 mm wafer fab can consume over 200 tons of HPQ-derived crucibles and quartzware annually, and with more than 30 new fabs announced globally between 2024 and 2028, the demand pipeline is well defined and contractually committed [2][4].

By End-User Industry

Segment Key Metric Primary Demand Driver
Electronics & Semiconductor 37.2% share (2025) Wafer fabrication; lithography components
Solar 6.95% CAGR (2026–2035) PV ingot growth; crucible replacement cycles
Building & Construction USD 1,852 Million (2025) Engineered surfaces; architectural glass
Optical Fiber & Telecom 5.85% CAGR (2026–2035) Broadband deployment programs
Automotive USD 699 Million (2025) Sensor substrates; EV powertrain components
Other End-User Industries 3.8% share (2025) Laboratory ware, lighting and general industrial


Electronics and semiconductor end users represent the highest-value demand tier in the Quartz Market, where material specifications translate directly into product yield and device performance. Fab operators qualify HPQ suppliers through multi-year testing protocols, creating high switching costs that benefit incumbent producers. The solar segment is closing the gap in growth terms, driven by crucible volumes that scale linearly with global wafer output and show minimal substitution risk given the absence of viable alternative crucible materials for Czochralski ingot pulling [3].


Regional Market Share Analysis

Region Key Metric Primary Investment Themes
Asia-Pacific 51.2% share (2025) Semiconductor fab expansion; solar ingot capacity; silicon-metal smelting
North America USD 2,216 Million (2025) CHIPS Act reshoring; HPQ mine diversification; defense optics
Europe 17.8% share (2025) CRM Act compliance; optical-fiber deployment; solar manufacturing
South America 4.8% CAGR (2026–2035) Greenfield mining; metallurgical-grade silicon export
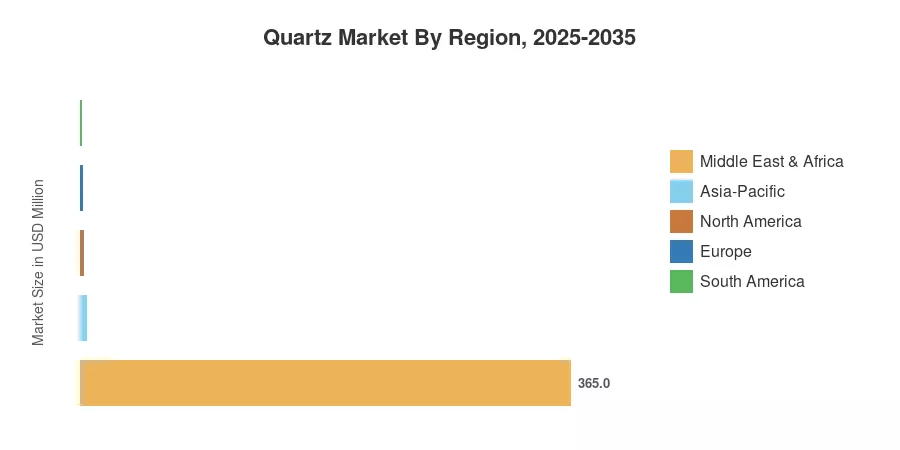
Middle East & Africa USD 365 Million (2025) Construction materials; emerging mining exploration
Total USD 9,850 Million (2025)

The Quartz Market spans five major regions, each shaped by distinct industrial demand profiles and policy environments.


North America

Country Key Metric Key Driver
US 78.4% of regional share CHIPS Act fab investments; Spruce Pine mine operations
Canada 5.35% CAGR Critical-mineral strategy: silicon-metal smelting in Quebec
Mexico USD 95 Million (2025) Construction-grade demand; cross-border supply chains


The United States remains the anchor of the North American Quartz Market, with semiconductor-grade demand concentrated around new fabrication complexes in Arizona and Ohio. Canada's 2024 Critical Minerals Strategy designated silicon and high-purity quartz as priority materials, unlocking exploration tax credits in British Columbia and Quebec. Mexico's contribution is largely construction-driven, with countertop and architectural glass demand tracking residential housing starts in Monterrey and Guadalajara metro areas.

Europe

Country Key Metric Key Driver
Germany 26.3% of regional share Automotive sensor demand; optical-fiber backbone
UK USD 185 Million (2025) Semiconductor strategy; defense optics procurement
France 5.80% CAGR Nuclear-grade silica; solar manufacturing ramp
Italy 11.5% of regional share Engineered-surface manufacturing hub
Spain USD 110 Million (2025) Solar PV manufacturing expansion
Nordic Countries 6.10% CAGR HPQ mining in Norway; green energy infrastructure
Russia 7.2% of regional share Silicon-metal export; domestic construction
Rest of Europe USD 145 Million (2025) Mixed construction and industrial demand


The dual forces of renewable-energy buildout and digital-infrastructure investment shape Europe's Quartz Market. Germany anchors regional consumption through its automotive and telecommunications sectors, while the Nordic countries are emerging as strategic HPQ suppliers following The Quartz Corp's capacity expansions in Drag, Norway. The EU Critical Raw Materials Act is compelling member states to establish strategic reserves, creating a policy-driven demand floor through the end of the decade [5].

Asia-Pacific

Country Key Metric Key Driver
China 58.5% of regional share Silicon-metal smelting; solar ingot production; construction
India 6.90% CAGR Smart Cities Mission; solar manufacturing PLI scheme
Japan USD 620 Million (2025) Semiconductor-grade fused quartz; optical components
South Korea 8.4% of regional share Memory-chip fab expansion; display glass
ASEAN 5.95% CAGR Construction boom; emerging solar manufacturing
Rest of Asia-Pacific USD 180 Million (2025) Mining exploration; metallurgical demand


Asia-Pacific dominates the global Quartz Market by a wide margin, anchored by China's massive silicon-metal smelting capacity in Yunnan and Xinjiang provinces. Japan's contribution is quality-driven rather than volume-driven, with Shin-Etsu and Tosoh producing semiconductor-grade crucibles that command prices 8–10 times those of metallurgical-grade material. India represents the fastest-growing national opportunity, with its Production-Linked Incentive scheme for solar cells and modules expected to add 30 GW of domestic manufacturing capacity by 2030, each gigawatt requiring approximately 2,500 tons of crucible-grade feedstock [3][15].

South America

Country Key Metric Key Driver
Brazil 72.1% of regional share HPQ exploration in Minas Gerais; silicon-metal smelting
Argentina USD 48 Million (2025) Metallurgical-grade silicon; construction materials
Rest of South America 4.15% CAGR Nascent mining activity; regional construction demand


Brazil is the fulcrum of South America's Quartz Market, combining established silicon-metal smelting operations with emerging HPQ exploration. Brazilian geological surveys have identified pegmatite formations in Minas Gerais with purity levels approaching Spruce Pine benchmarks, attracting joint-venture interest from Norwegian and Japanese firms seeking supply diversification [8].

Middle East & Africa

Country Key Metric Key Driver
Saudi Arabia 28.5% of regional share Vision 2030 construction; industrial diversification
UAE USD 42 Million (2025) Premium construction surfaces; re-export logistics hub
South Africa 4.50% CAGR Mining sector; metallurgical-grade production
Egypt 15.8% of regional share Construction materials; emerging solar installations
Rest of MEA USD 62 Million (2025) Exploration-stage mining; infrastructure buildout


The Middle East & Africa region contributes a modest but growing share of the Quartz Market, with Saudi Arabia's Vision 2030 infrastructure program anchoring construction-driven demand. Mozambique and Madagascar are attracting early-stage HPQ exploration investment, with geological assessments suggesting deposits capable of producing semiconductor-grade material within the next five years [8].


Quartz Market By Region, 2025-2035

Competitive Benchmarking

Quartz Market has a medium level of concentration with an estimated Herfindahl-Hirschman Index of about 1,200–1,500. The top five businesses account for an estimated 48-55% of global revenues, in a landscape where a few vertically integrated producers compete with regional smelters and specialty refiners. HPQ continues to face high barriers to entry in the segment due to geological scarcity, multi-year customer qualification periods and capital-intensive purification infrastructure.

Company Est. Revenue Share Range Key Offerings Strategic Positioning
Sibelco ~10–14% Silicon metal; HPQ feedstock; industrial minerals Vertically integrated global supplier with mine-to-market chain
The Quartz Corp ~8–11% Ultra-high-purity quartz; custom blends JV between Imerys and Norsk Mineral; Spruce Pine and Norway assets
Jiangsu Pacific Quartz ~7–10% Fused quartz products; crucibles; tubes Leading Chinese HPQ processor for semiconductor and solar
Momentive Technologies ~5–8% Fused quartz; engineered glass Specialty materials for semiconductor lithography and optics
Heraeus Conamic ~4–7% High-purity quartz glass; optical blanks Premium-grade supplier to EUV lithography and telecom
Shin-Etsu Quartz Products ~4–6% Semiconductor-grade crucibles; quartz ware Integrated with Shin-Etsu Chemical's silicon wafer supply chain
Caesarstone ~3–5% Engineered quartz surfaces; countertops Consumer and commercial building materials brand
Cosentino (Silestone) ~3–5% Quartz surfaces: architectural solutions Global surfaces brand with recycled-content innovation
Russian Quartz LLC ~2–4% HPQ concentrates; optical-grade material Kyshtym deposit; limited Western market access post-2022
Tosoh Quartz ~2–4% Fused quartz for semiconductor and optical applications Japanese specialty producer with tight fab-customer integration


Recent News & Developments


  • European Commission (December 2023): Published the final text of the Critical Raw Materials Act, formally classifying silicon metal as a strategic raw material and establishing 2030 stockpiling and domestic-sourcing targets [5].


  • The United States (August 2025): The United States imposed a 50% tariff on engineered quartz imports from India, prompting domestic producers to seek alternative markets while facing price competition from Chinese suppliers.


Quartz Market Report Scope

Parameter Detail
Market Scope Global Quartz Market, including all product types, end-user industries, and five geographic regions
Study Period 2021–2035
Historical Period 2021–2024
Base Year 2025
Forecast Period 2026–2035
CAGR (2026–2035) 6.30%
2025 Market Size USD 9,850 Million
2035 Market Size USD 18,150 Million
Fastest Growing Segment (Product Type) High-Purity Quartz (7.75% CAGR)
Fastest Growing Segment (End-User) Solar (6.95% CAGR)
Companies Profiled 10
Valuation Currency USD Million


FAQs

What purity grade should buyers specify for semiconductor crucible applications in the Quartz Market?
Semiconductor fabs typically require 4N (99.99%) or higher SiO₂ purity, with total alkali-metal contamination below 1 ppm. Buyers should request full impurity certificates and conduct on-site audits before qualifying any supplier [2].
How does the Quartz Market's pricing structure differ between long-term contracts and spot purchases?
Long-term contracts—typically 3–5 years—offer 15–25% discounts over spot pricing but require volume commitments. Spot markets remain volatile, especially for HPQ grades affected by supply disruptions [8].
What due diligence steps should investors evaluate before entering the Quartz Market?
Investors should assess deposit geology, permitting timelines, customer qualification status, and energy-cost exposure. HPQ projects require 3–5 years from exploration to commercial output [10].
How do tariff and export-control regimes affect cross-border Quartz Market procurement?
U.S. export controls on semiconductor equipment indirectly tighten HPQ trade flows, while China's export licensing for silicon metal creates periodic supply uncertainty. Buyers should maintain multi-region sourcing strategies [13].
What recycling infrastructure exists to recover spent quartz crucibles in the Quartz Market?
Acid-wash and re-fusion processes can reclaim 50–60% of spent crucible material at roughly half the cost of virgin HPQ. Adoption remains limited to a handful of pilot facilities in China and Norway [9].
How does the Quartz Market compare to synthetic fused-silica alternatives on a total-cost basis?
Synthetic routes cost 3–5 times more per kilogram than natural HPQ for equivalent purity levels. They remain viable only for niche EUV optics where defect density requirements exceed natural-quartz capabilities [11].
What workforce and safety considerations apply to Quartz Market processing facilities?
Silica dust exposure requires OSHA-compliant ventilation and monitoring systems, with permissible exposure limits at 50 µg/m³ for respirable crystalline silica. Automated material handling reduces both risk and labor costs [12].    
Author
Author
Author Profile
Chitranshi Jaiswal LinkedIn
Team Lead - Research
Chitranshi is a Team Leader in the Chemicals & Materials (CnM) and Energy & Power (EnP) domains, with 6+ years of experience in market research. She leads and mentors teams to deliver cross-domain projects that equip clients with actionable insights and growth strategies. She is skilled in market estimation, forecasting, competitive benchmarking, and both primary & secondary research, enabling her to turn complex data into decision-ready insights. An engineer and MBA professional, she combines technical expertise with strategic acumen to solve dynamic market challenges. Chitranshi has successfully managed projects that support market entry, investment planning, and competitive positioning, while building strong client relationships. Certified in Advanced Excel & Power BI she leverages data-driven approaches to ensure accuracy, clarity, and impactful outcomes.

Research Approach


Secondary Research

The secondary research process involved comprehensive analysis of geological survey databases, mining regulation repositories, peer-reviewed materials science journals, industrial mineral publications, and authoritative industrial organizations. Key sources included the United States Geological Survey (USGS), British Geological Survey (BGS), Geological Survey of India (GSI), China Geological Survey (CGS), National Minerals Information Center (NMIC), Semiconductor Industry Association (SIA), European Semiconductor Industry Association (ESIA), SEMI Global, American Ceramic Society (ACerS), National Institute of Standards and Technology (NIST), European Committee for Standardization (CEN), American Society for Testing and Materials (ASTM) International, International Organization for Standardization (ISO), Occupational Safety and Health Administration (OSHA) mining safety databases, Mine Safety and Health Administration (MSHA), National Industrial Sand Association (NISA), Industrial Minerals Association – North America (IMA-NA), European Industrial Minerals Association (IMA-Europe), China Non-Metallic Minerals Industry Association, Minerals Council of Australia (MCA), Natural Resources Canada (NRCan), European Commission's Raw Materials Information System (RMIS), National Bureau of Statistics of China, and trade statistics from UN Comtrade and International Trade Centre (ITC). These sources were utilized to collect mineral reserve data, production statistics, purity grade specifications, import/export trade flows, regulatory compliance frameworks, and technology adoption trends for high-purity quartz, quartz surfaces and tiles, fused quartz products, quartz crystal, and silicon metal applications.


Primary Research

In order to gather both qualitative and quantitative insights, supply-side and demand-side stakeholders were interviewed during the primary research process. Managing directors, vice presidents of mining operations, chief geologists, plant managers, and sales directors from quartz mining firms, high-purity quartz processors, producers of engineered stone, and suppliers of semiconductor materials were examples of supply-side sources. Procurement chiefs from semiconductor foundries (TSMC, Samsung, Intel), solar panel makers, distributors of building materials, architectural specification consultants, kitchen and bathroom designers, and quality control managers from electronics OEMs were examples of demand-side sources. Primary study obtained information on supply chain limitations, pricing volatility mechanisms, and substitution material risks. It also validated product purity criteria and confirmed capacity growth deadlines.

Primary Respondent Breakdown:

By Designation: C-level Primaries (28%), Director Level (32%), Others (40%)

By Region: North America (32%), Europe (30%), Asia-Pacific (33%), Rest of World (5%)

By Industry Vertical: Electronics & Semiconductor (45%), Building & Construction (25%), Solar Energy (18%), Others (12%)


Market Size Estimation

Global market valuation was derived through production volume mapping and value chain analysis. The methodology included:

Identification of 65+ key mining and processing operations across North America, Europe, Asia-Pacific, Africa, and Latin America

Product mapping across high-purity quartz (semiconductor grade, solar grade, lighting grade), quartz surfaces and tiles, quartz glass, quartz crystal, quartz sand, and silicon metal feedstock

Analysis of reported and modeled annual production capacities, yield rates, and realized pricing specific to quartz product portfolios

Coverage of producers and processors representing 75-80% of global market supply in 2024

Extrapolation using bottom-up (production volume × ASP by purity grade and region) and top-down (miner/processor revenue validation) approaches to derive segment-specific valuations, incorporating adjustments for vertical integration effects and captive consumption in semiconductor manufacturing

Download Free Sample

Kindly complete the form below to receive a free sample of this Report

Download PDF ×

We do not share your information with anyone. However, we may send you emails based on your report interest from time to time. You may contact us at any time to opt-out.

















