Recycled Plastic Granules Market (2026 - 2035)

Recycled Plastic Granules Market Research Report - By Resin Type (Polyethylene Terephthalate (PET), High-Density Polyethylene (HDPE), Low-Density Polyethylene (LDPE), Polypropylene (PP), Others), By Application (Automotive, Packaging, Construction, Consumer Products, Others), By End-Use Sector (Industrial, Consumer, Construction, Electronics, Others), By Processing Type (Mechanical Recycling, Chemical Recycling, Other Advanced Technologies) and By Regional (North America, Europe, South America, Asia Pacific, Middle East and Africa) - Forecast to 2035
ID: MRFR/CnM/24262-HCR
111 Pages
Chitranshi Jaiswal
Last Updated: July 08, 2026
Recycled Plastic Granules Market
Market Size
Forecast Period2026-2035
CAGR (2026-2035)6.80%
2025 Market SizeUSD 67.50 billion
2035 Market SizeUSD 130.38 billion
Key Players
Veolia Environnement
Indorama Ventures
Far Eastern New Century
Plastipak Holdings
KW Plastics
MBA Polymers
Opportunities
  • Food-Grade rPET Capacity Expansion
  • Automotive Closed-Loop Programs
  • Digital Traceability and Certification Platforms

Recycled Plastic Granules Market Summary

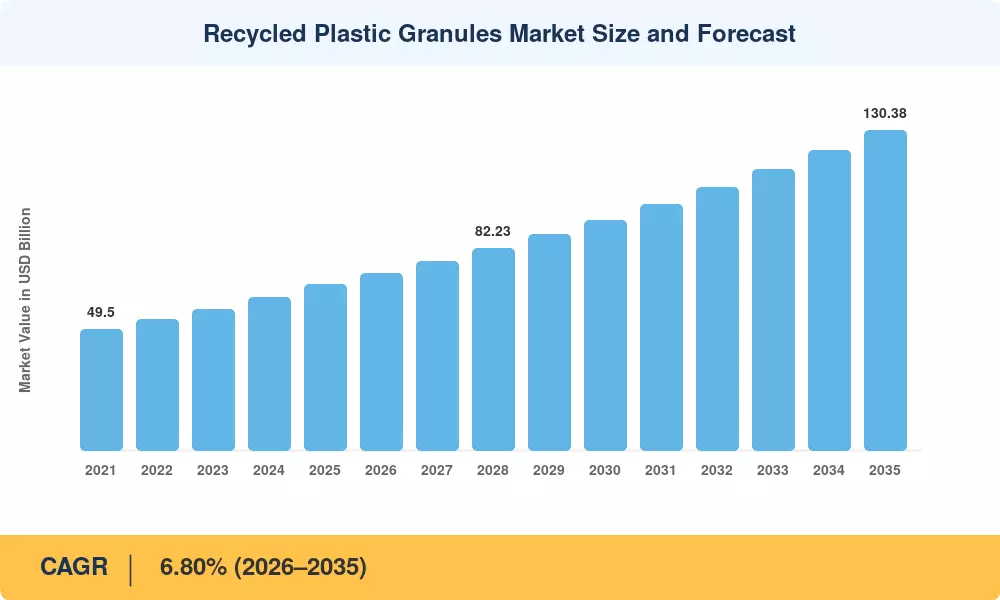
The recycled plastic granules market reached an estimated USD 67.50 billion in 2025, with the forecast period beginning at USD 72.09 billion in 2026 and climbing to USD 130.38 billion by 2035 at a compound annual growth rate (CAGR) of 6.80%. Two catalysts anchor this trajectory: the European Union's Packaging and Packaging Waste Regulation (PPWR), which enforces minimum recycled content thresholds across plastic packaging categories starting in 2026, and the rapid expansion of Extended Producer Responsibility (EPR) frameworks across Southeast Asia [2]. Brand owners across consumer goods, automotive, and electronics have moved from voluntary pledges to binding procurement commitments, creating a structural demand floor for recycled plastic granule market participants.

The technology revolution is changing the supply side of the recycled plastic granules industry. Near-infrared (NIR) and AI-driven sorting systems are being added to legacy mechanical sorting lines that have long been hampered by contamination and color limits, driving food-grade yield rates above 85% [3]. Commercial-timeline facilities for enzymatic PET depolymerization guarantee virgin-equivalent production from mixed color bales. Chemical recycling capital spending across stated projects exceeded USD 8.5 billion globally through 2024 [4], suggesting investor confidence in feedstock diversification beyond mechanical processing.


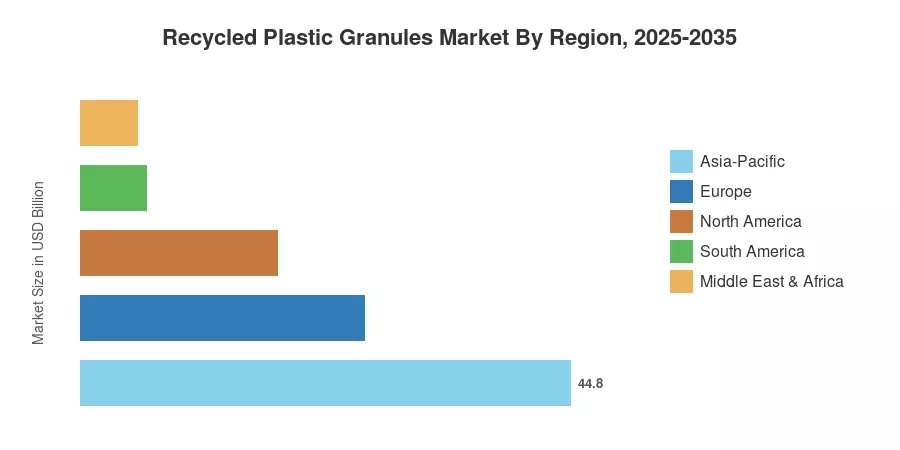
The Asia-Pacific region represents around 44.8% of the recycled plastic granules market, owing to the statewide garbage sorting laws in China and the growing collection infrastructure in India. Europe has the second-highest stake at around 26.0%, driven by PPWR mandates and deposit-return scheme expansions. The third largest region is North America at 18.0%, with U.S. EPA recycling infrastructure funds allowing expansion of processing capacity [5]. Circular economy legislation tightening across the globe during the projected window will see the recycled plastic granules market see amplified demand.


Key Report Takeaways

• By Polymer Type

  • Polyethylene accounted for 31.5% of the recycled plastic granules market share in 2025, reflecting its dominance in flexible packaging and agricultural film recovery.
  • The "Others" polymer segment (including polypropylene, polystyrene, and engineering resins) is projected to grow at an 8.4% CAGR through 2035, fueled by automotive lightweighting programs.

• By the Recycling Process

  • Mechanical recycling held 76.2% of processing volume in 2025, remaining the cost-effective backbone of the recycled plastic granules market.
  • Chemical and advanced recycling is projected to expand at a 9.4% CAGR through 2035 as pyrolysis and depolymerization plants scale.

• By Product Form

  • Flakes captured 70.8% of market volume in 2025, serving as the primary intermediate feedstock.
  • Pellets represent the fastest-growing product form at a 8.5% CAGR, driven by converter demand for drop-in replacements.

• By End-Use Application

  • Packaging held 42.0% of the market share in 2025, anchored by mandatory content regulations.
  • Automotive applications are projected to grow at 11.0% CAGR through 2035 as OEM circularity targets expand.

• By Geography

  • Asia-Pacific commanded 44.8% of the recycled plastic granules market in 2025.
  • Europe held approximately 26.0% share, led by regulatory mandates and mature collection systems.


Market Size and Forecast (2021–2035)

MRFR’s predictions are based on personal interviews with over 120 industry participants, trade association data, regulatory filings, and proprietary demand modeling calibrated against historical shipment volumes and capacity announcements.
Recycled Plastic Granules Market Size and Forecast
Our Impact
Enabled $4.3B Revenue Impact for Fortune 500 and Leading Multinationals
Partnering with 2000+ Global Organizations Each Year
30K+ Citations by Top-Tier Firms in the Industry

Driver Impact Analysis

Driver ~% Impact on CAGR Geographic Relevance Impact Timeline
Mandatory recycled content legislation +1.8% Europe, North America Short-term (≤2 yr)
EPR framework proliferation +1.2% Asia-Pacific, South America Medium-term (2–4 yr)
Brand owner voluntary pledges and procurement contracts +0.9% Global Short-term (≤2 yr)
Chemical recycling technology maturation +1.0% Europe, North America Long-term (≥4 yr)
AI-enabled sorting and yield optimization +0.7% Global Medium-term (2–4 yr)
Automotive sector circularity mandates +0.6% Europe, Asia-Pacific Medium-term (2–4 yr)
Deposit-return scheme expansion +0.5% Europe, North America Short-term (≤2 yr)


Mandatory Recycled Content Legislation

The EU's PPWR requires that contact-sensitive PET packaging contain at least 25% recycled content by 2025 and 30% by 2030, with all plastic packaging reaching 35% by 2030 and 65% by 2040 [2]. These binding thresholds convert recycled granules from an optional sustainability input into a compliance necessity. The recycled plastic granules market benefits directly because converters must secure long-term supply contracts to guarantee feedstock availability, creating stable revenue visibility for recyclers.

Extended Producer Responsibility Proliferation

Indonesia, Thailand, and Vietnam enacted or expanded EPR legislation between 2023 and 2025, collectively covering over 450 million consumers [6]. These frameworks require packaging producers to finance collection and recycling infrastructure, channeling an estimated USD 2.1 billion into waste management systems across the three countries by 2028. The recycled plastic granules market in Asia-Pacific is the primary beneficiary as collection rates rise from sub-20% to targeted levels above 40%.

Chemical Recycling Technology Maturation

Pyrolysis-based and depolymerization-based chemical recycling plants announced through 2024 represent combined annual processing capacity exceeding 3.2 million metric tons [4]. The recycled plastic granules market gains from chemical recycling because it processes contaminated and mixed-polymer streams that mechanical lines reject, expanding the usable feedstock pool by an estimated 25–30%.

AI-Enabled Sorting and Yield Optimization

Modern materials recovery facilities deploying hyperspectral imaging and machine-learning classifiers report sorting accuracy above 95% for key polymer streams, up from 80–85% with conventional NIR alone [3]. Higher purity translates directly into higher-value output for the recycled plastic granules market, lifting food-grade yield rates and reducing downcycling.


Restraints Impact Analysis

The following restraint impacts are directional estimates of drag on growth momentum, not precise CAGR subtractions.

Restraint ~% Impact on CAGR Geographic Relevance Impact Timeline
Feedstock quality and contamination variability –0.9% Global Short-term (≤2 yr)
Virgin resin price volatility is undermining recycled competitiveness –0.7% Global Medium-term (2–4 yr)
Fragmented collection infrastructure in developing markets –0.6% Africa, South America Long-term (≥4 yr)
Food-contact regulatory approval bottlenecks –0.5% North America, Asia-Pacific Medium-term (2–4 yr)
Capital intensity of advanced recycling facilities –0.4% Global Long-term (≥4 yr)


Feedstock Quality and Contamination Variability

Mixed-stream collection systems in North America yield contamination rates averaging 16–25%, compared with 5–8% in European deposit-return programs [13]. The recycled plastic granules market faces throughput penalties when bale quality fluctuates, as recyclers must increase wash-line cycles and reject rates, raising processing costs by an estimated USD 40–60 per metric ton.

Virgin Resin Price Volatility

When crude oil prices drop below USD 60 per barrel, virgin polyethylene and polypropylene become cost-competitive with recycled alternatives, squeezing recycler margins. The recycled plastic granules market experienced this dynamic in mid-2023 when Brent crude fell to USD 72 and spot recycled HDPE premiums widened to 15–20% above virgin equivalents, slowing spot purchasing outside mandated volumes.

Food-Contact Regulatory Approval Bottlenecks

The U.S. FDA's letter-of-no-objection process for recycled-content food-contact applications takes 12–18 months on average, and fewer than 120 recycling processes hold active approvals [16]. This regulatory gate limits how quickly the recycled plastic granules market can convert mechanical capacity into food-grade output.


Recycled Plastic Granules Market Opportunities

Food-Grade rPET Capacity Expansion

Global food-grade rPET demand is projected to outstrip supply by 1.5 million metric tons annually by 2028 as PPWR Phase II thresholds take effect [8]. Recyclers investing in super-clean decontamination lines stand to capture premium pricing 20–30% above standard flake-grade output.

Automotive Closed-Loop Programs

European and Japanese automakers have announced targets requiring 25–30% recycled plastic content in new vehicles by 2030 [11]. The recycled plastic granules market can serve under-hood, interior trim, and bumper applications where engineering-grade recycled polypropylene meets OEM specifications.

Digital Traceability and Certification Platforms

Blockchain-based mass-balance certification platforms — including ISCC Plus and RecyClass — are enabling brand owners to verify chain-of-custody for recycled content claims [17]. The recycled plastic granules market benefits as traceability reduces greenwashing risk and unlocks premium pricing tiers for certified material.

Emerging Market Collection Infrastructure

Sub-Saharan Africa and South Asia generate over 70 million metric tons of plastic waste annually, yet formal collection rates remain below 15% [15]. Public-private partnerships modeled on India's Swachh Bharat mission present a significant volume opportunity for the recycled plastic granules market as collection infrastructure scales.

Flexible Packaging Recycling Breakthroughs

Multi-layer flexible packaging — historically unrecyclable through mechanical processes — is now addressable through solvent-based purification and compatibilizer technologies [18]. This opens an estimated 18–22 million metric ton feedstock pool globally, representing a high-growth frontier for the recycled plastic granules market.


Recycled Plastic Granules Market Future Outlook

Digital Twinning and Process Optimization

Recycling facilities are adopting digital twin platforms that model material flow, energy consumption, and contamination pathways in real time [3]. These systems enable predictive maintenance and throughput optimization, reducing downtime by 15–20% and improving the cost competitiveness of the recycled plastic granules market through the forecast period.

Regulatory Convergence Toward Global Standards

The UNEP Global Plastics Treaty, expected to finalize binding obligations by 2026, will harmonize recycled content definitions, testing protocols, and trade classifications across signatory nations [19]. This convergence eliminates fragmented compliance costs and expands addressable demand for the recycled plastic granules market by creating a level regulatory playing field.

Electrification of Recycling Operations

Energy-intensive extrusion and pelletization lines are transitioning to electrified heating elements powered by on-site solar and grid renewables, reducing Scope 1 emissions by 40–60% per facility [20]. The recycled plastic granules market benefits as brand owners increasingly weigh embodied carbon alongside recycled content in procurement scorecards.

Platform Economics and Material Marketplaces

Digital procurement platforms connecting recyclers, converters, and brand owners are reducing transaction friction and enabling spot and forward pricing transparency [17]. The recycled plastic granules market will increasingly operate through these platforms, with aggregated quality data enabling dynamic pricing based on polymer purity, color, and food-contact certification.


Recycled Plastic Granules Market Segmentation

By Polymer Type

Segment Key Metric Primary Demand Driver
Polyethylene 31.5% share (2025) Film and flexible packaging recovery
Polyethylene Terephthalate USD 19.85 billion (2025) Bottle-to-bottle closed-loop systems
Others (PP, PS, engineering resins) 8.4% CAGR (2026–2035) Automotive and electronics applications


Polyethylene dominates the recycled plastic granules market by polymer type because PE films and rigid containers represent the largest volume stream in municipal and commercial waste. Mechanical recycling of HDPE and LDPE is well-established, and converters have mature specifications for blown film and injection molding applications using recycled PE granules.

PET holds the highest value per kilogram in the recycled plastic granules market due to food-contact demand and bottle-to-bottle loops. The segment benefits from deposit-return schemes that deliver clean, mono-material bales with contamination rates below 3%.

By the Recycling Process

Segment Key Metric Primary Demand Driver
Mechanical Recycling 76.2% share (2025) Cost efficiency and established infrastructure
Chemical/Advanced Recycling 9.4% CAGR (2026–2035) Mixed-polymer and contaminated feedstock processing
Others USD 2.40 billion (2025) Solvent-based purification, enzymatic processes


Mechanical recycling remains the workhorse of the recycled plastic granules market, processing the vast majority of PE, PET, and PP streams through wash, shred, melt, and pelletize sequences. Capital costs per ton of installed capacity run 60–70% lower than chemical alternatives.

Chemical recycling is the fastest-growing process segment within the recycled plastic granules market because it unlocks feedstock that mechanical lines cannot handle — multi-layer films, black plastics, and heavily contaminated post-industrial scrap.

By Product Form

Segment Key Metric Primary Demand Driver
Flakes 70.8% share (2025) Intermediate feedstock for converters and compounders
Pellets 8.5% CAGR (2026–2035) Drop-in replacement for virgin resin in extrusion/molding
Powder USD 1.80 billion (2025) Rotational molding and coating applications


Flakes represent the largest product form in the recycled plastic granules market as they serve as the primary intermediate traded between recyclers and downstream compounders. Pellets are the fastest-growing form because they offer converters a direct substitute for virgin resin without additional in-house processing.

By End-Use Application

Segment Key Metric Primary Demand Driver
Packaging 42.0% share (2025) PPWR and brand recycled content commitments
Building & Construction USD 12.15 billion (2025) Lumber alternatives, pipe, insulation board
Automotive 11.0% CAGR (2026–2035) OEM circularity targets, lightweighting
Others (textiles, electronics, agriculture) 7.2% CAGR (2026–2035) Fiber-to-fiber recycling, e-waste recovery


Packaging is the anchor application for the recycled plastic granules market, consuming the largest volume across rigid containers, flexible films, and foodservice items. Regulatory mandates create non-discretionary demand that insulates this segment from virgin resin price cycles.

Automotive represents the fastest-growing end-use in the recycled plastic granules market as European and Asian automakers embed recycled polypropylene and polyamide into bumpers, underbody shields, wheel-arch liners, and interior trim panels to meet end-of-life vehicle recycling targets [11].


Regional Market Share Analysis

Region Key Metric Primary Investment Themes
Asia-Pacific 44.8% share (2025) EPR expansion, waste-sorting mandates, capacity build-out
Europe 26.0% share (2025) PPWR compliance, deposit-return schemes, chemical recycling
North America 18.0% share (2025) EPA grants, state-level content mandates, and MRF modernization
South America 6.0% share (2025) Informal sector integration, EPR adoption
Middle East & Africa 5.2% share (2025) Waste management privatization, petrochemical diversification
Total 100%

The recycled plastic granules market spans five major regions, each shaped by distinct regulatory, infrastructure, and demand dynamics.


North America

Country Key Metric Key Driver
US 78.5% of regional share State-level recycled content mandates (California SB 54)
Canada 13.2% of regional share Federal plastics registry and EPR harmonization
Mexico 8.3% of regional share General Law for Waste Prevention and Management Reform


The United States drives the North American recycled plastic granules market through state legislation, with California, New Jersey, and Washington enacting minimum recycled content requirements for rigid packaging between 2023 and 2025 [5]. U.S. EPA Solid Waste Infrastructure for Recycling grants allocated over USD 275 million through 2024 to modernize municipal materials recovery facilities, directly expanding the feedstock supply for domestic recyclers.

Europe

Country Key Metric Key Driver
Germany 7.1% CAGR (2026–2035) Dual system maturity, chemical recycling investment
UK 6.9% CAGR (2026–2035) Plastic Packaging Tax at GBP 210.82/tonne
France USD 4.85 billion (2025) AGEC Law anti-waste mandates
Italy 6.5% CAGR (2026–2035) CONAI consortium collection efficiency
Spain USD 2.10 billion (2025) Royal Decree on Packaging transposition
Nordic Countries 7.3% CAGR (2026–2035) Deposit-return leadership, high collection rates
Russia USD 0.95 billion (2025) EPR reform and domestic capacity investment
Rest of Europe 6.4% CAGR (2026–2035) EU accession alignment requirements


Europe's recycled plastic granules market is defined by regulatory density. The PPWR creates a continent-wide demand floor, while national instruments like the UK's Plastic Packaging Tax (GBP 210.82 per tonne for packaging with less than 30% recycled content) and France's AGEC Law add punitive cost incentives for virgin resin usage [2].

Asia-Pacific

Country Key Metric Key Driver
China 38.2% of regional share National waste-sorting mandate across 46 pilot cities
India 8.8% CAGR (2026–2035) EPR notification 2022 and Swachh Bharat integration
Japan USD 4.20 billion (2025) Plastic Resource Circulation Act enforcement
South Korea 7.5% CAGR (2026–2035) Advanced sorting technology deployment
ASEAN 9.2% CAGR (2026–2035) EPR legislation in Indonesia, Thailand and Vietnam
Rest of Asia-Pacific USD 1.85 billion (2025) Collection formalization and export restrictions


Asia-Pacific leads the recycled plastic granules market in both volume and growth velocity. China's mandatory household waste sorting, rolled out across 46 cities and expanding nationwide, channels an estimated 25 million additional metric tons of recyclable plastics into the formal processing stream annually [6].

South America

Country Key Metric Key Driver
Brazil 62.0% of regional share PNRS policy implementation, cooperative integration
Argentina 21.5% of regional share GIRSU national waste management program
Rest of South America 16.5% of regional share Municipal recycling program expansion


Brazil anchors the South American recycled plastic granules market, where an estimated 800,000 informal waste pickers supply over 90% of recyclable feedstock [15]. Government and NGO programs are formalizing cooperatives and investing in mechanical sorting infrastructure to improve yield and worker safety.

Middle East & Africa

Country Key Metric Key Driver
Saudi Arabia 8.2% CAGR (2026–2035) Vision 2030 waste diversion targets
UAE 7.8% CAGR (2026–2035) Dubai Waste Management Strategy 2041
South Africa 35.0% of regional share Section 18 EPR regulations
Egypt 7.5% CAGR (2026–2035) National Solid Waste Management Program
Rest of MEA USD 0.72 billion (2025) Privatization of municipal waste services


South Africa's Section 18 EPR regulations, effective since 2021, have driven measurable increases in PET and PE collection rates, making it the most mature recycled plastic granules market in the MEA region [15]. Saudi Arabia's Vision 2030 targets 94% waste diversion from landfill by 2035, creating a significant greenfield investment opportunity.


Recycled Plastic Granules Market By Region, 2025-2035

Competitive Benchmarking

The recycled plastic granules market has a moderate level of concentration, with the top five competitors having 22-28% of the market revenue share. The competitive field includes vertically integrated waste management conglomerates, pure-play recyclers, and petrochemical firms that have acquired or created recycling assets. The market is assessed to be somewhat fragmented (800–1,200) based on Herfindahl-Hirschman Index (HHI) measures, indicative of the regional character of feedstock collection and the capital-intensive nature of processing infrastructure.

Company Est. Revenue Share Range Key Offerings Strategic Positioning
Veolia Environnement ~5–8% rPET, rHDPE pellets, chemical recycling Integrated waste-to-resource value chain
Indorama Ventures ~4–7% Bottle-grade rPET, fiber-grade flake Largest global PET producer with recycling integration
Far Eastern New Century ~3–5% rPET chips, recycled polyester staple fiber Asia-Pacific vertical integration
Plastipak Holdings ~3–5% Clean-stream rPET, rigid container recycling Closed-loop partnership model with brand owners
KW Plastics ~2–4% rHDPE, rPP pellets Largest U.S. HDPE and PP recycler
MBA Polymers ~2–3% Engineering-grade recycled plastics from e-waste Automotive and electronics-grade output
PreZero (Schwarz Group) ~2–4% rPE, rPP, sorting technology Retail-integrated collection and recycling
Biffa ~1–3% rHDPE, mixed plastics processing UK collection and processing infrastructure
Envision Plastics ~1–2% HDPE recycled resin (EcoPrime) Post-consumer HDPE specialist
Greentech ~1–2% rPET flake and pellet Mediterranean collection and processing


Recent News & Developments


  • Carbios (April 2024): Broke ground on a 50,000 metric ton per year enzymatic PET recycling plant in Longlaville, France, with commercial production targeted for 2026 [4].


  • U.S. EPA (September 2023): Awarded USD 73 million in Solid Waste Infrastructure for Recycling grants across 25 states to improve sorting and processing equipment at municipal recycling facilities [5].


Recycled Plastic Granules Market Report Scope

Parameter Detail
Market Scope Global recycled plastic granules market across all polymer types, recycling processes, product forms, and end-use applications
Study Period 2021–2035
CAGR 6.80% (2026–2035)
Base Year Market Size USD 67.50 billion (2025)
Forecast Endpoint Market Size USD 130.38 billion (2035)
Fastest Growing Segments Chemical/advanced recycling (by process); Automotive (by end-use); Pellets (by product form)
Companies Profiled Veolia, Indorama Ventures, Far Eastern New Century, Plastipak, KW Plastics, MBA Polymers, PreZero, Biffa, Envision Plastics, Greentech
Valuation Currency USD billion


FAQs

What minimum recycled content certification should buyers require when sourcing recycled plastic granules?
Buyers should require ISCC Plus or EuCertPlast certification, which verify chain-of-custody and mass-balance accounting [17]. These standards are recognized by PPWR and most brand sustainability frameworks.
How does the price premium for food-grade recycled PET granules compare to technical-grade output?
Food-grade rPET pellets trade at a 20–35% premium over technical-grade flake due to super-clean decontamination and FDA/EFSA compliance costs [8]. This premium has widened as PPWR mandates increased demand.
What blending ratios do converters typically use when incorporating recycled plastic granules into production?
Most converters blend 25–50% recycled granules with virgin resin for rigid packaging, while non-food applications can reach 100% recycled content [9]. Blending ratios depend on mechanical properties and color specifications.
How do recycled plastic granule market participants manage feedstock supply volatility?
Leading recyclers secure supply through long-term offtake contracts with municipalities and deposit-return operators, supplemented by spot market purchases [13]. Vertical integration into collection reduces exposure to bale price swings.
What is the typical payback period for a greenfield mechanical recycling plant?
A mid-scale mechanical recycling facility processing 30,000 metric tons annually typically achieves payback within 4–6 years, depending on regional feedstock costs and output grade [22]. Chemical recycling plants require 7–10 years.
How do automotive OEMs qualify recycled plastic granules for structural and interior components?
OEMs require recycled granules to pass material datasheets matching virgin-grade specifications for tensile strength, impact resistance, and thermal stability [11]. Qualification testing cycles typically run 6–12 months.
What role do digital material passports play in the procurement of recycled plastic granules?
Digital passports embed polymer composition, source batch, and processing history into each shipment's QR-tagged documentation [17]. They reduce quality disputes and enable automated compliance reporting for brand audits.    
Author
Author
Author Profile
Chitranshi Jaiswal LinkedIn
Team Lead - Research
Chitranshi is a Team Leader in the Chemicals & Materials (CnM) and Energy & Power (EnP) domains, with 6+ years of experience in market research. She leads and mentors teams to deliver cross-domain projects that equip clients with actionable insights and growth strategies. She is skilled in market estimation, forecasting, competitive benchmarking, and both primary & secondary research, enabling her to turn complex data into decision-ready insights. An engineer and MBA professional, she combines technical expertise with strategic acumen to solve dynamic market challenges. Chitranshi has successfully managed projects that support market entry, investment planning, and competitive positioning, while building strong client relationships. Certified in Advanced Excel & Power BI she leverages data-driven approaches to ensure accuracy, clarity, and impactful outcomes.
Download Free Sample

Kindly complete the form below to receive a free sample of this Report

Download PDF ×

We do not share your information with anyone. However, we may send you emails based on your report interest from time to time. You may contact us at any time to opt-out.

















