Download Free Sample
Kindly complete the form below to receive a free sample of this Report
Refinery-catalyst-system-repair-and-mro-services-market Size, Share and Trends Analysis Research Report Information By Application (Hydrocracking, Hydrotreating, Reforming, Isomerization), By Service Type (Repair Services, Maintenance Services, Overhaul Services, Inspection Services), And By Region (North America, Europe, Asia-Pacific, And Rest Of The World) – Market Forecast Till 2035.
As per MRFR analysis, the Refinery Catalyst System Repair and MRO Services Market was estimated at 3.2 USD Billion in 2024. The market is projected to grow from 3.36 USD Billion in 2025 to 5.5 USD Billion by 2035, exhibiting a compound annual growth rate (CAGR) of 5.05% during the forecast period 2025 - 2035.
The Refinery Catalyst System Repair and MRO Services Market is poised for growth driven by technological advancements and sustainability initiatives.
| 2024 Market Size | 3.2 (USD Billion) |
| 2035 Market Size | 5.5 (USD Billion) |
| CAGR (2025 - 2035) | 5.05% |
Honeywell (US), BASF (DE), Albemarle (US), Clariant (CH), Johnson Matthey (GB), Haldor Topsoe (DK), W.R. Grace (US), SABIC (SA), Axens (FR)
Our Impact
Enabled $4.3B Revenue Impact for Fortune 500 and Leading Multinationals
Partnering with 2000+ Global Organizations Each Year
30K+ Citations by Top-Tier Firms in the Industry
The Refinery Catalyst System Repair and MRO Services Market is currently experiencing a dynamic evolution, driven by the increasing complexity of refining processes and the need for enhanced operational efficiency. As refineries strive to optimize their performance, the demand for specialized repair services and maintenance, repair, and operations (MRO) solutions is on the rise. This market appears to be influenced by several factors, including technological advancements, regulatory pressures, and the growing emphasis on sustainability. Companies are increasingly seeking innovative approaches to extend the lifespan of catalyst systems, thereby reducing downtime and operational costs. Moreover, the competitive landscape within the Refinery Catalyst System Repair and MRO Services Market is becoming more intricate. Service providers are diversifying their offerings to include comprehensive solutions that encompass not only repair services but also predictive maintenance and performance monitoring. This shift suggests a move towards a more integrated service model, where collaboration between refineries and service providers is paramount. As the industry continues to adapt to changing market conditions, the focus on reliability and efficiency is likely to shape future developments in this sector.
The Refinery Catalyst System Repair and MRO Services Market is witnessing a surge in the adoption of advanced repair techniques. Innovations such as automated inspection and predictive analytics are enhancing the efficiency of maintenance processes. These technologies enable service providers to identify potential issues before they escalate, thereby minimizing downtime and optimizing performance.
Growing environmental concerns and stringent regulations are influencing the Refinery Catalyst System Repair and MRO Services Market. Companies are increasingly focusing on sustainable practices, which include the use of eco-friendly materials and processes. This trend indicates a shift towards compliance with environmental standards while maintaining operational efficiency.
The integration of digital solutions into the Refinery Catalyst System Repair and MRO Services Market is becoming more prevalent. Digital tools such as IoT and data analytics are being utilized to monitor catalyst performance in real-time. This trend suggests a move towards data-driven decision-making, allowing for more proactive maintenance strategies.
The Refinery Catalyst System Repair and MRO Services Market is increasingly shaped by a rising focus on sustainability practices. Refineries are adopting greener technologies and processes to reduce their environmental footprint. This shift necessitates the repair and maintenance of catalyst systems that align with sustainable practices. As refineries transition to more eco-friendly operations, the demand for MRO services that support these initiatives is expected to grow. Market forecasts suggest that the sustainability trend could lead to a 7% increase in the demand for catalyst repair services, as facilities seek to optimize their operations while adhering to environmental commitments.
The Refinery Catalyst System Repair and MRO Services Market is poised for growth as the global economy recovers and energy demand rises. Economic revitalization leads to increased refining activities, which in turn drives the need for effective catalyst system maintenance and repair. As energy consumption rebounds, refineries are likely to enhance their operational capabilities, necessitating robust MRO services. Analysts predict that the market for catalyst repair services could expand by approximately 4% annually, reflecting the correlation between economic activity and refinery operations. This trend underscores the importance of maintaining catalyst systems to meet the anticipated surge in energy demand.
The Refinery Catalyst System Repair and MRO Services Market is witnessing a transformation due to technological innovations in catalyst systems. Advancements in materials science and engineering are leading to the development of more efficient catalysts that require specialized repair techniques. These innovations not only enhance the performance of refining processes but also extend the lifespan of catalyst systems. As a result, the demand for MRO services is likely to increase, with market analysts projecting a growth rate of around 5% in the coming years. This trend indicates a shift towards more sophisticated repair methodologies that can accommodate the complexities of modern catalyst technologies.
The Refinery Catalyst System Repair and MRO Services Market is significantly influenced by stringent regulatory compliance and environmental standards. Governments worldwide are implementing more rigorous regulations aimed at reducing emissions and promoting cleaner technologies. This regulatory landscape compels refineries to invest in advanced catalyst systems and their maintenance. The need for compliance not only drives the demand for repair services but also encourages innovation in catalyst technology. As refineries strive to meet these standards, the market for repair and maintenance services is expected to expand, with estimates suggesting a potential increase in service demand by 6% annually as facilities upgrade their systems to adhere to evolving regulations.
The Refinery Catalyst System Repair and MRO Services Market is experiencing a surge in demand driven by the need for enhanced operational efficiency. Refineries are under pressure to maximize output while minimizing costs, leading to a greater reliance on catalyst systems. As these systems age, the necessity for repair and maintenance services becomes paramount. According to industry reports, the catalyst market is projected to grow significantly, with a compound annual growth rate of approximately 4.5% over the next few years. This growth is indicative of the increasing complexity of refining processes, which necessitates specialized repair services to ensure optimal performance and compliance with regulatory standards.
In the Refinery Catalyst System Repair and MRO Services Market, the application segment displays a diverse landscape with hydrocracking leading in market share. This segment is critical as it transforms heavy crude oils into lighter, more valuable products. Hydrotreating follows closely, capitalizing on its role in removing impurities and enhancing product quality, thereby holding a significant place in the market. Together, these applications represent substantial portions of the overall demand for repair and maintenance services in refinery operations. The growth trends in this segment indicate a robust focus on both hydrocracking and hydrotreating services, driven by stringent environmental regulations and the ongoing demand for higher-quality fuels. The emergence of advanced technologies and catalyst innovations is playing a pivotal role in propelling the hydrotreating segment faster than its counterparts. As refiners aim to maximize efficiency and meet clean fuel standards, the growth dynamics of these applications will continue to shape the landscape of the market.
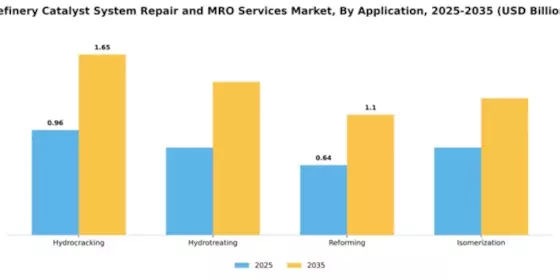
Hydrocracking (Dominant) vs. Reforming (Emerging)
Hydrocracking holds a dominant position within the application segment of the Refinery Catalyst System Repair and MRO Services Market due to its essential role in upgrading heavy hydrocarbons into lighter, premium products suitable for high-demand markets. This process aids refineries in optimizing yield and improving product quality. Meanwhile, the reforming application is emerging as a vital component, focusing on enhancing the quality of gasoline and petrochemical feedstocks. It is gaining traction due to its capability to produce high-octane fuels while also serving as a platform for developing valuable by-products. Both hydrocracking and reforming are witnessing increased investment in catalyst development and repair services as refiners strategically align their operations with market demands and regulatory standards.
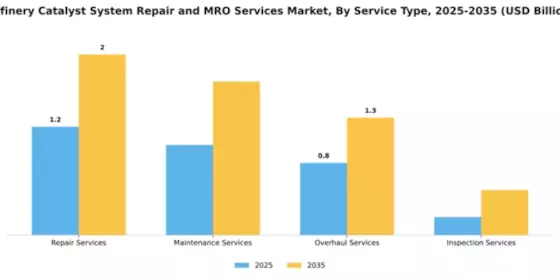
The Service Type segment of the Refinery Catalyst System Repair and MRO Services Market exhibits a varied distribution, with Maintenance Services leading the market share due to their essential role in ensuring the operational efficiency of refinery catalyst systems. This segment encompasses routine checks and preventive actions that extend the life of catalysts, making them a priority for customers. In contrast, the Repair Services segment, though not the largest, is witnessing rapid growth as aging equipment necessitates more frequent and comprehensive repair interventions, with operators aiming to reduce downtime and enhance productivity.
Maintenance Services (Dominant) vs. Repair Services (Emerging)
Maintenance Services are critical in maintaining optimal refinery catalyst performance, involving systematic and scheduled tasks that prolong the usability of catalysts and align with regulatory demands. This segment benefits from stable demand as refiners prioritize ongoing operations to mitigate costs associated with unplanned downtime. Meanwhile, Repair Services are emerging strongly due to higher rates of catalyst wear and equipment failures, driven by older installations across many refineries. As operational pressures increase, the focus shifts to advanced repair techniques and improved turnaround times, making this segment particularly dynamic in response to market needs.
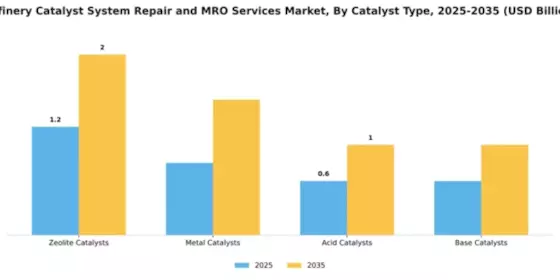
Within the Refinery Catalyst System Repair and MRO Services Market, the segment distribution showcases Zeolite Catalysts as the dominant player, thanks to their significant role in enhancing efficiency and longevity of refinery operations. These catalysts are widely adopted due to their excellent selectivity and stability, making them invaluable in various refining processes. Conversely, Metal Catalysts are emerging as the fastest-growing segment, driven by an increasing focus on cleaner production methods and regulatory pressures for lower emissions. Their capability to facilitate complex catalytic reactions efficiently places them in high demand, indicating a strong shift towards their adoption in future refinery upgrades and maintenance services.
Zeolite Catalysts (Dominant) vs. Metal Catalysts (Emerging)
Zeolite Catalysts are widely regarded as the dominant force in the Refinery Catalyst System Repair landscape. Their intricate porous structure and remarkable stability make them the go-to choice for various refinery processes, allowing for enhanced performance and lifecycle. These catalysts exhibit exceptional activity in hydrocracking and fluid catalytic cracking applications, which are crucial for maximizing product yield. On the other hand, Metal Catalysts are emerging with a strong upward trajectory in market presence, primarily due to their adaptability and effectiveness in novel refining technologies. The growth of the Metal Catalysts segment signals a shift towards innovations that adhere to stringent environmental standards while boosting operational efficiency, highlighting their evolving role in future refinery systems.
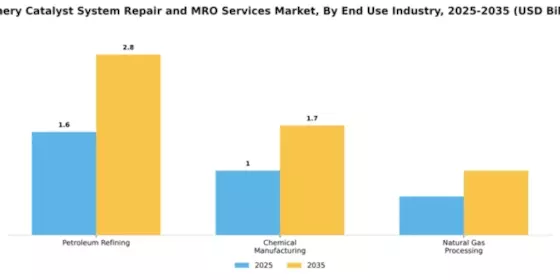
In the Refinery Catalyst System Repair and MRO Services Market, the distribution of market share among the end use industries highlights Petroleum Refining as the largest segment, dominating due to its critical role in fuel production and the need for efficient catalyst systems. Chemical Manufacturing follows as a significant contributor, utilizing repair and maintenance services to optimize their production processes and maintain competitiveness in a rapidly evolving market. Growth trends within these segments reveal that Petroleum Refining continues to invest heavily in MRO services to enhance operational efficiency and meet stringent environmental regulations. Meanwhile, the Chemical Manufacturing sector is experiencing a surge in demand for innovative catalyst technologies, positioning it as the fastest-growing segment. This growth is driven by increased production needs and advancements in catalyst efficiency, ensuring the sustained relevance of MRO services in this area.
Petroleum Refining (Dominant) vs. Natural Gas Processing (Emerging)
In the context of the Refinery Catalyst System Repair and MRO Services Market, Petroleum Refining stands out as the dominant end use industry, characterized by its substantial infrastructure and established processes for catalyst management. This industry relies on comprehensive repair and maintenance services to ensure compliance with stringent regulations while maximizing production yield. On the other hand, Natural Gas Processing is emerging as a vital segment, propelled by the growing demand for cleaner energy sources and the expansion of LNG facilities. This segment is increasingly adopting MRO services to enhance operational efficiency and address challenges associated with new processing technologies. As the global energy landscape shifts, both segments will play pivotal roles in shaping the future of catalyst system repair and maintenance.
Get more detailed insights about Refinery Catalyst System Repair and MRO Services Market Request Free Sample
North America is poised to maintain its leadership in the Refinery Catalyst System Repair and MRO Services Market, holding a significant market share of $1.6B in 2025. The region's growth is driven by stringent environmental regulations and a shift towards more efficient refining processes. The demand for advanced catalyst technologies is increasing, supported by investments in refinery upgrades and maintenance services. The United States stands out as the primary market, with key players like Honeywell, Albemarle, and W.R. Grace leading the competitive landscape. These companies are focusing on innovation and sustainability to enhance their service offerings. The presence of established firms and a robust regulatory framework further solidify North America's position as a hub for catalyst repair and MRO services.
Europe's Refinery Catalyst System Repair and MRO Services Market is valued at $0.9B, reflecting a growing demand for efficient refining solutions. The region is experiencing a shift towards sustainable practices, driven by EU regulations aimed at reducing emissions and enhancing energy efficiency. This regulatory environment is fostering innovation and investment in catalyst technologies, positioning Europe as a key player in the global market. Leading countries such as Germany, France, and the UK are at the forefront of this growth, with major companies like BASF and Clariant actively participating in the market. The competitive landscape is characterized by a mix of established firms and emerging players, all striving to meet the evolving demands of the refining sector. The focus on sustainability and regulatory compliance is expected to drive further growth in the coming years.
The Asia-Pacific region, with a market size of $0.7B, is witnessing rapid growth in the Refinery Catalyst System Repair and MRO Services Market. This growth is fueled by increasing energy demands and the expansion of refining capacities in countries like China and India. Regulatory initiatives aimed at improving air quality and reducing emissions are also driving the adoption of advanced catalyst technologies in the region. China is the leading country in this market, with significant investments in refinery upgrades and maintenance services. Key players such as Haldor Topsoe and Axens are actively involved in providing innovative solutions tailored to the region's needs. The competitive landscape is evolving, with both local and international firms vying for market share, indicating a dynamic and competitive environment.
The Middle East and Africa region currently holds a minimal market size of $0.0B in the Refinery Catalyst System Repair and MRO Services Market. However, the region presents untapped opportunities due to its rich oil reserves and increasing investments in refining infrastructure. As countries in this region seek to enhance their refining capabilities, the demand for catalyst repair and MRO services is expected to grow. Leading countries such as Saudi Arabia and the UAE are focusing on modernizing their refineries, which will likely drive the need for advanced catalyst technologies. The competitive landscape is still developing, with potential for both local and international players to establish a presence. As regulatory frameworks evolve, the market is anticipated to gain momentum in the coming years.
The Refinery Catalyst System Repair and MRO Services Market is characterized by a competitive landscape that is increasingly shaped by innovation, strategic partnerships, and a focus on sustainability. Key players such as Honeywell (US), BASF (DE), and Johnson Matthey (GB) are actively pursuing strategies that enhance their operational capabilities and market presence. Honeywell (US) emphasizes digital transformation and advanced analytics to optimize catalyst performance, while BASF (DE) focuses on sustainable solutions and product innovation to meet evolving regulatory standards. Johnson Matthey (GB) is leveraging its expertise in clean technologies to position itself as a leader in environmentally friendly catalyst solutions. Collectively, these strategies contribute to a dynamic competitive environment where differentiation is increasingly based on technological advancements and sustainability initiatives.The market structure appears moderately fragmented, with several key players exerting significant influence. Companies are adopting various business tactics, such as localizing manufacturing and optimizing supply chains, to enhance operational efficiency and reduce costs. This localized approach not only improves responsiveness to market demands but also mitigates risks associated with global supply chain disruptions. The collective influence of these key players fosters a competitive atmosphere where innovation and operational excellence are paramount.In November Honeywell (US) announced a strategic partnership with a leading technology firm to develop AI-driven solutions for catalyst monitoring and optimization. This collaboration is expected to enhance predictive maintenance capabilities, thereby reducing downtime and improving overall refinery efficiency. The strategic importance of this move lies in Honeywell's commitment to integrating cutting-edge technology into its service offerings, which may provide a competitive edge in an increasingly tech-driven market.In October BASF (DE) launched a new line of eco-friendly catalysts designed to minimize emissions and enhance energy efficiency in refining processes. This initiative aligns with global sustainability trends and positions BASF as a frontrunner in providing environmentally responsible solutions. The launch underscores the company's focus on innovation and its ability to respond to regulatory pressures, which could strengthen its market position.In September Johnson Matthey (GB) expanded its service portfolio by introducing a comprehensive catalyst management program aimed at optimizing catalyst life cycles. This program is designed to provide clients with tailored solutions that enhance performance and reduce operational costs. The strategic significance of this expansion lies in Johnson Matthey's ability to offer integrated services that address the full spectrum of catalyst management, potentially increasing customer loyalty and market share.As of December the competitive trends in the Refinery Catalyst System Repair and MRO Services Market are increasingly defined by digitalization, sustainability, and the integration of AI technologies. Strategic alliances are becoming more prevalent, as companies recognize the value of collaboration in driving innovation and enhancing service offerings. Looking ahead, competitive differentiation is likely to evolve from traditional price-based competition to a focus on technological innovation, reliability in supply chains, and sustainable practices. This shift may redefine the competitive landscape, compelling companies to invest in R&D and forge strategic partnerships to maintain their market positions.




The Refinery Catalyst System Repair and MRO Services Market is projected to grow at a 5.05% CAGR from 2025 to 2035, driven by technological advancements and increasing demand for efficient operations.
New opportunities lie in:
By 2035, the market is expected to be robust, reflecting sustained growth and innovation.
| MARKET SIZE 2024 | 3.2(USD Billion) |
| MARKET SIZE 2025 | 3.36(USD Billion) |
| MARKET SIZE 2035 | 5.5(USD Billion) |
| COMPOUND ANNUAL GROWTH RATE (CAGR) | 5.05% (2025 - 2035) |
| REPORT COVERAGE | Revenue Forecast, Competitive Landscape, Growth Factors, and Trends |
| BASE YEAR | 2024 |
| Market Forecast Period | 2025 - 2035 |
| Historical Data | 2019 - 2024 |
| Market Forecast Units | USD Billion |
| Key Companies Profiled | Honeywell (US), BASF (DE), Albemarle (US), Clariant (CH), Johnson Matthey (GB), Haldor Topsoe (DK), W.R. Grace (US), SABIC (SA), Axens (FR) |
| Segments Covered | Application, Service Type, Catalyst Type, End Use Industry |
| Key Market Opportunities | Integration of advanced analytics for predictive maintenance in the Refinery Catalyst System Repair and MRO Services Market. |
| Key Market Dynamics | Technological advancements and regulatory changes drive demand for efficient refinery catalyst system repair and maintenance services. |
| Countries Covered | North America, Europe, APAC, South America, MEA |
The market valuation reached 3.2 USD Billion in 2024.
The market is expected to grow to 5.5 USD Billion by 2035.
The expected CAGR is 5.05% during the forecast period.
The Hydrocracking application segment is projected to reach 1.65 USD Billion by 2035.
Key service types include Repair Services, Maintenance Services, Overhaul Services, and Inspection Services.
The Repair Services segment is anticipated to grow from 1.2 USD Billion in 2024 to 2.0 USD Billion by 2035.
Zeolite Catalysts are expected to dominate, growing to 2.0 USD Billion by 2035.
The Petroleum Refining end-use industry is projected to reach 2.8 USD Billion by 2035.
Key players include Honeywell, BASF, Albemarle, Clariant, and Johnson Matthey.
Trends include increasing demand for efficient catalyst systems and advancements in repair technologies.


Kindly complete the form below to receive a free sample of this Report

“This is really good guys. Excellent work on a tight deadline. I will continue to use you going forward and recommend you to others. Nice job”


“Thanks. It’s been a pleasure working with you, please use me as reference with any other Intel employees.”


“Thanks for sending the report it gives us a good global view of the Betaïne market.”


“Thank you, this will be very helpful for OQS.”


“We found the report very insightful! we found your research firm very helpful. I'm sending this email to secure our future business.”


“I am very pleased with how market segments have been defined in a relevant way for my purposes (such as "Portable Freezers & refrigerators" and "last-mile"). In general the report is well structured. Thanks very much for your efforts.”


“I have been reading the first document or the study, ,the Global HVAC and FP market report 2021 till 2026. Must say, good info! I have not gone in depth at all parts, but got a good indication of the data inside!”


“We got the report in time, we really thank you for your support in this process. I also thank to all of your team as they did a great job.”


“The Automotive 48V ECU Components Procurement Intelligence Study” was a complex project, but the Market Research Future (MRFR) team handled it with quality, agility, and customer-centricity. They delivered all requested data on time and within the agreed scope. The team, including Shubhendra Anand and Rahul Gotadki, was always readily available to clarify questions and swiftly implement necessary adjustments, driving the project to a successful conclusion within a very demanding timeframe.
I would also like to specifically commend Akshay Agarwal for his responsiveness and support at every stage—from our initial inquiry on May 6th through to final delivery on June 18th. His dedication made the entire process seamless.”



