Refractory Bricks Market (2026 - 2035)

Refractory Bricks Market Research Report Information By Product Type (Clay Refractories and Non-Clay Refractories), By End-User Industry (Iron and Steel, Cement, Energy and Chemicals, Non-Ferrous Metals, Glass, Ceramic, and Other End-User Industries) – Forecast Till 2035
ID: MRFR/CnM/21839-HCR
100 Pages
Chitranshi Jaiswal
Last Updated: July 22, 2026
Refractory Bricks Market
Market Size
Forecast Period2026-2035
CAGR (2026-2035)4.25%
2025 Market SizeUSD 18,200 Million
2035 Market SizeUSD 27,595 Million
Key Players
RHI Magnesita
Vesuvius
Shinagawa Refractories
Krosaki Harima
Saint-Gobain
Morgan Advanced Materials
Opportunities
  • Hydrogen-Ready Refractory Solutions
  • Digital Twin-Enabled Lining Management
  • Emerging Market Industrialization

Refractory Bricks Market Summary

The global refractory bricks market reached an estimated USD 18,200 Million in 2025, and Market Research Future projects it will grow from USD 18,974 Million in 2026 to USD 27,595 Million by 2035, registering a CAGR of 4.25% across the forecast period. This expansion tracks closely with a global steelmaking renaissance — capacity additions across India, Southeast Asia, and the Middle East are pulling demand for high-performance lining solutions upward, while carbon-border adjustment mechanisms in the EU and tighter workplace silica-dust regulations in North America are compelling end users to specify next-generation brick chemistries [1][2]. Government-backed infrastructure investment programs, including India's National Infrastructure Pipeline (valued above USD 1.4 trillion through 2030) and China's steel-sector decarbonization roadmap, are anchoring near-term order books [3].

A technology transition is reshaping procurement patterns across the refractory bricks market. Legacy fireclay and silica compositions are steadily ceding share to advanced alumina, magnesia-carbon, and zirconia-based formulations that tolerate the extreme thermal cycling of hydrogen-based direct-reduced-iron (DRI) furnaces and electric-arc furnaces (EAFs). RHI Magnesita's 2023 annual report highlighted that the company redirected 18% of its R&D budget toward DRI-compatible products, signaling where the industry's center of gravity is shifting [4]. Cement producers are also upgrading kiln linings to withstand alternative fuel blends — a shift that broadens the addressable base for premium brick suppliers.

Asia-Pacific commands roughly 68.0% of the refractory bricks market, anchored by China's steelmaking complex and India's accelerating capacity build-out. The region is also the fastest-growing, expanding at a 4.45% CAGR through 2035. Europe holds the second-largest share at approximately 14.5%, driven by decarbonization mandates and EAF conversions in Germany and Italy. North America accounts for around 10.2%, buoyed by reshoring incentives and defense-adjacent metal processing. As steel, cement, and glass producers worldwide upgrade to cleaner, higher-temperature processes, the refractory bricks market is well positioned for a decade of sustained growth.


Key Report Takeaways — Refractory Bricks Market

By Product Type

  • Clay refractories held a 58.5% share of the refractory bricks market in 2025, reflecting their dominant use in blast furnace and ladle applications.
  • Non-clay refractories are forecast to expand at a 4.91% CAGR through 2035, driven by demand from EAF steelmaking and hydrogen-ready DRI units.

By End-User Industry

  • Iron and steel captured 67.0% of the refractory bricks market in 2025, underscoring the sector's outsized consumption intensity.
  • The cement end-user segment is advancing at a 4.48% CAGR as alternative-fuel kiln conversions accelerate.

By Region

  • Asia-Pacific commanded 68.0% of the refractory bricks market share in 2025.
  • North America's refractory bricks market is growing at a 3.82% CAGR, supported by reshoring-driven furnace construction in the US and Mexico.


Refractory Bricks Market Size and Forecast (2021–2035)

Market Research Future's sizing methodology integrates bottom-up demand modeling (consumption by end-user furnace counts and relining cycles) with top-down cross-referencing against trade-flow data, producer shipment disclosures, and customs databases across 32 countries. Historical figures draw on audited company filings and national industry association statistics; forecast projections layer in committed capacity expansions, regulatory phase-in timelines, and macroeconomic scenarios sourced from the IMF and World Bank [5][6].
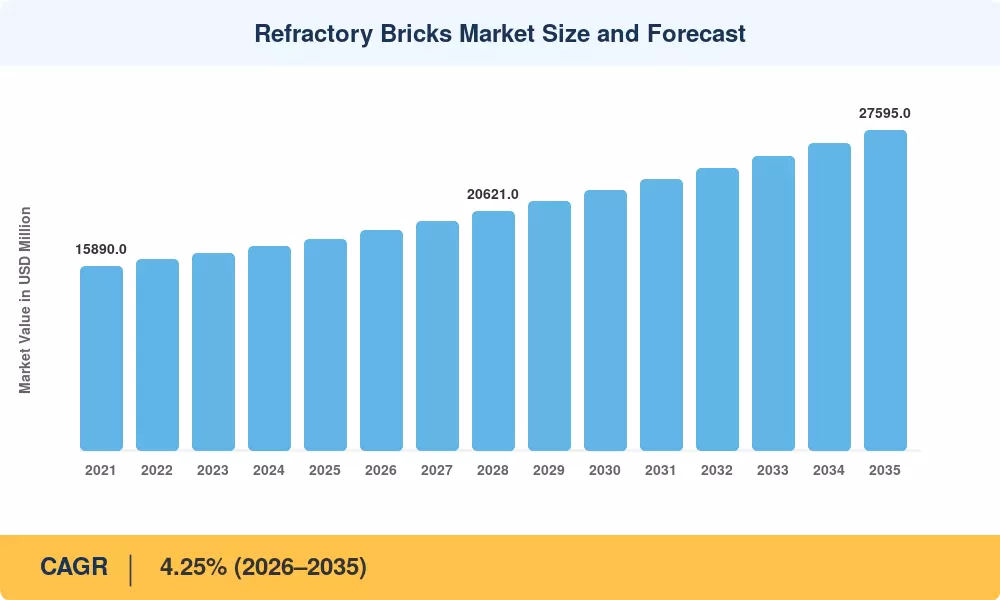
Refractory Bricks Market Size and Forecast
Our Impact
Enabled $4.3B Revenue Impact for Fortune 500 and Leading Multinationals
Partnering with 2000+ Global Organizations Each Year
30K+ Citations by Top-Tier Firms in the Industry

Driver Impact Analysis

Driver ~% Impact on CAGR Geographic Relevance Impact Timeline
Steel capacity expansion in Asia & MENA +1.10% Asia-Pacific, MEA Short-term (≤2 yr)
EAF & DRI furnace adoption +0.85% Global Medium-term (2–4 yr)
Cement kiln alternative-fuel conversions +0.55% Europe, Asia-Pacific Medium-term (2–4 yr)
Infrastructure investment programs +0.50% India, US, Brazil Short-term (≤2 yr)
Carbon-border adjustment mechanisms +0.40% Europe Long-term (≥4 yr)
Battery & waste-to-energy facility scale-up +0.35% North America, Europe Long-term (≥4 yr)
Silica-dust regulatory tightening +0.25% North America, Europe Short-term (≤2 yr)


Steel Capacity Expansion in Asia and MENA

India’s crude steel capacity is expected to reach about 160 MTPA in 2024, and the National Steel Policy [3] targets to increase it to 300 million tonnes per annum by 2030. For every million tonnes of new blast-furnace capacity, 15,000–18,000 tonnes of refractory lining material is required in the first campaign, creating billions of dollars of total brick demand in the refractory bricks market. Saudi Arabia’s NEOM and Ras Al Khair industrial zones are adding DRI-EAF complexes with even higher per-unit refractory intensity due to shorter relining cycles.


EAF and Hydrogen-Based DRI Adoption

EAF linings face more aggressive thermal shock profiles than traditional blast furnaces, favoring magnesia-carbon and high-alumina bricks that command 25–40% price premiums. This structural mix shift boosts value growth for the refractory bricks market even where volume growth is moderate.

Cement Kiln Alternative-Fuel Conversions

The European Cement Association states that its members want to increase their alternative fuel substitution rates to 60% by 2030 [8]. The variable slag chemistry and alkali concentrations in the kiln from refuse-derived and biomass fuels require operators to upgrade from ordinary alumina linings to chrome-magnesia or spinel-bonded compositions. This wave of kiln relining is producing a multi-year procurement cycle across the market for refractory bricks.


Infrastructure Investment Programs

Governments around the world have pledged more than USD 4 trillion in combined infrastructure spending for 2024-2030 [3][6]. The need for refractories directly comes from the manufacturing of steel, cement, and glass required by these initiatives. The US Bipartisan Infrastructure Law alone is funneling USD 550 billion into highways, bridges, and grid repairs – projects that are intensive in steel and cement.


Restraints Impact Analysis

The restraint impact estimates below follow the same directional methodology described in Section 4 and should not be treated as precise subtractions from the headline CAGR [5].

Restraint ~% Impact on CAGR Geographic Relevance Impact Timeline
Raw material price volatility (magnesia, graphite) −0.45% Global Short-term (≤2 yr)
Recycled refractories substitution −0.35% Europe, Japan Medium-term (2–4 yr)
Overcapacity in Chinese brick production −0.30% Asia-Pacific Short-term (≤2 yr)
Extended furnace campaign lives −0.25% North America, Europe Long-term (≥4 yr)
Trade barriers and anti-dumping duties −0.20% North America, Europe Medium-term (2–4 yr)


Raw Material Price Volatility

Fused magnesia and flake graphite — two critical feedstocks for magnesia-carbon bricks — saw price swings exceeding 30% year-on-year in 2022–2023, driven by Chinese export controls and energy-cost spikes [14]. These fluctuations compress margins for brick producers and create procurement uncertainty for steelmakers, occasionally delaying relining schedules across the refractory bricks market.

Recycled Refractories Substitution

European steelmakers are increasingly recovering spent bricks and reprocessing them into secondary raw material for new formulations, reducing virgin brick consumption by an estimated upto20% in mature markets [15]. Japan's steel sector has achieved recycling rates more than 50% for certain magnesia-based compositions, directly moderating the volume growth trajectory for the refractory bricks market in those geographies.

Overcapacity in Chinese Brick Production

China hosts roughly 2,000 refractory producers, many operating at sub-60% utilization [10]. The resulting price competition depresses export-market pricing and discourages capacity rationalization, creating headwinds for premium-positioned global suppliers.


Refractory Bricks Market Opportunities

Hydrogen-Ready Refractory Solutions

As steelmakers pilot hydrogen-based DRI at scale — SSAB's HYBRIT plant in Sweden and ArcelorMittal's Hamburg facility are early movers — the refractory bricks market faces demand for entirely new brick chemistries that resist hydrogen embrittlement and water-vapor erosion [9].

Digital Twin-Enabled Lining Management

Predictive-maintenance platforms that model thermal wear in real time can extend refractory campaign lives by 10–15% while providing brick suppliers with usage-based service revenue streams [16]. Suppliers that pair physical products with digital-twin subscriptions stand to capture recurring revenue in the refractory bricks market.

Emerging Market Industrialization

Sub-Saharan Africa and Southeast Asia remain under-penetrated, with per-capita steel consumption at roughly one-fifth the global average [6]. As these regions industrialize, greenfield steel and cement facilities will anchor fresh refractory demand.

Battery Gigafactory and Waste-to-Energy Linings

Ramping up high-capacity lithium battery cathode processing kilns creates aggressive alkali chemical atmospheres. This intense corrosion requires operators to deploy highly dense, specialized synthetic refractory shapes, expanding the value share of technical brick applications beyond traditional heavy iron and steel sectors.

Circular-Economy Business Models

Producers offering take-back and recycling programs for spent bricks can lock in long-term supply agreements while meeting tightening EU Waste Framework Directive targets [15]. Such models shift procurement from spot purchases to multi-year partnerships.


Refractory Bricks Market Future Outlook

Decarbonization-Driven Furnace Redesign

In the next 10 years, the steel industry’s move to net-zero goals will radically alter refractory standards. The International Energy Agency’s Net Zero Emissions scenario asks for 50% of global steel production to come from near-zero-emission pathways by 2050, meaning a steep acceleration in the furnace transition after 2030 [1]. Those brick makers who establish verified product lines for hydrogen DRI, molten-oxide electrolysis, and biomass-fired kilns will take a disproportionate piece of the refractory bricks market.


Digitalization and Predictive Lining Analytics

Embedded fiber-optic temperature sensors and AI-driven wear models are moving from pilot programs to commercial deployment at major steelmakers. As these platforms mature, they will shift value from volume-based brick sales toward performance-based contracts across the refractory bricks market.

Supply-Chain Regionalization

Geopolitical friction and pandemic-era disruptions have prompted steelmakers and cement producers in Europe and North America to diversify refractory sourcing away from concentrated Chinese supply. This trend is stimulating investment in magnesia mining and processing capacity outside China [14][17].

ESG Reporting and Circular Materials Mandates

ESG disclosure regulations are becoming stricter – for instance, the EU Corporate Sustainability Reporting Directive – and are forcing steel and cement industries to quantify and cut down on refractory waste [15]. In the refractory bricks industry, brick suppliers that can provide certification of recycled content, reduced embodied carbon, and closed-loop take-back systems will have an advantage in procurement through 2035.


Refractory Bricks Market Segmentation

By Product Type

Segment Key Metric Primary Demand Driver
Clay Refractories 58.5% share (2025) Blast furnace and ladle linings
Non-Clay Refractories 4.91% CAGR (2026–2035) EAF, DRI, and specialty applications


Clay refractories — encompassing fireclay, high-alumina, and silica formulations — remain the backbone of the refractory bricks market because of their versatility and cost-effectiveness in blast-furnace ironmaking and foundry operations. However, non-clay refractories (magnesia-carbon, chrome-magnesia, zirconia, and dolomite compositions) are gaining ground as steelmakers shift to EAF and DRI routes that impose harsher chemical and thermal loads. Magnesia-carbon bricks alone account for the majority of converter and EAF lining installations globally.

The pricing gap between clay and non-clay bricks — non-clay formulations typically cost 2–4× more per tonne — means that even modest share shifts carry outsized revenue implications for the refractory bricks market. Producers investing in high-purity raw-material sourcing and proprietary bonding technologies are best positioned to capture this premium migration.

By End-User Industry

Segment Key Metric Primary Demand Driver
Iron and Steel 67.0% share (2025) Blast furnace, EAF, ladle, tundish linings
Cement 4.48% CAGR (2026–2035) Kiln relining for alternative fuels
Energy and Chemicals USD 1,456 Million (2025) Petrochemical crackers, gasifiers
Non-Ferrous Metals 4.15% CAGR (2026–2035) Aluminum, copper, nickel smelting
Glass USD 728 Million (2025) Float-glass and container-glass furnaces
Ceramic 3.60% CAGR (2026–2035) Tunnel kilns, roller hearth kilns
Other End-User Industries USD 273 Million (2025) Waste-to-energy, power generation


Iron and steel overwhelmingly drive the refractory bricks market, consuming bricks at every stage from coke ovens through blast furnaces, converters, ladles, tundishes, and continuous casters. A single integrated steel plant can consume 10–15 kg of refractories per tonne of crude steel produced, and relining cycles every 2–5 years create a steady replacement demand stream [4]. The cement segment is the second most dynamic, propelled by a global kiln-upgrade cycle tied to alternative-fuel mandates and capacity expansions in India and Southeast Asia.


Regional Market Share Analysis

Region Key Metric Primary Investment Themes
Asia-Pacific 68.0% share (2025) Steel capacity expansion, DRI adoption, cement modernization
Europe 14.5% share (2025) EAF conversion, CBAM compliance, circular refractories
North America 3.82% CAGR (2026–2035) Reshoring, silica-dust regulation, grid-metal demand
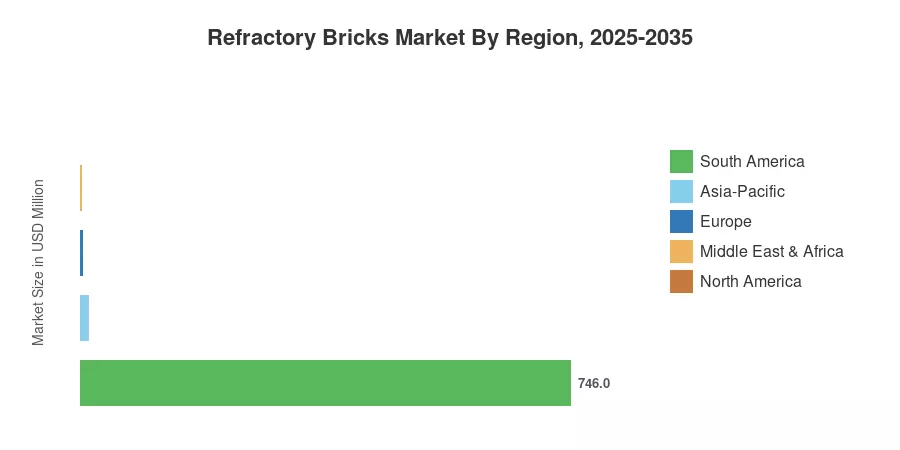
South America USD 746 Million (2025) Brazilian steel exports, mining-sector furnaces
Middle East & Africa 4.38% CAGR (2026–2035) Greenfield DRI plants, industrial diversification
Total USD 18,200 Million (2025)


North America

Country Key Metric Key Driver
US 72.5% of regional share Reshoring incentives, defense-metal processing
Canada 3.65% CAGR Nickel and aluminum smelter relining
Mexico USD 198 Million (2025) Automotive steel capacity additions


The US accounts for the bulk of North America's refractory bricks market, where OSHA's 2024 enforcement guidance tightening permissible silica-dust exposure to 25 µg/m³ is accelerating the adoption of low-silica brick formulations [13]. Canada's refractory consumption tracks its non-ferrous metals complex, particularly nickel smelting in Ontario and aluminum in Quebec. Mexico's automotive-steel corridor in Monterrey is drawing fresh investment from both domestic and Asian steelmakers.

Europe

Country Key Metric Key Driver
Germany 28.3% of regional share EAF steel conversion, automotive steel
UK 3.72% CAGR Green-steel mandates
France USD 285 Million (2025) Cement and glass industry
Italy 14.1% of regional share Specialty steel mills
Spain 3.60% CAGR Infrastructure renewal
Nordic Countries USD 162 Million (2025) Hydrogen-DRI pioneering
Russia 11.8% of regional share Legacy blast-furnace relining
Rest of Europe 3.55% CAGR Mixed industrial base


Europe's refractory bricks market is heavily influenced by the EU's Carbon Border Adjustment Mechanism, which entered its transitional phase in October 2023 and moves to full financial compliance by 2026 [8]. German steelmakers — led by ThyssenKrupp and Salzgitter — are converting blast furnaces to DRI-EAF configurations, creating intensive relining demand for magnesia-carbon and high-alumina products. The Nordic region serves as a proving ground for hydrogen-based steelmaking, pulling premium brick orders disproportionate to its output volume.

Asia-Pacific

Country Key Metric Key Driver
China 52.4% of regional share World's largest steel and cement producer
India 4.68% CAGR National Steel Policy capacity targets
Japan USD 1,240 Million (2025) High-grade refractories for specialty steel
South Korea 6.8% of regional share Automotive and shipbuilding steel
ASEAN 4.72% CAGR Greenfield industrial build-out
Rest of Asia-Pacific USD 410 Million (2025) Diversified metals processing


Asia-Pacific dominates the refractory bricks market because it produces over 70% of the world's crude steel and nearly 60% of its cement [6]. China alone operates more than 1,000 blast furnaces and thousands of rotary kilns, creating an enormous relining cycle that sustains brick demand even during periods of slower capacity growth. India's trajectory is steeper — JSW Steel, Tata Steel, and SAIL collectively plan to add over 80 MTPA by 2030, and each new furnace campaign generates multi-year refractory procurement contracts [3].

South America

Country Key Metric Key Driver
Brazil 71.3% of regional share Export-oriented steel, iron-ore integration
Argentina 3.50% CAGR Metals processing recovery
Rest of South America USD 82 Million (2025) Mining and cement operations


Brazil anchors South America's refractory bricks market through vertically integrated steelmakers such as Gerdau and Usiminas, whose export orientation ties refractory demand to global trade flows. Argentina's intermittent currency instability creates procurement volatility, though underlying metals-sector fundamentals remain sound.

Middle East & Africa

Country Key Metric Key Driver
Saudi Arabia 34.2% of regional share NEOM-linked DRI investments
UAE 4.55% CAGR Aluminum smelter expansions
South Africa USD 98 Million (2025) Ferroalloy and platinum-group metals processing
Egypt 3.95% CAGR Steel and cement capacity growth
Rest of MEA USD 112 Million (2025) Industrialization initiatives


The Middle East is transitioning from a minor consumer to a meaningful growth pocket for the refractory bricks market. Saudi Arabia's Vision 2030 industrial strategy includes multiple DRI-EAF steel complexes, while the UAE's Emirates Steel Arkan is scaling capacity with gas-based reduction technology that demands specialized high-magnesia linings [9].


Refractory Bricks Market By Region, 2025-2035

Competitive Benchmarking

The refractory bricks market exhibits low-to-moderate concentration, with the top five producers collectively holding an estimated 35–42% revenue share and an approximate Herfindahl-Hirschman Index below 800. The competitive field includes global integrated players with captive raw-material mines, mid-tier regional specialists, and a long tail of local manufacturers — particularly in China and India — competing largely on price. Strategic consolidation has accelerated since 2017, when RHI and Magnesita merged, and further M&A is likely as producers seek raw-material security and geographic diversification.

Company Est. Revenue Share Range Key Offerings for Refractory Bricks Market Strategic Positioning
RHI Magnesita ~12–16% Magnesia-carbon, alumina, flow-control systems Vertically integrated; global #1 by revenue
Vesuvius ~7–10% Flow control, advanced ceramics, monitoring sensors Technology-led; strong in steel continuous casting
Shinagawa Refractories ~5–8% Magnesia-chrome, alumina-spinel, monolithics Dominant in Japanese steel supply chain
Krosaki Harima ~4–7% Basic bricks, alumina-carbon, kiln furniture Integrated producer; Nippon Steel alliance
Saint-Gobain (SEFPRO) ~4–6% Fused-cast, glass-furnace linings Leader in glass-industry refractories
Morgan Advanced Materials ~3–5% Insulating firebrick, ceramic fiber Specializes in thermal management
HarbisonWalker International ~3–5% Basic, alumina-silica, gunning mixes Largest North American producer
Calderys ~3–5% Monolithics, calcium-aluminate binders Strong in cement and petrochemical sectors
Resco Products ~2–4% Custom shapes, ladle and tundish linings US-focused niche specialist
Puyang Refractories Group ~2–4% Standard and high-alumina bricks Major Chinese producer; export-oriented


Recent News & Developments


  • Vesuvius (July 2026): Formally announced its Q1 2026 financial earnings, posting a 12.6% year-over-year revenue growth to ₹2,099.95 million (₹2,099.95 crore). The robust top-line performance highlights resilient domestic demand for specialized advanced steel-flow control shapes and premium industrial lining systems.
  • Shinagawa Refractories (May2024): Formulated its comprehensive "Vision 2030" framework, breaking ground on a brand-new shaped refractory and industrial furnace processing plant in Setouchi City scheduled for operational completion in February 2026.
  • European Commission (October 2023): Initiated the transitional phase of the Carbon Border Adjustment Mechanism, covering steel, cement, and aluminum imports — a move that indirectly raises refractory specification requirements for EU-bound producers [8].


  • Calderys (December 2023): Formally completed the structural operational integration of its South American footprint with HarbisonWalker International (HWI), establishing a unified manufacturing, service, and high-temperature product logistics supply hub across Brazil.


Refractory Bricks Market Report Scope

Parameter Detail
Market Scope Global refractory bricks market — shaped, pre-fired brick products for industrial furnace linings
Study Period 2021–2035
CAGR 4.25% (2026–2035)
Market Size (2025) USD 18,200 Million
Market Size (2035) USD 27,595 Million
Fastest Growing Segment Non-clay refractories (4.91% CAGR)
Companies Profiled 10 (RHI Magnesita, Vesuvius, Shinagawa, Krosaki Harima, Saint-Gobain, Morgan Advanced Materials, HarbisonWalker, Calderys, Resco Products, Puyang Refractories)
Valuation Currency USD Million


FAQs

What is the projected market valuation of the Refractory Bricks Market by 2035?

The Refractory Bricks Market is projected to reach a valuation of 6.346 USD Billion by 2035.

What was the market valuation of the Refractory Bricks Market in 2024?

In 2024, the overall market valuation was 4.074 USD Billion.

What is the expected CAGR for the Refractory Bricks Market during the forecast period 2025 - 2035?

The expected CAGR for the Refractory Bricks Market during the forecast period 2025 - 2035 is 4.11%.

Which raw material segment had the highest valuation in 2024?

The High Alumina segment had the highest valuation at 1.224 USD Billion in 2024.

What are the key applications driving the Refractory Bricks Market?

Key applications include the Iron and Steel Industry, which was valued at 1.5 USD Billion in 2024.

Which manufacturing process segment is projected to grow the most by 2035?

The Extrusion manufacturing process segment is projected to grow to 1.012 USD Billion by 2035.

What is the market size for standard bricks in 2024?

The market size for standard bricks was 1.5 USD Billion in 2024.

Which company is a leading player in the Refractory Bricks Market?

RHI Magnesita is one of the leading players in the Refractory Bricks Market.

What is the projected valuation for the Silicon Carbide segment by 2035?

The Silicon Carbide segment is projected to reach a valuation of 0.743 USD Billion by 2035.

How does the market for chemical resistance properties compare to other properties in 2024?

The market for chemical resistance properties was valued at 0.9 USD Billion in 2024, indicating strong demand.

Author
Author
Author Profile
Chitranshi Jaiswal LinkedIn
Team Lead - Research
Chitranshi is a Team Leader in the Chemicals & Materials (CnM) and Energy & Power (EnP) domains, with 6+ years of experience in market research. She leads and mentors teams to deliver cross-domain projects that equip clients with actionable insights and growth strategies. She is skilled in market estimation, forecasting, competitive benchmarking, and both primary & secondary research, enabling her to turn complex data into decision-ready insights. An engineer and MBA professional, she combines technical expertise with strategic acumen to solve dynamic market challenges. Chitranshi has successfully managed projects that support market entry, investment planning, and competitive positioning, while building strong client relationships. Certified in Advanced Excel & Power BI she leverages data-driven approaches to ensure accuracy, clarity, and impactful outcomes.
Download Free Sample

Kindly complete the form below to receive a free sample of this Report

Download PDF ×

We do not share your information with anyone. However, we may send you emails based on your report interest from time to time. You may contact us at any time to opt-out.

















