×
Hero Background
English
Chinese
French
Japanese
Korean
German
Spanish

Retail Edge Computing Market Trends

ID: MRFR/ICT/10611-HCR
128 Pages
Ankit Gupta
October 2025

Retail Edge Computing Market Research Report: Information By Component (Hardware, Software, and Services), By Application (Smart Cities, Industrial Internet of Things (IoT), Remote Monitoring, Content Delivery, Augmented Reality (AR), Virtual Reality (VR), and Others), By Organization Size (Large Enterprises and SMEs), and By Region (North America, Europe, Asia-Pacific, and Rest Of The World) – Market Forecast Till 2035

Share:
Download PDF ×

We do not share your information with anyone. However, we may send you emails based on your report interest from time to time. You may contact us at any time to opt-out.

Retail Edge Computing Market Infographic
Purchase Options

Market Trends

Key Emerging Trends in the Retail Edge Computing Market

In the ever-evolving landscape of the Retail Edge Computing Market, companies have put in place various strategies to create and strengthen their market shares. One approach is through technological innovation where companies develop edge computing solutions that come with advanced features and capabilities tailored for specific needs in the retail sector. It requires utilization of latest developments in edge processing, real-time analytics, and seamless connectivity among other elements needed by retailers who are looking for fast and flexible computing infrastructures. Pricing strategies are crucial for determining a company’s position regarding its market share within the Retail Edge Computing Market. Some organizations adopt a competitive-cost strategy in order to provide such products at lower prices than those used by other firms. Under this method, they target price-conscious consumers thereby capturing more share demand through low pricing policies. On another hand some firms position themselves as value-driven providers emphasizing reliability, scalability and comprehensive features associated with their edge-computing solutions; these suppliers essentially target high-end customers who can pay substantial premiums for highly designed niche-edge computing products. Collaborations and strategic partnerships emerge as critical components of market share positioning in the Retail Edge Computing Market. Often times companies seek alliances with point-of-sale system providers, data analytics firms or industry-specific solution providers to improve both integration and application of their edge computing solutions within retail ecosystem. Such joint ventures can lead to an expanded service system encompassing a wider customer base as well as meet separate requirements within different sections of retailing sub sectors. Moreover, stable income stream and a stronger market presence can be obtained through partnerships with retail chains for joint projects or long-term contracts. Customer-centric strategies are paramount drivers for market share growth in the Retail Edge Computing Market. Companies that have seamless integration, user-friendly interfaces and responsive customer support as their priority points achieve high levels of customer satisfaction which enhances customer retention. This has led to loyalty among customers who also recommend on word-of-mouth basis thus promoting further expansion of the market share. Additionally, by understanding and addressing specific use cases or needs in retailing companies are able to customize their edge computing solutions to suit a particular segment thus making them remain competitive.

Author
Ankit Gupta
Senior Research Analyst

Ankit Gupta is an analyst in market research industry in ICT and SEMI industry. With post-graduation in "Telecom and Marketing Management" and graduation in "Electronics and Telecommunication" vertical he is well versed with recent development in ICT industry as a whole. Having worked on more than 150+ reports including consultation for fortune 500 companies such as Microsoft and Rio Tinto in identifying solutions with respect to business problems his opinions are inclined towards mixture of technical and managerial aspects.

Leave a Comment

FAQs

What is the projected market valuation of the Retail Edge Computing Market by 2035?

The Retail Edge Computing Market is projected to reach a valuation of 50.2 USD Billion by 2035.

What was the market valuation of the Retail Edge Computing Market in 2024?

In 2024, the Retail Edge Computing Market was valued at 6.337 USD Billion.

What is the expected CAGR for the Retail Edge Computing Market during the forecast period 2025 - 2035?

The expected CAGR for the Retail Edge Computing Market during the forecast period 2025 - 2035 is 20.7%.

Which companies are considered key players in the Retail Edge Computing Market?

Key players in the Retail Edge Computing Market include Amazon, Microsoft, IBM, Google, Cisco, Hewlett Packard Enterprise, Dell Technologies, EdgeConneX, and Fastly.

What are the main components of the Retail Edge Computing Market?

The main components of the Retail Edge Computing Market include hardware, software, and services, with valuations of 12.5 USD Billion, 20.0 USD Billion, and 17.7 USD Billion respectively.

How does the market size for large enterprises compare to SMEs in the Retail Edge Computing Market?

In the Retail Edge Computing Market, large enterprises are projected to reach a size of 32.0 USD Billion, while SMEs are expected to reach 18.2 USD Billion.

Market Summary

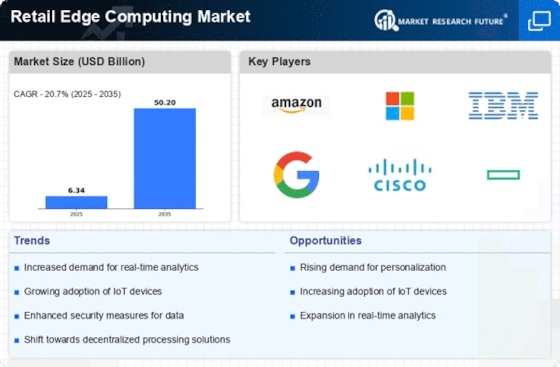
As per MRFR analysis, the Retail Edge Computing Market Size was estimated at 6.337 USD Billion in 2024. The Retail Edge Computing industry is projected to grow from 7.649 USD Billion in 2025 to 50.2 USD Billion by 2035, exhibiting a compound annual growth rate (CAGR) of 20.7 during the forecast period 2025 - 2035.

Key Market Trends & Highlights

The Retail Edge Computing Market is poised for substantial growth driven by technological advancements and evolving consumer demands.

  • North America remains the largest market for retail edge computing, driven by robust infrastructure and high adoption rates. Asia-Pacific is emerging as the fastest-growing region, fueled by rapid urbanization and increasing investments in technology. The hardware segment dominates the market, while the software segment is experiencing the fastest growth due to rising demand for innovative solutions. Key market drivers include the growing demand for real-time analytics and the rise of omnichannel retailing, which enhance customer experience.

Market Size & Forecast

2024 Market Size 6.337 (USD Billion)
2035 Market Size 50.2 (USD Billion)
CAGR (2025 - 2035) 20.7%
Largest Regional Market Share in 2024 North America

Major Players

<p>Amazon (US), Microsoft (US), IBM (US), Google (US), Cisco (US), Hewlett Packard Enterprise (US), Dell Technologies (US), EdgeConneX (US), Fastly (US)</p>

Market Trends

The Retail Edge Computing Market Market is currently experiencing a transformative phase, driven by the increasing demand for real-time data processing and analytics at the point of sale. Retailers are increasingly recognizing the necessity of deploying edge computing solutions to enhance customer experiences, optimize inventory management, and streamline operations. This shift appears to be influenced by the growing reliance on IoT devices and the need for low-latency applications that can respond swiftly to consumer behavior. As a result, businesses are investing in edge infrastructure to support these advancements, which may lead to improved operational efficiency and customer satisfaction. Moreover, the Retail Edge Computing Market seems poised for further growth as technological innovations continue to emerge. The integration of artificial intelligence and machine learning into edge computing systems is likely to provide retailers with deeper insights into consumer preferences and purchasing patterns. This evolution could facilitate more personalized marketing strategies and enhance overall decision-making processes. Additionally, the ongoing development of secure and scalable edge solutions may address concerns related to data privacy and security, thereby fostering greater trust among consumers and businesses alike. Overall, the Retail Edge Computing Market is on a trajectory that suggests a promising future, characterized by enhanced capabilities and a focus on customer-centric solutions.

Increased Adoption of IoT Devices

The Retail Edge Computing Market is witnessing a surge in the adoption of Internet of Things (IoT) devices. Retailers are leveraging these technologies to gather real-time data, which can be processed at the edge. This trend indicates a shift towards more responsive and adaptive retail environments, where businesses can quickly react to changing consumer demands.

Enhanced Data Security Measures

As data privacy concerns grow, the Retail Edge Computing Market is likely to see an emphasis on enhanced security measures. Retailers are increasingly prioritizing the protection of sensitive customer information, leading to the development of more robust security protocols within edge computing frameworks. This trend suggests a proactive approach to safeguarding data.

Integration of AI and Machine Learning

The integration of artificial intelligence and machine learning into edge computing systems is becoming more prevalent in the Retail Edge Computing Market. This trend may enable retailers to analyze vast amounts of data more efficiently, leading to improved customer insights and more effective marketing strategies. The potential for automation in decision-making processes is also noteworthy.

Retail Edge Computing Market Market Drivers

Advancements in 5G Technology

The Retail Edge Computing Market is poised for growth due to advancements in 5G technology, which enhances connectivity and data transfer speeds. The deployment of 5G networks enables retailers to implement edge computing solutions that require low latency and high bandwidth. This technological evolution allows for more efficient processing of large volumes of data generated by IoT devices and customer interactions. As 5G becomes more widespread, it is anticipated that the Retail Edge Computing Market will expand, with projections suggesting a compound annual growth rate of over 30% in the coming years. Retailers are likely to capitalize on these advancements to improve operational efficiency and customer engagement.

Rise of Omnichannel Retailing

The Retail Edge Computing Market is significantly influenced by the rise of omnichannel retailing, which necessitates seamless integration across various sales channels. Retailers are increasingly adopting edge computing to ensure consistent customer experiences, whether online or in-store. This trend is supported by data indicating that 73% of consumers engage with multiple channels before making a purchase. By utilizing edge computing, retailers can manage inventory in real-time, personalize marketing efforts, and streamline logistics. Consequently, the demand for edge computing solutions is expected to grow, as retailers seek to enhance their omnichannel strategies and meet evolving consumer expectations.

Growing Demand for Real-Time Analytics

The Retail Edge Computing Market is experiencing a surge in demand for real-time analytics, driven by the need for immediate insights into consumer behavior and inventory management. Retailers are increasingly leveraging edge computing to process data closer to the source, enabling faster decision-making. According to recent estimates, the market for real-time analytics in retail is projected to reach USD 10 billion by 2026. This shift allows retailers to optimize operations, enhance customer experiences, and respond swiftly to market changes. As a result, the integration of edge computing solutions is becoming essential for retailers aiming to maintain a competitive edge in a rapidly evolving landscape.

Increased Focus on Customer Experience

The Retail Edge Computing Market is witnessing a heightened focus on customer experience, prompting retailers to adopt innovative technologies. Edge computing facilitates personalized shopping experiences by enabling real-time data processing and analysis. Retailers can utilize customer data to tailor promotions, optimize store layouts, and enhance service delivery. Research indicates that 86% of buyers are willing to pay more for a better customer experience, underscoring the importance of investing in edge computing solutions. As retailers strive to differentiate themselves in a crowded market, the integration of edge computing technologies becomes increasingly vital to meet customer demands and expectations.

Cost Efficiency and Operational Optimization

The Retail Edge Computing Market is increasingly driven by the need for cost efficiency and operational optimization. Retailers are recognizing that edge computing can reduce data transmission costs and minimize latency, leading to improved operational performance. By processing data locally, retailers can decrease reliance on centralized cloud services, which can be costly and time-consuming. Studies indicate that businesses implementing edge computing solutions can achieve up to 30% reduction in operational costs. This financial incentive, coupled with the potential for enhanced data processing capabilities, positions edge computing as a strategic investment for retailers aiming to streamline operations and improve profitability.

Market Segment Insights

By Component: Hardware (Largest) vs. Software (Fastest-Growing)

<p>In the Retail Edge Computing Market, the 'Component' segment exhibits a diverse distribution of market shares across Hardware, Software, and Services. Hardware commands the largest share, compelling retail businesses to invest significantly in powerful edge computing devices. Meanwhile, Software is witnessing an escalating interest as retailers increasingly seek solutions that enhance operational efficiency and customer experience. Services, while crucial, represent a smaller segment, primarily focusing on support and integration of these technologies.</p>

<p>Hardware (Dominant) vs. Software (Emerging)</p>

<p>Hardware plays a dominant role in the Retail Edge Computing Market by providing the essential infrastructure for data processing and analytics at the edge. This includes servers, routers, and networking equipment that ensure minimal latency and high availability. Conversely, Software represents an emerging facet, as retailers pursue sophisticated applications for data analytics, artificial intelligence, and <a href="https://www.marketresearchfuture.com/reports/machine-learning-market-2494">machine learning</a>. This growing trend is propelled by the need for real-time data insights, enabling improved decision-making and customer engagement. While Hardware remains foundational, the rapid evolution of Software solutions promises to redefine competitive dynamics in the market.</p>

By Application: Smart Cities (Largest) vs. Augmented Reality (Fastest-Growing)

<p>In the Retail Edge Computing Market, application segment distribution is diverse, with Smart Cities leading in market share due to the increasing need for data processing at the edge for urban infrastructure efficiency. The <a href="https://www.marketresearchfuture.com/reports/industrial-iot-platform-market-2186">Industrial Internet of Things</a> (IoT) also captures a substantial share, driven by the demand for interconnected devices in retail environments. Remote Monitoring and Content Delivery follow, as retailers leverage edge computing to enhance customer experiences through real-time data access and seamless media streaming. Meanwhile, Augmented Reality (AR) and Virtual Reality (VR) are gaining traction, enriching customer interaction and engagement. Growth trends in the Retail Edge Computing Market are propelled by factors such as the proliferation of smart devices and the rapid adoption of automation in retail businesses. The push for low-latency solutions fuels the demand for edge computing, especially in AR and VR applications, making them the fastest-growing segments. Retailers are increasingly recognizing the importance of harnessing real-time insights from edge devices to enhance customer satisfaction and operational efficiency, driving further investment in these technologies.</p>

<p>Smart Cities (Dominant) vs. Augmented Reality (Emerging)</p>

<p>Smart Cities represent a dominant application in the <a href="https://www.marketresearchfuture.com/reports/edge-computing-market-3239">Retail Edge Computing Market</a> Market, as retail infrastructures develop to integrate advanced technology for urban management and efficiency. This segment benefits from the deployment of smart sensors and AI to analyze city data, optimizing operations in areas such as traffic management and public safety. In contrast, Augmented Reality (AR) is rapidly emerging as a transformative tool for retailers, allowing consumers to visualize products in their environments before purchasing. This segment thrives on innovations that enhance user experience, enabling retailers to create immersive marketing strategies that resonate with tech-savvy consumers. As AR technologies become more mainstream, they are expected to drive significant growth and reshape consumer engagement in retail.</p>

By Organization Size: Large Enterprises (Largest) vs. SMEs (Fastest-Growing)

<p>In the Retail Edge Computing Market, Large Enterprises hold a significant share, leveraging substantial resources to implement advanced computing solutions. Their adoption of edge computing is driven by the need for real-time data processing and enhanced customer experience, ensuring they maintain a competitive edge. Conversely, SMEs are rapidly gaining traction as they increasingly recognize the value of edge computing in streamlining operations and reducing latency, leading to a more agile and responsive business model.</p>

<p>Large Enterprises (Dominant) vs. SMEs (Emerging)</p>

<p>Large Enterprises dominate the Retail Edge Computing Market, characterized by their ability to invest heavily in infrastructure and technology. These organizations typically integrate sophisticated edge solutions across their vast networks, optimizing supply chain management and <a href="https://www.marketresearchfuture.com/reports/customer-engagement-software-market-31632">customer engagement</a>. On the other hand, SMEs represent an emerging segment, strategically adopting edge computing to enhance operational efficiency. They benefit from agile frameworks that allow them to quickly adapt to market changes. As awareness grows and technology becomes more accessible, the gap between these segments narrows, with SMEs expected to significantly contribute to market expansion.</p>

Get more detailed insights about Retail Edge Computing Market Research Report – Forecast till 2035

Regional Insights

By region, the study provides the market insights into North America, Europe, Asia-Pacific and Rest of the World. The North America Retail Edge Computing Market dominated this market in 2022 (45.80%). IIoT and edge computing convergence is creating ideal conditions for American manufacturers to transition to connected manufacturing. A number of businesses have also developed to provide platforms for creating edge-enabled products, which are projected to accelerate the growth of the local market. Further, the U.S.

Retail Edge Computing Market held the largest market share, and the Canada Retail Edge Computing Market was the fastest growing market in the North America region.

Further, the major countries studied in the market report are The US, Canada, German, France, the UK, Italy, Spain, China, Japan, India, Australia, South Korea, and Brazil.

Figure 3: RETAIL EDGE COMPUTING MARKET SHARE BY REGION 2022 (USD Billion)

RETAIL EDGE COMPUTING MARKET SHARE BY REGION 2022

Source: Secondary Research, Primary Research, Market Research Future Database and Analyst Review

Europe Retail Edge Computing Market accounted for the healthy market share in 2022. The increasing presence of major firms with headquarters in Europe has a significant impact on the local market. These players include, among many others, IBM, Intel, and Microsoft. By combining with and buying small businesses, these corporations have been carefully extending their geographic reach and clientele. Further, the German Retail Edge Computing Market held the largest market share, and the U.K Retail Edge Computing Market was the fastest growing market in the European region.

The Asia Pacific Retail Edge Computing Market is expected to register significant growth from 2023 to 2032. This is due to the growing use of edge solutions in nations like China, India, and Japan. Government policies that assist IT infrastructure have also accelerated market expansion in the region. Moreover, China’s Retail Edge Computing Market held the largest market share, and the Indian Retail Edge Computing Market was the fastest growing market in the Asia-Pacific region.

Key Players and Competitive Insights

Leading market players are investing heavily in research and development in order to expand their product lines, which will help the Retail Edge Computing Market, grow even more. Market participants are also undertaking a variety of strategic activities to expand their global footprint, with important market developments including new product launches, contractual agreements, mergers and acquisitions, higher investments, and collaboration with other organizations. To expand and survive in a more competitive and rising market climate, Retail Edge Computing Industry must offer cost-effective items.

Manufacturing locally to minimize operational costs is one of the key business tactics used by manufacturers in the global Retail Edge Computing Industry to benefit clients and increase the market Application. In recent years, the Retail Edge Computing Industry has offered some of the most significant advantages to medicine.

Major players in the Retail Edge Computing Market, including Cisco, AWS, Dell Technologies, Google, HPE, Huawei, IBM, Intel, Litmus Automation, Microsoft, Nokia, ADLINK, Axellio, Capgemini, ClearBlade, Digi International, Fastly, StackPath, Vapor IO, GE Digital, Moxa, Sierra Wireless, Juniper Networks, EdgeConnex, Belden, Saguna Networks, Edge Intelligence, Edgeworx, Sunlight.io, Mutable, Hivecell, Section, and EdgeIQ, are attempting to increase market demand by investing in research and development operations.

IT infrastructure services are provided by Amazon Web Services, a cloud-based web platform. The business offers a range of services, including cloud computing, compute, networking, storage and content delivery, databases, analytics, application services, deployment and administration, mobile services, and investments, on a scalable cloud computing platform. In doing so, it makes it possible for e-commerce firms to launch and grow their cloud businesses while increasing their online sales.

Google LLC (Google), an affiliate of Alphabet Inc., provides online search and advertising services. The company's primary business segments include advertising, search, platforms and operating systems, enterprise products, and hardware. These are just a few of the products and services it provides: Google Search, Google Chrome, Google Docs, Google Calendar, Google Photos, Google Meet, Google Drive, Google Finance, Google Play Books, Google News, Google Earth, Google Ad Manager, Google Play, AdMob, Google Maps, AdSense, Gmail, Google Groups, and YouTube. The business has operations in the Americas, Europe, Asia-Pacific, Middle East, and Africa.

Google's main office is located in Mountain View, California, in the United States.

Key Companies in the Retail Edge Computing Market market include

Industry Developments

February 2022: In order to expand its hybrid cloud consulting business and offer sophisticated expertise to support Communications Service Providers (CSPs), IBM bought Sentaca. The corporation hoped to restructure its operations and update its cloud platforms with this acquisition.

Future Outlook

Retail Edge Computing Market Future Outlook

<p>The Retail Edge Computing Market is projected to grow at a 20.7% CAGR from 2024 to 2035, driven by increased demand for real-time data processing and enhanced customer experiences.</p>

New opportunities lie in:

  • <p>Integration of AI-driven analytics for personalized shopping experiences.</p><p>Deployment of edge-based inventory management systems to optimize stock levels.</p><p>Development of secure payment solutions leveraging edge computing technology.</p>

<p>By 2035, the Retail Edge Computing Market is expected to be a pivotal component of retail innovation.</p>

Market Segmentation

Retail Edge Computing Market Component Outlook

  • Hardware
  • Software
  • Services

Retail Edge Computing Market Application Outlook

  • Smart Cities
  • Industrial Internet of Things (IoT)
  • Remote Monitoring
  • Content Delivery
  • Augmented Reality (AR)
  • Virtual Reality (VR)
  • Others

Retail Edge Computing Market Organization Size Outlook

  • Large Enterprises
  • SMEs

Report Scope

MARKET SIZE 20246.337(USD Billion)
MARKET SIZE 20257.649(USD Billion)
MARKET SIZE 203550.2(USD Billion)
COMPOUND ANNUAL GROWTH RATE (CAGR)20.7% (2024 - 2035)
REPORT COVERAGERevenue Forecast, Competitive Landscape, Growth Factors, and Trends
BASE YEAR2024
Market Forecast Period2025 - 2035
Historical Data2019 - 2024
Market Forecast UnitsUSD Billion
Key Companies ProfiledMarket analysis in progress
Segments CoveredMarket segmentation analysis in progress
Key Market OpportunitiesIntegration of artificial intelligence and Internet of Things in Retail Edge Computing Market enhances operational efficiency.
Key Market DynamicsRising demand for real-time data processing drives innovation and competition in the Retail Edge Computing Market.
Countries CoveredNorth America, Europe, APAC, South America, MEA

FAQs

What is the projected market valuation of the Retail Edge Computing Market by 2035?

The Retail Edge Computing Market is projected to reach a valuation of 50.2 USD Billion by 2035.

What was the market valuation of the Retail Edge Computing Market in 2024?

In 2024, the Retail Edge Computing Market was valued at 6.337 USD Billion.

What is the expected CAGR for the Retail Edge Computing Market during the forecast period 2025 - 2035?

The expected CAGR for the Retail Edge Computing Market during the forecast period 2025 - 2035 is 20.7%.

Which companies are considered key players in the Retail Edge Computing Market?

Key players in the Retail Edge Computing Market include Amazon, Microsoft, IBM, Google, Cisco, Hewlett Packard Enterprise, Dell Technologies, EdgeConneX, and Fastly.

What are the main components of the Retail Edge Computing Market?

The main components of the Retail Edge Computing Market include hardware, software, and services, with valuations of 12.5 USD Billion, 20.0 USD Billion, and 17.7 USD Billion respectively.

How does the market size for large enterprises compare to SMEs in the Retail Edge Computing Market?

In the Retail Edge Computing Market, large enterprises are projected to reach a size of 32.0 USD Billion, while SMEs are expected to reach 18.2 USD Billion.

  1. SECTION I: EXECUTIVE SUMMARY AND KEY HIGHLIGHTS
    1. EXECUTIVE SUMMARY
      1. Market Overview
      2. Key Findings
      3. Market Segmentation
      4. Competitive Landscape
      5. Challenges and Opportunities
      6. Future Outlook
  2. SECTION II: SCOPING, METHODOLOGY AND MARKET STRUCTURE
    1. MARKET INTRODUCTION
      1. Definition
      2. Scope of the study
    2. RESEARCH METHODOLOGY
      1. Overview
      2. Data Mining
      3. Secondary Research
      4. Primary Research
      5. Forecasting Model
      6. Market Size Estimation
      7. Data Triangulation
      8. Validation
  3. SECTION III: QUALITATIVE ANALYSIS
    1. MARKET DYNAMICS
      1. Overview
      2. Drivers
      3. Restraints
      4. Opportunities
    2. MARKET FACTOR ANALYSIS
      1. Value chain Analysis
      2. Porter's Five Forces Analysis
      3. COVID-19 Impact Analysis
  4. SECTION IV: QUANTITATIVE ANALYSIS
    1. Information and Communications Technology, BY Component (USD Billion)
      1. Hardware
      2. Software
      3. Services
    2. Information and Communications Technology, BY Application (USD Billion)
      1. Smart Cities
      2. Industrial Internet of Things (IoT)
      3. Remote Monitoring
      4. Content Delivery
      5. Augmented Reality (AR)
      6. Virtual Reality (VR)
      7. Others
    3. Information and Communications Technology, BY Organization Size (USD Billion)
      1. Large Enterprises
      2. SMEs
    4. Information and Communications Technology, BY Region (USD Billion)
      1. North America
      2. Europe
      3. APAC
      4. South America
      5. MEA
  5. SECTION V: COMPETITIVE ANALYSIS
    1. Competitive Landscape
      1. Overview
      2. Competitive Analysis
      3. Market share Analysis
      4. Major Growth Strategy in the Information and Communications Technology
      5. Competitive Benchmarking
      6. Leading Players in Terms of Number of Developments in the Information and Communications Technology
      7. Key developments and growth strategies
      8. Major Players Financial Matrix
    2. Company Profiles
      1. Amazon (US)
      2. Microsoft (US)
      3. IBM (US)
      4. Google (US)
      5. Cisco (US)
      6. Hewlett Packard Enterprise (US)
      7. Dell Technologies (US)
      8. EdgeConneX (US)
      9. Fastly (US)
    3. Appendix
      1. References
      2. Related Reports
  6. LIST OF FIGURES
    1. MARKET SYNOPSIS
    2. NORTH AMERICA MARKET ANALYSIS
    3. US MARKET ANALYSIS BY COMPONENT
    4. US MARKET ANALYSIS BY APPLICATION
    5. US MARKET ANALYSIS BY ORGANIZATION SIZE
    6. CANADA MARKET ANALYSIS BY COMPONENT
    7. CANADA MARKET ANALYSIS BY APPLICATION
    8. CANADA MARKET ANALYSIS BY ORGANIZATION SIZE
    9. EUROPE MARKET ANALYSIS
    10. GERMANY MARKET ANALYSIS BY COMPONENT
    11. GERMANY MARKET ANALYSIS BY APPLICATION
    12. GERMANY MARKET ANALYSIS BY ORGANIZATION SIZE
    13. UK MARKET ANALYSIS BY COMPONENT
    14. UK MARKET ANALYSIS BY APPLICATION
    15. UK MARKET ANALYSIS BY ORGANIZATION SIZE
    16. FRANCE MARKET ANALYSIS BY COMPONENT
    17. FRANCE MARKET ANALYSIS BY APPLICATION
    18. FRANCE MARKET ANALYSIS BY ORGANIZATION SIZE
    19. RUSSIA MARKET ANALYSIS BY COMPONENT
    20. RUSSIA MARKET ANALYSIS BY APPLICATION
    21. RUSSIA MARKET ANALYSIS BY ORGANIZATION SIZE
    22. ITALY MARKET ANALYSIS BY COMPONENT
    23. ITALY MARKET ANALYSIS BY APPLICATION
    24. ITALY MARKET ANALYSIS BY ORGANIZATION SIZE
    25. SPAIN MARKET ANALYSIS BY COMPONENT
    26. SPAIN MARKET ANALYSIS BY APPLICATION
    27. SPAIN MARKET ANALYSIS BY ORGANIZATION SIZE
    28. REST OF EUROPE MARKET ANALYSIS BY COMPONENT
    29. REST OF EUROPE MARKET ANALYSIS BY APPLICATION
    30. REST OF EUROPE MARKET ANALYSIS BY ORGANIZATION SIZE
    31. APAC MARKET ANALYSIS
    32. CHINA MARKET ANALYSIS BY COMPONENT
    33. CHINA MARKET ANALYSIS BY APPLICATION
    34. CHINA MARKET ANALYSIS BY ORGANIZATION SIZE
    35. INDIA MARKET ANALYSIS BY COMPONENT
    36. INDIA MARKET ANALYSIS BY APPLICATION
    37. INDIA MARKET ANALYSIS BY ORGANIZATION SIZE
    38. JAPAN MARKET ANALYSIS BY COMPONENT
    39. JAPAN MARKET ANALYSIS BY APPLICATION
    40. JAPAN MARKET ANALYSIS BY ORGANIZATION SIZE
    41. SOUTH KOREA MARKET ANALYSIS BY COMPONENT
    42. SOUTH KOREA MARKET ANALYSIS BY APPLICATION
    43. SOUTH KOREA MARKET ANALYSIS BY ORGANIZATION SIZE
    44. MALAYSIA MARKET ANALYSIS BY COMPONENT
    45. MALAYSIA MARKET ANALYSIS BY APPLICATION
    46. MALAYSIA MARKET ANALYSIS BY ORGANIZATION SIZE
    47. THAILAND MARKET ANALYSIS BY COMPONENT
    48. THAILAND MARKET ANALYSIS BY APPLICATION
    49. THAILAND MARKET ANALYSIS BY ORGANIZATION SIZE
    50. INDONESIA MARKET ANALYSIS BY COMPONENT
    51. INDONESIA MARKET ANALYSIS BY APPLICATION
    52. INDONESIA MARKET ANALYSIS BY ORGANIZATION SIZE
    53. REST OF APAC MARKET ANALYSIS BY COMPONENT
    54. REST OF APAC MARKET ANALYSIS BY APPLICATION
    55. REST OF APAC MARKET ANALYSIS BY ORGANIZATION SIZE
    56. SOUTH AMERICA MARKET ANALYSIS
    57. BRAZIL MARKET ANALYSIS BY COMPONENT
    58. BRAZIL MARKET ANALYSIS BY APPLICATION
    59. BRAZIL MARKET ANALYSIS BY ORGANIZATION SIZE
    60. MEXICO MARKET ANALYSIS BY COMPONENT
    61. MEXICO MARKET ANALYSIS BY APPLICATION
    62. MEXICO MARKET ANALYSIS BY ORGANIZATION SIZE
    63. ARGENTINA MARKET ANALYSIS BY COMPONENT
    64. ARGENTINA MARKET ANALYSIS BY APPLICATION
    65. ARGENTINA MARKET ANALYSIS BY ORGANIZATION SIZE
    66. REST OF SOUTH AMERICA MARKET ANALYSIS BY COMPONENT
    67. REST OF SOUTH AMERICA MARKET ANALYSIS BY APPLICATION
    68. REST OF SOUTH AMERICA MARKET ANALYSIS BY ORGANIZATION SIZE
    69. MEA MARKET ANALYSIS
    70. GCC COUNTRIES MARKET ANALYSIS BY COMPONENT
    71. GCC COUNTRIES MARKET ANALYSIS BY APPLICATION
    72. GCC COUNTRIES MARKET ANALYSIS BY ORGANIZATION SIZE
    73. SOUTH AFRICA MARKET ANALYSIS BY COMPONENT
    74. SOUTH AFRICA MARKET ANALYSIS BY APPLICATION
    75. SOUTH AFRICA MARKET ANALYSIS BY ORGANIZATION SIZE
    76. REST OF MEA MARKET ANALYSIS BY COMPONENT
    77. REST OF MEA MARKET ANALYSIS BY APPLICATION
    78. REST OF MEA MARKET ANALYSIS BY ORGANIZATION SIZE
    79. KEY BUYING CRITERIA OF INFORMATION AND COMMUNICATIONS TECHNOLOGY
    80. RESEARCH PROCESS OF MRFR
    81. DRO ANALYSIS OF INFORMATION AND COMMUNICATIONS TECHNOLOGY
    82. DRIVERS IMPACT ANALYSIS: INFORMATION AND COMMUNICATIONS TECHNOLOGY
    83. RESTRAINTS IMPACT ANALYSIS: INFORMATION AND COMMUNICATIONS TECHNOLOGY
    84. SUPPLY / VALUE CHAIN: INFORMATION AND COMMUNICATIONS TECHNOLOGY
    85. INFORMATION AND COMMUNICATIONS TECHNOLOGY, BY COMPONENT, 2024 (% SHARE)
    86. INFORMATION AND COMMUNICATIONS TECHNOLOGY, BY COMPONENT, 2024 TO 2035 (USD Billion)
    87. INFORMATION AND COMMUNICATIONS TECHNOLOGY, BY APPLICATION, 2024 (% SHARE)
    88. INFORMATION AND COMMUNICATIONS TECHNOLOGY, BY APPLICATION, 2024 TO 2035 (USD Billion)
    89. INFORMATION AND COMMUNICATIONS TECHNOLOGY, BY ORGANIZATION SIZE, 2024 (% SHARE)
    90. INFORMATION AND COMMUNICATIONS TECHNOLOGY, BY ORGANIZATION SIZE, 2024 TO 2035 (USD Billion)
    91. BENCHMARKING OF MAJOR COMPETITORS
  7. LIST OF TABLES
    1. LIST OF ASSUMPTIONS
    2. North America MARKET SIZE ESTIMATES; FORECAST
      1. BY COMPONENT, 2025-2035 (USD Billion)
      2. BY APPLICATION, 2025-2035 (USD Billion)
      3. BY ORGANIZATION SIZE, 2025-2035 (USD Billion)
    3. US MARKET SIZE ESTIMATES; FORECAST
      1. BY COMPONENT, 2025-2035 (USD Billion)
      2. BY APPLICATION, 2025-2035 (USD Billion)
      3. BY ORGANIZATION SIZE, 2025-2035 (USD Billion)
    4. Canada MARKET SIZE ESTIMATES; FORECAST
      1. BY COMPONENT, 2025-2035 (USD Billion)
      2. BY APPLICATION, 2025-2035 (USD Billion)
      3. BY ORGANIZATION SIZE, 2025-2035 (USD Billion)
    5. Europe MARKET SIZE ESTIMATES; FORECAST
      1. BY COMPONENT, 2025-2035 (USD Billion)
      2. BY APPLICATION, 2025-2035 (USD Billion)
      3. BY ORGANIZATION SIZE, 2025-2035 (USD Billion)
    6. Germany MARKET SIZE ESTIMATES; FORECAST
      1. BY COMPONENT, 2025-2035 (USD Billion)
      2. BY APPLICATION, 2025-2035 (USD Billion)
      3. BY ORGANIZATION SIZE, 2025-2035 (USD Billion)
    7. UK MARKET SIZE ESTIMATES; FORECAST
      1. BY COMPONENT, 2025-2035 (USD Billion)
      2. BY APPLICATION, 2025-2035 (USD Billion)
      3. BY ORGANIZATION SIZE, 2025-2035 (USD Billion)
    8. France MARKET SIZE ESTIMATES; FORECAST
      1. BY COMPONENT, 2025-2035 (USD Billion)
      2. BY APPLICATION, 2025-2035 (USD Billion)
      3. BY ORGANIZATION SIZE, 2025-2035 (USD Billion)
    9. Russia MARKET SIZE ESTIMATES; FORECAST
      1. BY COMPONENT, 2025-2035 (USD Billion)
      2. BY APPLICATION, 2025-2035 (USD Billion)
      3. BY ORGANIZATION SIZE, 2025-2035 (USD Billion)
    10. Italy MARKET SIZE ESTIMATES; FORECAST
      1. BY COMPONENT, 2025-2035 (USD Billion)
      2. BY APPLICATION, 2025-2035 (USD Billion)
      3. BY ORGANIZATION SIZE, 2025-2035 (USD Billion)
    11. Spain MARKET SIZE ESTIMATES; FORECAST
      1. BY COMPONENT, 2025-2035 (USD Billion)
      2. BY APPLICATION, 2025-2035 (USD Billion)
      3. BY ORGANIZATION SIZE, 2025-2035 (USD Billion)
    12. Rest of Europe MARKET SIZE ESTIMATES; FORECAST
      1. BY COMPONENT, 2025-2035 (USD Billion)
      2. BY APPLICATION, 2025-2035 (USD Billion)
      3. BY ORGANIZATION SIZE, 2025-2035 (USD Billion)
    13. APAC MARKET SIZE ESTIMATES; FORECAST
      1. BY COMPONENT, 2025-2035 (USD Billion)
      2. BY APPLICATION, 2025-2035 (USD Billion)
      3. BY ORGANIZATION SIZE, 2025-2035 (USD Billion)
    14. China MARKET SIZE ESTIMATES; FORECAST
      1. BY COMPONENT, 2025-2035 (USD Billion)
      2. BY APPLICATION, 2025-2035 (USD Billion)
      3. BY ORGANIZATION SIZE, 2025-2035 (USD Billion)
    15. India MARKET SIZE ESTIMATES; FORECAST
      1. BY COMPONENT, 2025-2035 (USD Billion)
      2. BY APPLICATION, 2025-2035 (USD Billion)
      3. BY ORGANIZATION SIZE, 2025-2035 (USD Billion)
    16. Japan MARKET SIZE ESTIMATES; FORECAST
      1. BY COMPONENT, 2025-2035 (USD Billion)
      2. BY APPLICATION, 2025-2035 (USD Billion)
      3. BY ORGANIZATION SIZE, 2025-2035 (USD Billion)
    17. South Korea MARKET SIZE ESTIMATES; FORECAST
      1. BY COMPONENT, 2025-2035 (USD Billion)
      2. BY APPLICATION, 2025-2035 (USD Billion)
      3. BY ORGANIZATION SIZE, 2025-2035 (USD Billion)
    18. Malaysia MARKET SIZE ESTIMATES; FORECAST
      1. BY COMPONENT, 2025-2035 (USD Billion)
      2. BY APPLICATION, 2025-2035 (USD Billion)
      3. BY ORGANIZATION SIZE, 2025-2035 (USD Billion)
    19. Thailand MARKET SIZE ESTIMATES; FORECAST
      1. BY COMPONENT, 2025-2035 (USD Billion)
      2. BY APPLICATION, 2025-2035 (USD Billion)
      3. BY ORGANIZATION SIZE, 2025-2035 (USD Billion)
    20. Indonesia MARKET SIZE ESTIMATES; FORECAST
      1. BY COMPONENT, 2025-2035 (USD Billion)
      2. BY APPLICATION, 2025-2035 (USD Billion)
      3. BY ORGANIZATION SIZE, 2025-2035 (USD Billion)
    21. Rest of APAC MARKET SIZE ESTIMATES; FORECAST
      1. BY COMPONENT, 2025-2035 (USD Billion)
      2. BY APPLICATION, 2025-2035 (USD Billion)
      3. BY ORGANIZATION SIZE, 2025-2035 (USD Billion)
    22. South America MARKET SIZE ESTIMATES; FORECAST
      1. BY COMPONENT, 2025-2035 (USD Billion)
      2. BY APPLICATION, 2025-2035 (USD Billion)
      3. BY ORGANIZATION SIZE, 2025-2035 (USD Billion)
    23. Brazil MARKET SIZE ESTIMATES; FORECAST
      1. BY COMPONENT, 2025-2035 (USD Billion)
      2. BY APPLICATION, 2025-2035 (USD Billion)
      3. BY ORGANIZATION SIZE, 2025-2035 (USD Billion)
    24. Mexico MARKET SIZE ESTIMATES; FORECAST
      1. BY COMPONENT, 2025-2035 (USD Billion)
      2. BY APPLICATION, 2025-2035 (USD Billion)
      3. BY ORGANIZATION SIZE, 2025-2035 (USD Billion)
    25. Argentina MARKET SIZE ESTIMATES; FORECAST
      1. BY COMPONENT, 2025-2035 (USD Billion)
      2. BY APPLICATION, 2025-2035 (USD Billion)
      3. BY ORGANIZATION SIZE, 2025-2035 (USD Billion)
    26. Rest of South America MARKET SIZE ESTIMATES; FORECAST
      1. BY COMPONENT, 2025-2035 (USD Billion)
      2. BY APPLICATION, 2025-2035 (USD Billion)
      3. BY ORGANIZATION SIZE, 2025-2035 (USD Billion)
    27. MEA MARKET SIZE ESTIMATES; FORECAST
      1. BY COMPONENT, 2025-2035 (USD Billion)
      2. BY APPLICATION, 2025-2035 (USD Billion)
      3. BY ORGANIZATION SIZE, 2025-2035 (USD Billion)
    28. GCC Countries MARKET SIZE ESTIMATES; FORECAST
      1. BY COMPONENT, 2025-2035 (USD Billion)
      2. BY APPLICATION, 2025-2035 (USD Billion)
      3. BY ORGANIZATION SIZE, 2025-2035 (USD Billion)
    29. South Africa MARKET SIZE ESTIMATES; FORECAST
      1. BY COMPONENT, 2025-2035 (USD Billion)
      2. BY APPLICATION, 2025-2035 (USD Billion)
      3. BY ORGANIZATION SIZE, 2025-2035 (USD Billion)
    30. Rest of MEA MARKET SIZE ESTIMATES; FORECAST
      1. BY COMPONENT, 2025-2035 (USD Billion)
      2. BY APPLICATION, 2025-2035 (USD Billion)
      3. BY ORGANIZATION SIZE, 2025-2035 (USD Billion)
    31. PRODUCT LAUNCH/PRODUCT DEVELOPMENT/APPROVAL
    32. ACQUISITION/PARTNERSHIP

Retail Edge Computing Market Segmentation

Retail Edge Computing Market Component Outlook (USD Billion, 2018-2032)

Hardware

Software

Services

Retail Edge Computing Market Application Outlook (USD Billion, 2018-2032)

Smart Cities

Industrial Internet of Things (IIoT)

Remote Monitoring

Content Delivery

Augmented Reality (AR)

Virtual Reality (VR)

Others

Retail Edge Computing Market Organization Size Outlook (USD Billion, 2018-2032)

Large Enterprises

SMEs

Retail Edge Computing Market Regional Outlook (USD Billion, 2018-2032)

North America Outlook (USD Billion, 2018-2032)

Retail Edge Computing Market by Component

Hardware

Software

Services

Retail Edge Computing Market by Application

Smart Cities

Industrial Internet of Things (IIoT)

Remote Monitoring

Content Delivery

Augmented Reality (AR)

Virtual Reality (VR)

Others

Retail Edge Computing Market by Organization Size

Large Enterprises

SMEs

US Outlook (USD Billion, 2018-2032)

Retail Edge Computing Market by Component

Hardware

Software

Services

Retail Edge Computing Market by Application

Smart Cities

Industrial Internet of Things (IIoT)

Remote Monitoring

Content Delivery

Augmented Reality (AR)

Virtual Reality (VR)

Others

Retail Edge Computing Market by Organization Size

Large Enterprises

SMEs

Canada Outlook (USD Billion, 2018-2032)

Retail Edge Computing Market by Component

Hardware

Software

Services

Retail Edge Computing Market by Application

Smart Cities

Industrial Internet of Things (IIoT)

Remote Monitoring

Content Delivery

Augmented Reality (AR)

Virtual Reality (VR)

Others

Retail Edge Computing Market by Organization Size

Large Enterprises

SMEs

Europe Outlook (USD Billion, 2018-2032)

Retail Edge Computing Market by Component

Hardware

Software

Services

Retail Edge Computing Market by Application

Smart Cities

Industrial Internet of Things (IIoT)

Remote Monitoring

Content Delivery

Augmented Reality (AR)

Virtual Reality (VR)

Others

Retail Edge Computing Market by Organization Size

Large Enterprises

SMEs

Germany Outlook (USD Billion, 2018-2032)

Retail Edge Computing Market by Component

Hardware

Software

Services

Retail Edge Computing Market by Application

Smart Cities

Industrial Internet of Things (IIoT)

Remote Monitoring

Content Delivery

Augmented Reality (AR)

Virtual Reality (VR)

Others

Retail Edge Computing Market by Organization Size

Large Enterprises

SMEs

France Outlook (USD Billion, 2018-2032)

Retail Edge Computing Market by Component

Hardware

Software

Services

Retail Edge Computing Market by Application

Smart Cities

Industrial Internet of Things (IIoT)

Remote Monitoring

Content Delivery

Augmented Reality (AR)

Virtual Reality (VR)

Others

Retail Edge Computing Market by Organization Size

Large Enterprises

SMEs

UK Outlook (USD Billion, 2018-2032)

Retail Edge Computing Market by Component

Hardware

Software

Services

Retail Edge Computing Market by Application

Smart Cities

Industrial Internet of Things (IIoT)

Remote Monitoring

Content Delivery

Augmented Reality (AR)

Virtual Reality (VR)

Others

Retail Edge Computing Market by Organization Size

Large Enterprises

SMEs

Italy Outlook (USD Billion, 2018-2032)

Retail Edge Computing Market by Component

Hardware

Software

Services

Retail Edge Computing Market by Application

Smart Cities

Industrial Internet of Things (IIoT)

Remote Monitoring

Content Delivery

Augmented Reality (AR)

Virtual Reality (VR)

Others

Retail Edge Computing Market by Organization Size

Large Enterprises

SMEs

Spain Outlook (USD Billion, 2018-2032)

Retail Edge Computing Market by Component

Hardware

Software

Services

Retail Edge Computing Market by Application

Smart Cities

Industrial Internet of Things (IIoT)

Remote Monitoring

Content Delivery

Augmented Reality (AR)

Virtual Reality (VR)

Others

Retail Edge Computing Market by Organization Size

Large Enterprises

SMEs

Rest Of Europe Outlook (USD Billion, 2018-2032)

Retail Edge Computing Market by Component

Hardware

Software

Services

Retail Edge Computing Market by Application

Smart Cities

Industrial Internet of Things (IIoT)

Remote Monitoring

Content Delivery

Augmented Reality (AR)

Virtual Reality (VR)

Others

Retail Edge Computing Market by Organization Size

Large Enterprises

SMEs

Asia-Pacific Outlook (USD Billion, 2018-2032)

Retail Edge Computing Market by Component

Hardware

Software

Services

Retail Edge Computing Market by Application

Smart Cities

Industrial Internet of Things (IIoT)

Remote Monitoring

Content Delivery

Augmented Reality (AR)

Virtual Reality (VR)

Others

Retail Edge Computing Market by Organization Size

Large Enterprises

SMEs

China Outlook (USD Billion, 2018-2032)

Retail Edge Computing Market by Component

Hardware

Software

Services

Retail Edge Computing Market by Application

Smart Cities

Industrial Internet of Things (IIoT)

Remote Monitoring

Content Delivery

Augmented Reality (AR)

Virtual Reality (VR)

Others

Retail Edge Computing Market by Organization Size

Large Enterprises

SMEs

Japan Outlook (USD Billion, 2018-2032)

Retail Edge Computing Market by Component

Hardware

Software

Services

Retail Edge Computing Market by Application

Smart Cities

Industrial Internet of Things (IIoT)

Remote Monitoring

Content Delivery

Augmented Reality (AR)

Virtual Reality (VR)

Others

Retail Edge Computing Market by Organization Size

Large Enterprises

SMEs

India Outlook (USD Billion, 2018-2032)

Retail Edge Computing Market by Component

Hardware

Software

Services

Retail Edge Computing Market by Application

Smart Cities

Industrial Internet of Things (IIoT)

Remote Monitoring

Content Delivery

Augmented Reality (AR)

Virtual Reality (VR)

Others

Retail Edge Computing Market by Organization Size

Large Enterprises

SMEs

Australia Outlook (USD Billion, 2018-2032)

Retail Edge Computing Market by Component

Hardware

Software

Services

Retail Edge Computing Market by Application

Smart Cities

Industrial Internet of Things (IIoT)

Remote Monitoring

Content Delivery

Augmented Reality (AR)

Virtual Reality (VR)

Others

Retail Edge Computing Market by Organization Size

Large Enterprises

SMEs

Rest of Asia-Pacific Outlook (USD Billion, 2018-2032)

Retail Edge Computing Market by Component

Hardware

Software

Services

Retail Edge Computing Market by Application

Smart Cities

Industrial Internet of Things (IIoT)

Remote Monitoring

Content Delivery

Augmented Reality (AR)

Virtual Reality (VR)

Others

Retail Edge Computing Market by Organization Size

Large Enterprises

SMEs

Rest of the World Outlook (USD Billion, 2018-2032)

Retail Edge Computing Market by Component

Hardware

Software

Services

Retail Edge Computing Market by Application

Smart Cities

Industrial Internet of Things (IIoT)

Remote Monitoring

Content Delivery

Augmented Reality (AR)

Virtual Reality (VR)

Others

Retail Edge Computing Market by Organization Size

Large Enterprises

SMEs

Middle East Outlook (USD Billion, 2018-2032)

Retail Edge Computing Market by Component

Hardware

Software

Services

Retail Edge Computing Market by Application

Smart Cities

Industrial Internet of Things (IIoT)

Remote Monitoring

Content Delivery

Augmented Reality (AR)

Virtual Reality (VR)

Others

Retail Edge Computing Market by Organization Size

Large Enterprises

SMEs

Africa Outlook (USD Billion, 2018-2032)

Retail Edge Computing Market by Component

Hardware

Software

Services

Retail Edge Computing Market by Application

Smart Cities

Industrial Internet of Things (IIoT)

Remote Monitoring

Content Delivery

Augmented Reality (AR)

Virtual Reality (VR)

Others

Retail Edge Computing Market by Organization Size

Large Enterprises

SMEs

Latin America Outlook (USD Billion, 2018-2032)

Retail Edge Computing Market by Component

Hardware

Software

Services

Retail Edge Computing Market by Application

Smart Cities

Industrial Internet of Things (IIoT)

Remote Monitoring

Content Delivery

Augmented Reality (AR)

Virtual Reality (VR)

Others

Retail Edge Computing Market by Organization Size

Large Enterprises

SMEs

Infographic

Free Sample Request

Kindly complete the form below to receive a free sample of this Report

Get Free Sample

Customer Strories

“I am very pleased with how market segments have been defined in a relevant way for my purposes (such as "Portable Freezers & refrigerators" and "last-mile"). In general the report is well structured. Thanks very much for your efforts.”

Victoria Milne

Founder

Compare Licence

×
Features License Type
Single User Multiuser License Enterprise User
Price $4,950 $5,950 $7,250
Maximum User Access Limit 1 User Upto 10 Users Unrestricted Access Throughout the Organization
Free Customization
Direct Access to Analyst
Deliverable Format
Platform Access
Discount on Next Purchase 10% 15% 15%
Printable Versions