Scrubber System Market (2025 - 2035)

Scrubber System Market Research Report By Technology (Wet Scrubbers, Dry Scrubbers, Electrostatic Precipitators (Integrated)), By Application (Marine, Industrial Power Generation, Chemical & Petrochemical, Cement & Metals, Other Industrial), By Configuration (Marine Segment) (Open-Loop, Closed-Loop, Hybrid) and By Regional (North America, Europe, South America, Asia Pacific, Middle East and Africa) - Industry Forecast to 2035
ID: MRFR/EnP/5197-HCR
100 Pages
Chitranshi Jaiswal
Last Updated: July 24, 2026
Scrubber System Market
Market Size
Forecast Period2025-2035
CAGR (2025-2035)8.68%
2024 Market Size1270.89(USD Million)
2025 Market Size1381.23(USD Million)
2035 Market Size3175.73(USD Million)
Key Players
Wärtsilä
Alfa Laval
Yara Marine Technologies
Andritz AG
Babcock & Wilcox
CR Ocean Engineering
Opportunities
  • Hybrid and Multi-Pollutant Scrubber Systems
  • Emerging Market Industrialization
  • Digital Monitoring and Predictive Maintenance

Scrubber System Market Summary

The global Scrubber System Market reached an estimated USD 4.85 billion in 2025, driven by the sustained enforcement of IMO sulfur cap regulations and increasingly aggressive industrial emission standards across major economies. Starting from a projected USD 5.20 billion in 2026, the Scrubber System Market is expected to grow at a CAGR of 7.2% through 2035, reaching approximately USD 9.72 billion by the end of the forecast period. Two policy catalysts anchor this trajectory: the IMO's global 0.50% sulfur limit on marine fuels, which pushed fleet operators toward exhaust gas cleaning retrofits at scale, and the tightening of national ambient air quality standards in China, the EU, and India that are forcing coal-fired power plants and heavy industry to install or upgrade flue gas desulfurization (FGD) equipment [1][2].

A generational technology shift is reshaping how both maritime and stationary emission sources manage sulfur oxides and particulate matter. Legacy single-pass open-loop systems are giving way to closed-loop and hybrid configurations that can operate in zero-discharge port zones. On the industrial side, conventional limestone-based scrubbers are being supplemented by advanced semi-dry and circulating dry reactor designs that handle multi-pollutant streams — SOx, HCl, and heavy metals — in a single tower. Capital investment in marine scrubber retrofits alone exceeded USD 12 billion cumulatively between 2019 and 2024, according to industry shipyard data [3][4].

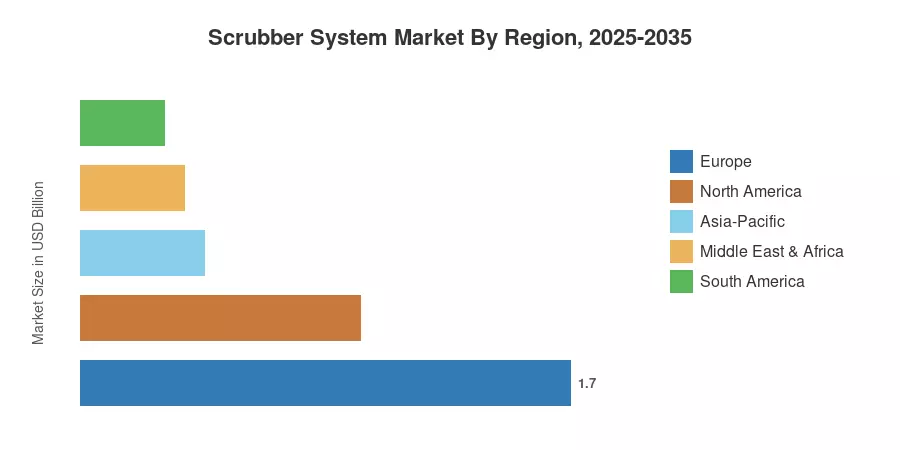
Europe currently dominates the Scrubber System Market with roughly 35% of global revenue, anchored by the North Sea and Baltic Sulfur Emission Control Areas (SECAs) and the EU Emissions Trading System's extension to maritime. Asia-Pacific is the fastest-growing region at an estimated 8.9% CAGR, propelled by China's ultra-low emission mandate for power plants and India's coal fleet expansion. North America holds the second-largest regional share at approximately 20%, supported by EPA Clean Air Act enforcement and Canadian SECA compliance. The convergence of decarbonization policy and air quality regulation will keep scrubber demand elevated well into the 2030s.


Key Report Takeaways — Scrubber System Market

By Technology

  • Wet scrubbers command the largest technology share of the Scrubber System Market at approximately 58% of 2025 revenue, reflecting decades of deployment in both marine and industrial settings.
  • Dry and semi-dry scrubber technologies are forecast to register the fastest segment CAGR of 8.6% through 2035, gaining ground in water-scarce inland regions.
  • Hybrid scrubber configurations are growing rapidly in the marine sector, with an estimated installed base of over 5,200 units globally as of 2024.

By Application

  • Marine applications account for an estimated 44% share of the Scrubber System Market, sustained by ongoing newbuild installations and retrofit demand.
  • Industrial power generation represents the second-largest application, valued at approximately USD 1.26 billion in 2025.
  • Chemical and petrochemical facilities are growing at a projected 7.8% CAGR as tighter acid gas regulations expand scrubber adoption beyond traditional power applications.

By Region

  • Europe's Scrubber System Market share of ~35% reflects stringent SECA enforcement and EU ETS maritime inclusion.
  • Asia-Pacific is projected to reach approximately USD 4.12 billion by 2035, driven by China and India emission mandates.
  • The Middle East & Africa region is forecast to grow at a 7.5% CAGR as refinery and desalination plant investments accelerate.


Scrubber System Market Size and Forecast (2021–2035)

Market sizing integrates primary interviews with scrubber OEMs, shipyard procurement data, EPA and IMO compliance filings, and cross-validation against published industry shipment databases. Historical figures (2021–2024) reflect actual installations and order backlogs; the base year (2025) blends confirmed contracts with near-term pipeline estimates. Forecast values (2026–2035) apply a bottom-up model calibrated to regulatory phase-in schedules and fleet age profiles.
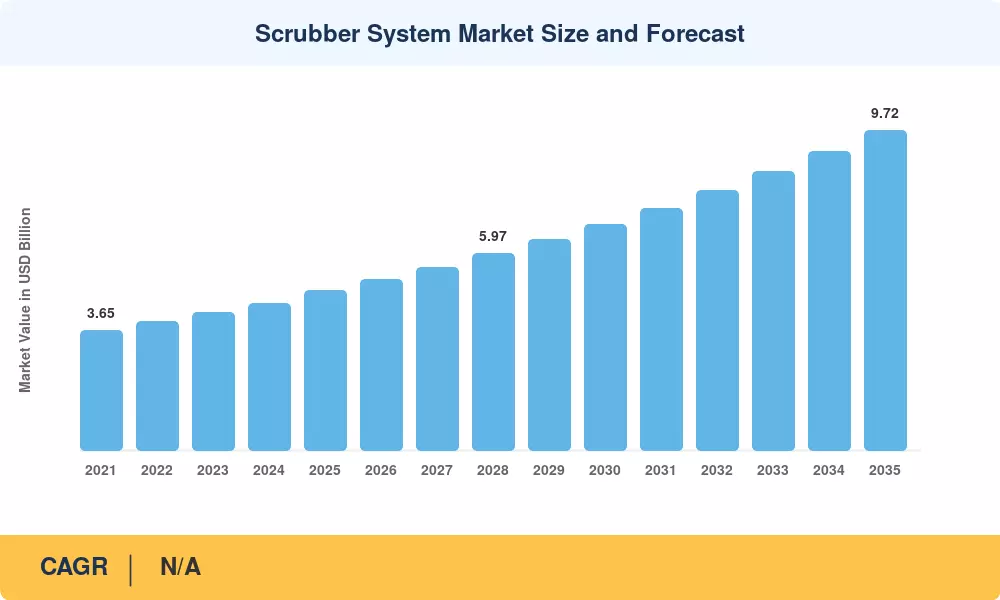
Scrubber System Market Size and Forecast
Our Impact
Enabled $4.3B Revenue Impact for Fortune 500 and Leading Multinationals
Partnering with 2000+ Global Organizations Each Year
30K+ Citations by Top-Tier Firms in the Industry

Driver Impact Analysis

Driver ~% Impact on CAGR Geographic Relevance Impact Timeline
IMO 2020 sulfur cap & SECA expansion +1.8% Global / Europe Long-term (≥4 yr)
EU ETS extension to maritime shipping +1.2% Europe Medium-term (2–4 yr)
China ultra-low emission standards +1.1% Asia-Pacific Short-term (≤2 yr)
India coal fleet FGD retrofit mandate +0.9% Asia-Pacific Medium-term (2–4 yr)
North American EPA MATS & NAAQS tightening +0.7% North America Long-term (≥4 yr)
Proposed Mediterranean SECA designation +0.6% Europe / MEA Medium-term (2–4 yr)
Rising heavy fuel oil–LSFO price spread +0.5% Global Short-term (≤2 yr)


IMO Sulfur Regulations and SECA Expansion

The International Maritime Organization's 0.50% global sulfur cap, enforced since January 2020, remains the single largest demand catalyst for the Scrubber System Market. Flag-state port inspections rose 34% between 2021 and 2024, and the IMO's Marine Environment Protection Committee continues to evaluate new Emission Control Areas — including the Mediterranean, which could add an estimated 8,000 additional vessel transits per year requiring compliant exhaust gas cleaning [1][7]. Ship operators running scrubbers save an average of USD 150–200 per metric ton versus purchasing compliant low-sulfur fuel, creating a payback window of 12–18 months on a typical Capesize retrofit [3].

EU ETS Maritime Inclusion

Starting in 2024, the European Union phased shipping into its Emissions Trading System, initially covering 40% of verified emissions from intra-EU voyages and ramping to 100% by 2026. While the ETS primarily targets CO₂, it has intensified fleet scrutiny on total emission profiles and encouraged integrated scrubber-plus-carbon-capture pilot programs. The combined regulatory burden is pushing shipowners to invest in multi-pollutant abatement towers rather than piecemeal solutions [6][12].

China's Ultra-Low Emission Program

China's Ministry of Ecology and Environment mandates that all coal-fired power plants achieve SOx concentrations below 35 mg/m³ — roughly one-tenth of U.S. EPA limits. By mid-2024, over 1,050 GW of coal capacity had been retrofitted with compliant FGD scrubbers, and the program is extending to steel, cement, and glass production under Phase III guidelines issued in 2023 [5]. This single national program accounts for an estimated 22% of global industrial scrubber demand.

India's Thermal Power FGD Mandate

India's Central Pollution Control Board (CPCB) has required all coal-fired power stations to install FGD systems, with staggered deadlines running through 2027. Approximately 75 GW of capacity still awaits FGD commissioning as of early 2025, representing a procurement pipeline valued at roughly USD 4.5 billion for equipment and installation combined [8][13]. This mandate directly supports the Scrubber System Market growth trajectory in South and Southeast Asia.


Restraints Impact Analysis

Restraint impact percentages are directional estimates and should not be netted directly against driver impacts to derive a residual CAGR figure.

Restraint ~% Impact on CAGR Geographic Relevance Impact Timeline
Open-loop scrubber discharge bans in ports –0.8% Europe / Asia-Pacific Short-term (≤2 yr)
High retrofit capital costs for older vessels –0.6% Global Medium-term (2–4 yr)
LNG & methanol as alternative compliance paths –0.5% Europe / North America Long-term (≥4 yr)
Water scarcity limiting wet scrubber use inland –0.4% MEA / South Asia Long-term (≥4 yr)
Regulatory uncertainty on washwater chemistry –0.3% Global Medium-term (2–4 yr)


Port-Level Discharge Restrictions

More than 50 ports around the world, including Singapore, Fujairah and important Chinese coastal ports, have prohibited or restricted open-loop scrubber discharges amid concerns over acidification and heavy metals in port waters. The uncoordinated regulatory environment also complicates operational planning for shipowners, and increases demand for more expensive closed-loop and hybrid units, rising overall system costs by 25–40% over open-loop alternatives [14].


Alternative Marine Fuel Adoption

LNG-fueled newbuilds accounted for approximately 30% of gross tonnage ordered in 2024, according to Clarkson Research. Methanol dual-fuel engines are also gaining traction, particularly in the container segment. Each LNG or methanol vessel that enters service without a scrubber represents displaced equipment demand. While alternative fuels do not eliminate the need for exhaust treatment entirely — methane slip and formaldehyde require their own abatement — they reduce the Scrubber System Market addressable fleet over the long term [15][17].


Capital Cost and Payback Sensitivity


Scrubber System Market Opportunities

Hybrid and Multi-Pollutant Scrubber Systems

Regulatory convergence in SOx, NOx and particulate matter and increasingly in greenhouse gases has stimulated demand for integrated multi-pollutant abatement towers. Equipment makers that combine scrubbing, selective catalytic reduction and carbon-capture modules into a single stack footprint can charge a premium and cut shipyard installation by 30–40%. This trend toward integration is particularly strong in Europe and East Asia.


Emerging Market Industrialization

Through to 2030, India, Vietnam, Indonesia and Bangladesh combined are adding more than 120GW of coal and heavy-industry capacity. Most of this new capacity will need emissions control equipment that meets ever-stringent national standards. The Scrubber System Market opportunity in these geographies is forecast to reach over USD 3 billion in cumulative opportunity through 2035, offering OEMs a high-growth corridor outside of saturated Western markets[8][13].


Digital Monitoring and Predictive Maintenance

Scrubber OEMs are embedding IoT sensors and cloud-based analytics platforms into their systems to offer continuous emission monitoring, reagent optimization, and predictive maintenance scheduling. These digital overlays create recurring service revenue streams — estimated at 8–12% of initial equipment value annually — and improve compliance documentation for flag-state inspections. Early adopters report 15–20% reductions in reagent consumption through AI-driven dosing algorithms [18].

Retrofit Demand in the Aging Global Fleet

Approximately 40% of the global commercial fleet by deadweight tonnage is over 15 years old, and many of these vessels were built before scrubber-ready designs became standard. Retrofit demand remains a durable growth pocket for the Scrubber System Market, especially for tankers and bulk carriers trading on long-haul routes where fuel-cost savings are highest[3].

Scrubber-Based Carbon Capture Pilots

Several European maritime research consortia are testing seawater-based CO₂ absorption integrated with existing scrubber infrastructure. If proven commercially viable, this could transform installed scrubber systems into carbon-capture assets, dramatically expanding their value proposition and extending equipment lifetimes. Pilot results expected by 2028 could unlock a new revenue layer for the Scrubber System Market[19].


Scrubber System Market Future Outlook

Regulatory Convergence and Multi-Pollutant Mandates

The next decade will see a fundamental shift from single-pollutant regulation to integrated multi-pollutant frameworks. The IMO's revised GHG strategy targets a 20% reduction in shipping emissions by 2030 (compared to 2008 levels), and regional authorities are bundling SOx, NOx, and PM requirements into unified permits. This convergence directly benefits the Scrubber System Market by incentivizing equipment capable of addressing multiple pollutants simultaneously, driving up unit values and complexity [1][19].

Digitalization and Autonomous Emission Management

By 2030, an estimated 60% of new scrubber installations will incorporate embedded sensors, real-time emission dashboards, and remote diagnostic capabilities, according to DNV classification projections. Autonomous dosing control — where AI algorithms adjust reagent flow rates based on exhaust composition, engine load, and fuel sulfur content — will reduce operating costs by 10–15% and improve regulatory compliance documentation. These digital layers are transforming scrubbers from passive equipment into active compliance management platforms [18].

Alternative Fuels Coexistence

Rather than eliminating scrubber demand, the growth of LNG, methanol, and ammonia as marine fuels is creating a mixed-fleet environment. IEA projections estimate that heavy fuel oil will still power approximately 55% of global shipping tonnage-miles in 2035. Vessels continuing to burn residual fuels will require scrubbers, while dual-fuel vessels may still need exhaust treatment for methane slip or formaldehyde emissions. The Scrubber System Market will increasingly serve a bifurcated fleet rather than a universal one [15][17].

ESG Reporting and Green Finance Incentives

Tightening ESG disclosure requirements — including the EU Corporate Sustainability Reporting Directive and SEC climate risk rules — are compelling shipowners and industrial operators to demonstrate measurable emission reductions. Scrubber installations provide quantifiable SOx and PM abatement data that feeds directly into sustainability reports and green bond eligibility criteria. The Scrubber System Market stands to benefit from green shipping finance programs, with the Poseidon Principles-aligned lending portfolio exceeding USD 200 billion by 2024 [6][20].


Scrubber System Market Segmentation

By Technology

Segment Key Metric Primary Demand Driver
Wet Scrubbers ~58% share (2025) Proven marine and industrial performance
Dry Scrubbers CAGR of 8.6% Water-scarce regions; multi-pollutant capability
Electrostatic Precipitators (integrated) ~USD 0.42 B (2025) Cement and metal industries; fine particulate control


Wet scrubbers remain the backbone of the Scrubber System Market, deployed across both marine and industrial applications for their high SOx removal efficiency (typically 95–99%) and relatively straightforward engineering. Open-loop variants dominate ocean-going vessel installations due to lower capital costs, while closed-loop systems are increasingly specified for vessels trading in restricted discharge zones. The wet segment benefits from decades of operational data and broad OEM competition, which has progressively driven down per-unit costs.

Dry and semi-dry scrubber technologies are the fastest-growing segment, gaining traction in regions where water availability is limited or where waste slurry disposal faces regulatory hurdles. Spray dryer absorbers and circulating dry reactors handle SOx and HCl simultaneously, making them attractive for coal-fired power plants in India, the Middle East, and inland China. Their lower water consumption — roughly 50–70% less than wet systems — positions them favorably as water-stress concerns intensify globally.

By Application

Segment Key Metric Primary Demand Driver
Marine ~44% share (2025) IMO 2020 compliance; SECA expansion
Industrial Power Generation ~USD 1.26 B (2025) FGD mandates in China, India, U.S.
Chemical & Petrochemical CAGR of 7.8% Acid gas and hazardous air pollutant rules
Cement & Metals ~12% share (2025) Kiln emission controls; PM standards
Other Industrial CAGR of 6.5% Waste-to-energy; pulp and paper


Marine applications anchor the Scrubber System Market, with over 5,500 vessels fitted with exhaust gas cleaning systems by mid-2025 according to classification society data. The installed base is concentrated in container, tanker, and bulk carrier segments where HFO consumption is highest and fuel-cost savings justify the capital outlay. Retrofit activity has shifted from large crude carriers toward mid-size bulk and product tankers as payback economics have improved.

Industrial power generation represents the second-largest demand pool. China alone has retrofitted over 1,050 GW of coal capacity with FGD scrubbers, and India's mandate covers an additional 75 GW awaiting commissioning. In North America, EPA MATS compliance continues to sustain replacement and upgrade cycles for wet and dry FGD systems at aging coal and petroleum coke plants.

By Configuration (Marine Segment)

Segment Key Metric Primary Demand Driver
Open-Loop ~52% of marine installations Lower capital cost; deep-sea operation
Closed-Loop ~USD 0.58 B (2025) Zero-discharge port compliance
Hybrid CAGR of 9.4% Operational flexibility across all zones


Open-loop systems still account for the majority of installed marine scrubbers, owing to their simpler design and lower upfront cost — typically USD 1.5–3 million for a mid-size vessel. Their reliance on seawater discharge, however, limits operability in an expanding list of restricted ports. Hybrid units, which can switch between open and closed modes, are the fastest-growing configuration. Shipowners increasingly view the 25–40% cost premium for hybrid over open-loop as insurance against regulatory risk in the Scrubber System Market.


Regional Market Share Analysis

Region Key Metric Primary Investment Themes
Europe ~35% market share (2025) SECA enforcement; EU ETS maritime; FGD upgrades
Asia-Pacific 8.9% CAGR (2026–2035) China ultra-low emission; India FGD mandate; fleet growth
North America ~USD 0.97 B (2025) EPA MATS compliance; Canadian SECA; refinery upgrades
South America ~6% market share (2025) Brazilian thermal plants; mining sector scrubbers
Middle East & Africa 7.5% CAGR (2026–2035) Refinery expansion; desalination co-location; port growth
Total USD 4.85 B (2025)

The Scrubber System Market reflects distinct regional dynamics shaped by maritime trade intensity, industrial emission regulations, and fuel-price economics. Europe leads on both regulatory stringency and installed base, while Asia-Pacific delivers the strongest volume growth.


Europe

Country Key Metric Key Driver
Germany ~22% of regional share Industrial FGD and North Sea fleet compliance
Norway CAGR of 8.1% Offshore fleet scrubber adoption
United Kingdom ~USD 0.18 B (2025) Post-Brexit independent SECA standards
Netherlands ~14% of regional share Rotterdam port retrofit hub
Rest of Europe ~38% of regional share Mediterranean SECA preparation


Europe's dominance in the Scrubber System Market is built on the world's most stringent maritime and industrial emission frameworks. The Baltic and North Sea SECAs have operated with a 0.10% sulfur limit since 2015, a decade ahead of global standards. Germany and the Netherlands serve as scrubber manufacturing and retrofit hubs, while Scandinavian shipowners were early adopters of hybrid configurations. The proposed Mediterranean SECA, if adopted by 2027, would extend compliance requirements to an additional 15,000-plus vessel transits annually [7][12].

Asia-Pacific

Country Key Metric Key Driver
China ~42% of regional share Ultra-low emission mandate; Domestic Emission Control Areas
Japan CAGR of 7.4% Fleet modernization and coastal ECA
South Korea ~USD 0.16 B (2025) Shipbuilding integration; LNG–scrubber hybrid
India CAGR of 10.2% CPCB thermal power FGD deadline
Rest of APAC ~18% of regional share Vietnam and Indonesia coal plant buildout


China's Domestic Emission Control Areas, covering the Bohai Sea, Yangtze River Delta, and Pearl River Delta, require vessels to burn fuel with no more than 0.50% sulfur while in port. This policy, combined with the ultra-low emission program for stationary sources, makes China the largest single-country contributor to the Scrubber System Market in Asia-Pacific. India's staggered FGD mandate for thermal power plants represents the region's most significant greenfield opportunity [5][8].

North America

Country Key Metric Key Driver
United States ~72% of regional share EPA MATS; Great Lakes ECA; refinery FCCU scrubbers
Canada CAGR of 6.8% Arctic shipping corridor; oil sands FGD
Mexico ~USD 0.06 B (2025) Refinery modernization under SEMARNAT


The United States accounts for the bulk of the North American Scrubber System Market, driven by EPA Mercury and Air Toxics Standards (MATS) for power plants and the North American ECA for coastal shipping. The Great Lakes region has seen accelerated scrubber retrofit activity as vessel operators serving inland waterways face limited access to low-sulfur bunker fuel. Canadian demand centers on oil sands operations where wet scrubber systems manage SO₂ and particulate emissions from upgrader stacks [10][16].

South America

Country Key Metric Key Driver
Brazil ~58% of regional share Thermal power scrubber retrofits; CONAMA standards
Chile CAGR of 7.9% Mining smelter emission controls
Rest of South America ~22% of regional share Cement and steel sector expansion


Brazil's thermoelectric fleet, which burns coal and petroleum coke in the southern states, is the primary demand source in South America. Chile's copper smelting industry faces tightened SO₂ limits that are accelerating scrubber adoption in the Atacama mining corridor. The Scrubber System Market in South America remains relatively nascent but is growing as environmental enforcement strengthens [13].

Middle East & Africa

Country Key Metric Key Driver
Saudi Arabia ~30% of regional share Refinery and petrochemical complex expansion
UAE CAGR of 8.3% Fujairah port services; gas processing scrubbers
South Africa ~USD 0.05 B (2025) Coal power fleet emission upgrades
Rest of MEA ~35% of regional share Desalination and cement industry growth


The Middle East's refinery expansion cycle — with Saudi Arabia, Kuwait, and Iraq collectively adding over 2 million barrels per day of new capacity through 2030 — is a direct catalyst for industrial scrubber demand. The UAE's Fujairah has emerged as a regional scrubber retrofit hub for vessels transiting the Suez Canal. In Sub-Saharan Africa, South Africa's aging coal fleet and Nigeria's cement industry represent smaller but growing pockets of demand for the Scrubber System Market [9][16].


Scrubber System Market By Region, 2025-2035

Competitive Benchmarking

The Scrubber System Market exhibits moderate concentration, with an estimated HHI of approximately 850–1,000 and the top five players commanding roughly 40–48% of global revenue. The landscape blends specialized marine scrubber manufacturers with diversified industrial air pollution control companies. Competition centers on system reliability, discharge compliance, and total cost of ownership rather than pure price, though smaller regional players compete aggressively on retrofit pricing in Asia-Pacific.

Company Est. Revenue Share Range Key Offerings for Scrubber System Market Strategic Positioning
Wärtsilä ~8–11% Open/closed/hybrid marine scrubbers; digital monitoring Integrated marine solutions leader
Alfa Laval ~7–10% PureSOx hybrid scrubbers; in-line monitoring Strong retrofit and aftermarket presence
Yara Marine Technologies ~6–9% SOx and PM scrubbers; compliance packages Former Green Tech Marine; pure-play marine EGC
Andritz AG ~5–8% Industrial FGD wet and dry systems Diversified pulp, power, metals
Babcock & Wilcox ~4–7% Wet FGD; dry sorbent injection; industrial U.S. power generation focus
CR Ocean Engineering ~3–5% Marine scrubber systems; compact design Specialist in smaller vessel retrofits
Fuji Electric ~3–5% Industrial scrubbers; electrostatic precipitators Japan-centric; power and heavy industry
Langh Tech ~2–4% Closed-loop marine scrubbers Finnish specialist; Arctic operation focus
Mitsubishi Power ~3–6% Large-scale FGD; wet limestone systems Mega-project power plant contractor
Dürr Group ~2–4% Industrial air pollution control; RTO + scrubber Automotive and process industry crossover


Recent News & Developments

  • China MEE (June 2024): Issued Phase III ultra-low emission guidelines extending scrubber requirements to steel and cement plants with capacity above specified thresholds, expanding the addressable industrial base [5].
  • Andritz AG (November 2023): Commissioned a semi-dry scrubber system at a 1,200 TPD cement kiln in Turkey, demonstrating 97% SO₂ removal at water consumption rates 60% below conventional wet systems [16].
  • DNV (September 2023): Published updated class notation rules for hybrid scrubber systems, requiring enhanced washwater treatment documentation and real-time discharge monitoring for vessels seeking DNV scrubber compliance certification [14].


Report Scope and Methodology — Scrubber System Market

Parameter Detail
Market Scope Global Scrubber System Market covering marine and industrial segments across wet, dry, and hybrid technologies
Study Period 2021–2035
CAGR 7.2% (2026–2035)
Market Size (2025) USD 4.85 Billion
Market Size (2035) USD 9.72 Billion
Fastest Growing Segment Dry scrubbers (by technology); India (by country)
Companies Profiled 10 (Wärtsilä, Alfa Laval, Yara Marine Technologies, Andritz AG, Babcock & Wilcox, CR Ocean Engineering, Fuji Electric, Langh Tech, Mitsubishi Power, Dürr Group)
Valuation Currency USD (constant 2025 dollars)


FAQs

What is the current valuation of the Scrubber System Market as of 2025?

The Scrubber System Market valuation was 1270.89 USD Million in 2024.

What is the projected market size for the Scrubber System Market in 2035?

The market is projected to reach 3175.73 USD Million by 2035.

What is the expected CAGR for the Scrubber System Market during the forecast period?

The expected CAGR for the Scrubber System Market from 2025 to 2035 is 8.68%.

Which companies are considered key players in the Scrubber System Market?
Key players include GE, Siemens, Alstom, Mitsubishi Heavy Industries, and Babcock & Wilcox.
What are the main applications of scrubber systems in the market?

Main applications include Marine, Industrial, Power Generation, Oil and Gas, and Chemical Processing.

How does the market segment by end use look in terms of valuation?

The end use segment includes Shipping, Manufacturing, Energy Production, Waste Management, and Mining.

What technologies are utilized in scrubber systems, and what are their valuations?
Technologies include Wet Scrubber, Dry Scrubber, Electrostatic Precipitator, Venturi Scrubber, and Packed Bed Scrubber.
What types of control are addressed by scrubber systems?
Scrubber systems address Flue Gas Desulfurization, Particulate Control, Volatile Organic Compound Control, Nitrogen Oxide Control, and Carbon Dioxide Control.
What fuel types are relevant in the Scrubber System Market?
Relevant fuel types include Natural Gas, Coal, Oil, Biomass, and Renewable Energy.
What is the market outlook for scrubber systems in the coming years?
The market outlook appears positive, with substantial growth anticipated through 2035.
Author
Author
Author Profile
Chitranshi Jaiswal LinkedIn
Team Lead - Research
Chitranshi is a Team Leader in the Chemicals & Materials (CnM) and Energy & Power (EnP) domains, with 6+ years of experience in market research. She leads and mentors teams to deliver cross-domain projects that equip clients with actionable insights and growth strategies. She is skilled in market estimation, forecasting, competitive benchmarking, and both primary & secondary research, enabling her to turn complex data into decision-ready insights. An engineer and MBA professional, she combines technical expertise with strategic acumen to solve dynamic market challenges. Chitranshi has successfully managed projects that support market entry, investment planning, and competitive positioning, while building strong client relationships. Certified in Advanced Excel & Power BI she leverages data-driven approaches to ensure accuracy, clarity, and impactful outcomes.

Research Approach


Secondary Research

The secondary research process involved comprehensive analysis of regulatory databases, maritime authority publications, environmental compliance records, and authoritative engineering sources. Key sources included the International Maritime Organization (IMO) MARPOL Annex VI regulations and IMO 2020 sulfur cap compliance databases, United States Environmental Protection Agency (EPA) Clean Air Act standards and AP-42 emission factors, European Environment Agency (EEA) Industrial Emissions Directive (IED) compliance data, European Maritime Safety Agency (EMSA) alternative fuel and scrubber adoption reports, International Energy Agency (IEA) World Energy Investment Outlook, UNCTAD Review of Maritime Transport, International Chamber of Shipping (ICS) technical papers, BIMCO shipping industry analysis, Intertanko scrubber installation statistics, American Society of Mechanical Engineers (ASME) environmental engineering publications, Institute of Electrical and Electronics Engineers (IEEE) industrial application studies, World Bank energy and infrastructure development indicators, Organization for Economic Co-operation and Development (OECD) environmental statistics, China Maritime Safety Administration emission control area data, Lloyd's Register marine technology reports, DNV GL maritime forecast publications, Clarksons Research global shipyard orderbook databases, International Association of Ports and Harbors (IAPH) environmental compliance surveys, and national maritime authority reports from key shipping registries (Panama Maritime Authority, Marshall Islands Registry, Liberian Registry). These sources were used to collect installation statistics, regulatory compliance data, fleet retrofitment trends, emission reduction validation studies, and market landscape analysis for wet scrubber systems, dry scrubber systems, hybrid loop technologies, and open/closed loop configurations.


Primary Research

To gather both qualitative and quantitative information, the primary research process involved interviewing players from both the supply and demand sides. From the supply side, we heard from shipyard engineering divisions, industrial air pollution control original equipment manufacturers (OEMs), CEOs, VPs of engineering, directors of maritime technology, heads of regulatory compliance, and commercial directors from companies that make exhaust gas cleaning systems (EGCS). Sources from the demand side included chief engineers from offshore vessels, plant managers from oil refineries and petrochemical facilities, procurement heads from power utilities, environmental compliance officers from heavy manufacturing, and fleet technical managers from container shipping lines and tanker operators. Market segmentation, installation schedules for retrofitting vs. newbuilding, patterns of technology adoption, considerations for capital expenditure vs. operating expenditure, and dynamics of port state control compliance were all confirmed through primary research.

Primary Respondent Breakdown:

By Designation: C-level Primaries (28%), Director Level (32%), Others (40%)

By Region: North America (28%), Europe (32%), Asia-Pacific (25%), Rest of World (15%)

By Stakeholder Type: Equipment Manufacturers (45%), End-Users/Ship Operators (30%), Engineering/Procurement Firms (15%), Regulatory/Consulting (10%)


Market Size Estimation

Global market valuation was derived through revenue mapping and installation volume analysis. The methodology included:

Identification of 35+ key manufacturers across North America, Europe, Asia-Pacific, and the Middle East

Product mapping across wet scrubber systems (open loop, closed loop, hybrid), dry scrubber systems, and emerging membrane technologies

Analysis of reported and modeled annual revenues specific to marine exhaust gas cleaning and industrial air pollution control portfolios

Coverage of manufacturers representing 72-76% of global market share in 2024

Vessel-specific tracking of retrofit installations versus newbuild integrations across container ships, tankers, bulk carriers, and cruise vessels

Extrapolation using bottom-up (installation volume × ASP by country/segment) and top-down (manufacturer revenue validation) approaches to derive segment-specific valuations for marine, oil & gas, power generation, and chemical processing applications

Triangulation with fleet modernization data from leading shipping registries and industrial capacity expansion statistics from energy sector databases

Methodology Validation: Data triangulation was performed by cross-referencing manufacturer shipment data with port authority installation records and regulatory compliance filings to ensure statistical accuracy within ±3.5% margin of error.

Download Free Sample

Kindly complete the form below to receive a free sample of this Report

Download PDF ×

We do not share your information with anyone. However, we may send you emails based on your report interest from time to time. You may contact us at any time to opt-out.

















