×
  • Cat-intel
  • MedIntelliX
  • Resources
  • About Us
  • Hero Background
    English
    Chinese
    French
    Japanese
    Korean
    German
    Spanish

    Silicon Photonics Market Size

    ID: MRFR/SEM/2092-CR
    204 Pages
    Aarti Dhapte
    November 2019

    Silicon Photonics Market Research Report Information By Product (Optical Engines, Variable Optical Attenuators, Optical Multiplexers, Active Optical Cable, Transceivers, Others), By Component (Micro-Optical Filters, Mux/Demux Modules, Optical Isolators, AWG Terminals), By End User (Military&Defense Industry, Commercial Industry, IT&Telecommunications Industry), And By Region (North Amer...

    Share:
    Download PDF ×

    We do not share your information with anyone. However, we may send you emails based on your report interest from time to time. You may contact us at any time to opt-out.

    Silicon Photonics Market Infographic
    Purchase Options

    Silicon Photonics Size

    Market Size Snapshot
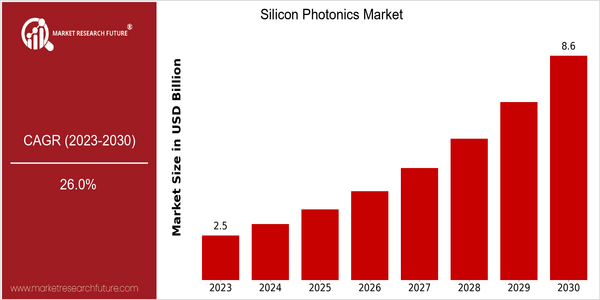
    Year Value
    2023 USD 2.5 Billion
    2030 USD 8.6 Billion
    CAGR (2023-2030) 26.0 %

    Note – Market size depicts the revenue generated over the financial year

    The silicon photonics market is expected to grow rapidly in the future. The current market size is estimated to be $2.5 billion in 2023, and is projected to reach $86 billion by the year 2030. This significant growth shows a CAGR of 26%. The main driving force is the increasing demand for high-speed data transmission and the need for more energy-efficient data centers. The development of digital industries and the demand for high-speed data transmission are also becoming more and more important, and the industry is in urgent need of a new generation of silicon photonics. The advantages of silicon photonics, such as the integration of photonics and electronics, have become more and more obvious, and silicon photonics has become the first choice for the industry in telecommunications, data centers, and consumer electronics. , etc. The big companies in this field, such as Intel, Cisco, and IBM, are also investing in R & D, establishing strategic alliances, and launching new products to seize the market. These activities not only show the potential of silicon photonics, but also highlight the fierce competition in the industry.

    home-ubuntu-www-mrf_ne_design-batch-5-cp-silicon-photonics-market size

    Regional Market Size

    Regional Deep Dive

    The silicon photonics market is experiencing significant growth across the globe, driven by advancements in data communication, high-performance computing and the increasing demand for energy-efficient solutions. North America is currently the world’s leading innovation and investment hub, with strong representation from leading companies and research institutions. Europe is focusing on regulatory issues and on issues of sustainability, while Asia-Pacific is deploying silicon photonics technology in telecommunications and in the consumer electronics sector. The Middle East and Africa are gradually developing as potential markets with growing interest in adopting the technology. Latin America is still in its infancy, but its tech hubs are developing.

    Europe

    • The European Union has launched initiatives like the Horizon Europe program, which funds research in silicon photonics, emphasizing sustainability and energy efficiency in technology.
    • Companies like STMicroelectronics are advancing silicon photonics integration in consumer electronics, which is expected to enhance product performance and reduce costs.

    Asia Pacific

    • China is rapidly expanding its silicon photonics capabilities, with government support for research and development, particularly in telecommunications and data centers.
    • Japanese firms, such as Fujitsu, are innovating in silicon photonics for high-speed optical communication, which is crucial for the country's advanced telecommunications infrastructure.

    Latin America

    • Brazil is beginning to see investments in silicon photonics research, particularly in academic institutions, which could lead to future commercialization of technologies.
    • Emerging tech hubs in countries like Chile and Argentina are starting to explore silicon photonics applications, driven by a growing interest in telecommunications and data processing.

    North America

    • The United States is home to major companies like Intel and Cisco, which are heavily investing in silicon photonics research and development, leading to breakthroughs in data center technologies.
    • Recent collaborations between universities and tech firms, such as the partnership between MIT and various startups, are fostering innovation in silicon photonics applications, particularly in AI and machine learning.

    Middle East And Africa

    • The UAE is investing in smart city initiatives that incorporate silicon photonics technologies, aiming to enhance communication infrastructure and data management.
    • Israel's tech ecosystem is fostering startups focused on silicon photonics, with government support for innovation and technology transfer, which is expected to boost local market growth.

    Did You Know?

    “Silicon photonics can potentially reduce the energy consumption of data centers by up to 90% compared to traditional electronic interconnects.” — International Energy Agency (IEA)

    Segmental Market Size

    The silicon photonics market is experiencing rapid growth, driven by the need for fast data transmission and energy-efficient solutions in data centers and telecommunications. The growth in data traffic, the rise of the cloud, the development of the Internet of Things and the improvement in silicon photonics technology are the main driving forces for the growth of this market. Intel and Cisco are at the forefront in implementing silicon photonics in their products to meet these demands. The current deployment of silicon photonics is in the process of taking off, with the main projects in North America and Europe where the technology giants are implementing these solutions. In addition to data center interconnection, the main applications are optical communications and sensors. The main products are 100G optical transceivers from Intel. The momentum of this market is further enhanced by macro trends such as the drive for sustainable development and government initiatives to promote green technology. The further development of manufacturing processes and integration technology will also shape the future development of this market.

    Future Outlook

    The silicon photonics market will experience a substantial growth from 2023 to 2030. The market value is expected to increase from $2.5 billion to $8.5 billion, resulting in a CAGR of 26%. The market is driven by the growing demand for high-speed data transmission and the need for energy-efficient solutions in data centers and telecommunications. The digitalization of industry will continue to accelerate, and the penetration of silicon photonics in various sectors such as telecommunications, data centers, and consumer electronics will increase to more than 30% in these areas by 2030. Several technological advances, such as the integration of silicon photonics with existing semiconductor technology, are expected to increase the performance and reduce the cost of the product, thus accelerating the market penetration. Also, government support for innovation in photonics and increased R&D spending will play a significant role in the market. The growth of artificial intelligence and machine learning, which requires high speed and low latency, will also boost the market.

    Silicon Photonics Market Size Graph
    Author
    Aarti Dhapte
    Team Lead - Research

    She holds an experience of about 6+ years in Market Research and Business Consulting, working under the spectrum of Information Communication Technology, Telecommunications and Semiconductor domains. Aarti conceptualizes and implements a scalable business strategy and provides strategic leadership to the clients. Her expertise lies in market estimation, competitive intelligence, pipeline analysis, customer assessment, etc.

    Leave a Comment

    FAQs

    How much is the Silicon Photonics market?

    The Silicon Photonics Market size was valued at USD 1.9 Billion in 2022.

    What is the growth rate of the Silicon Photonics market?

    The global market is projected to grow at a CAGR of 26.00% during the forecast period, 2023-2030.

    Which region held the largest market share in the Silicon Photonics market?

    North America had the largest share in the Silicon Photonics Market.

    Who are the key players in the Silicon Photonics market?

    The key players in the market are Infinera Corporation, Cisco Systems Inc., Intel Corporation, IBM Corporation, Mellanox Technologies Ltd, Hamamatsu Photonics K.K, STMicroelectronics NV, Finisar Corporation, FLIR Systems, IPG Photonics Corporation, NKT Photonics, SICOYA, AIO Core Co. Ltd, and DAS Photonics.

    Which Product led the Silicon Photonics market?

    The transceivers category dominated the market in 2022.

    Which end-user had the largest market share in the market?

    IT & Telecommunication had the largest share in the global market for Silicon Photonics.

    Market Summary

    As per MRFR analysis, the Silicon Photonics Market Size was estimated at 3.15 USD Billion in 2024. The Silicon Photonics industry is projected to grow from 3.969 USD Billion in 2025 to 40.03 USD Billion by 2035, exhibiting a compound annual growth rate (CAGR) of 26.0 during the forecast period 2025 - 2035.

    Key Market Trends & Highlights

    The Silicon Photonics Market is poised for substantial growth driven by technological advancements and increasing demand across various sectors.

    • The market experiences increased adoption in data centers, particularly in North America, which remains the largest market. Emerging integrated photonic circuits are gaining traction, especially in the Asia-Pacific region, recognized as the fastest-growing market. Growing interest in quantum computing is influencing market dynamics, with transceivers being the largest segment. Rising demand for high-speed communication and advancements in integrated photonic devices are key drivers propelling market expansion.

    Market Size & Forecast

    2024 Market Size 3.15 (USD Billion)
    2035 Market Size 40.03 (USD Billion)
    CAGR (2025 - 2035) 26.0%
    Largest Regional Market Share in 2024 North America

    Major Players

    <p>Intel Corporation (US), Cisco Systems Inc (US), IBM Corporation (US), Luxtera Inc (US), STMicroelectronics (FR), Infinera Corporation (US), Ayar Labs (US), Nokia Corporation (FI), Broadcom Inc (US)</p>

    Market Trends

    The Silicon Photonics Market is currently experiencing a transformative phase, driven by advancements in technology and increasing demand for high-speed data transmission. This market encompasses the integration of silicon-based photonic devices, which are pivotal in enhancing communication systems, data centers, and various electronic applications. The convergence of optical and electronic components is fostering innovative solutions that promise to revolutionize how data is processed and transmitted. As industries seek to improve efficiency and reduce energy consumption, the adoption of silicon photonics is likely to gain momentum, suggesting a robust growth trajectory in the coming years. Moreover, the Silicon Photonics Market appears to be influenced by the rising need for faster and more efficient communication networks. The proliferation of cloud computing, artificial intelligence, and the Internet of Things is propelling the demand for advanced photonic solutions. Companies are increasingly investing in research and development to harness the potential of silicon photonics, which may lead to breakthroughs in performance and cost-effectiveness. This evolving landscape indicates that the market is poised for significant expansion, with various sectors recognizing the advantages of integrating photonic technologies into their operations.

    Increased Adoption in Data Centers

    The Silicon Photonics Market is witnessing a surge in the adoption of photonic technologies within data centers. This trend is largely attributed to the need for enhanced bandwidth and reduced latency in data transmission. As organizations strive to manage vast amounts of data efficiently, silicon photonics offers a compelling solution that combines speed with energy efficiency.

    Emergence of Integrated Photonic Circuits

    Another notable trend in the Silicon Photonics Market is the emergence of integrated photonic circuits. These circuits enable the integration of multiple photonic functions on a single chip, which can lead to reduced size and cost. This innovation is likely to facilitate the development of compact and efficient devices, appealing to various applications across telecommunications and consumer electronics.

    Growing Interest in Quantum Computing

    The Silicon Photonics Market is also experiencing growing interest in its applications within quantum computing. As researchers explore the potential of silicon-based photonic systems for quantum information processing, this trend may open new avenues for innovation. The intersection of silicon photonics and quantum technologies suggests a promising future, with potential implications for computing power and security.

    Silicon Photonics Market Market Drivers

    Emergence of New Market Players

    The Silicon Photonics Market is experiencing the emergence of new market players, which is fostering increased competition and innovation. Startups and established companies alike are entering the silicon photonics space, driven by the technology's potential to revolutionize various industries. This influx of new entrants is likely to lead to diverse product offerings and enhanced technological advancements. Recent analyses suggest that the number of companies involved in silicon photonics could double by 2030, reflecting the growing interest in this field. As these new players introduce innovative solutions, the Silicon Photonics Market is expected to benefit from a broader range of applications and improved performance metrics, ultimately driving market growth.

    Rising Demand for High-Speed Communication

    The Silicon Photonics Market is experiencing a notable surge in demand for high-speed communication technologies. As data consumption continues to escalate, driven by the proliferation of cloud computing and streaming services, the need for faster data transfer rates becomes paramount. Silicon photonics, with its ability to transmit data at unprecedented speeds, is well-positioned to meet this demand. Recent estimates suggest that the market for silicon photonics in communication applications could reach USD 1.5 billion by 2026. This growth is largely attributed to the increasing deployment of 5G networks and the expansion of data centers, which require efficient and high-capacity communication solutions. Consequently, the Silicon Photonics Market is likely to witness significant investments aimed at enhancing optical interconnects and improving overall network performance.

    Advancements in Integrated Photonic Devices

    The Silicon Photonics Market is benefiting from rapid advancements in integrated photonic devices. These devices, which combine multiple photonic functions on a single chip, are becoming increasingly essential for various applications, including telecommunications and data processing. The integration of silicon photonics with existing semiconductor technologies allows for miniaturization and cost reduction, making it an attractive option for manufacturers. Reports indicate that the market for integrated photonic circuits is projected to grow at a compound annual growth rate of over 20% through the next five years. This growth is driven by the need for compact and efficient solutions in optical communication systems. As a result, the Silicon Photonics Market is likely to see a proliferation of innovative products that enhance performance while reducing energy consumption.

    Growing Applications in Artificial Intelligence

    The Silicon Photonics Market is increasingly finding applications in artificial intelligence (AI) and machine learning. The demand for high-performance computing capabilities in AI systems necessitates efficient data processing and transmission solutions. Silicon photonics offers a promising approach to address these requirements, enabling faster data transfer and lower latency. As organizations continue to adopt AI technologies across various sectors, the need for robust silicon photonic solutions is expected to rise. Market analysts project that the integration of silicon photonics in AI applications could contribute to a market growth rate of approximately 15% over the next few years. This trend indicates that the Silicon Photonics Market is likely to play a crucial role in supporting the computational demands of AI-driven applications.

    Increased Investment in Research and Development

    The Silicon Photonics Market is witnessing a significant increase in investment directed towards research and development. This trend is primarily fueled by the growing recognition of silicon photonics as a transformative technology in various sectors, including telecommunications, healthcare, and consumer electronics. Companies and research institutions are allocating substantial resources to explore new applications and improve existing technologies. It is estimated that R&D spending in the silicon photonics sector could exceed USD 500 million annually by 2027. This influx of funding is expected to accelerate innovation, leading to the development of advanced photonic devices and systems. Consequently, the Silicon Photonics Market is poised for substantial growth as new breakthroughs emerge from ongoing research efforts.

    Market Segment Insights

    By Product: Transceivers (Largest) vs. Active Optical Cables (Fastest-Growing)

    <p>In the Silicon Photonics Market, the product segment is majorly led by transceivers, capturing a significant portion of the market share due to their critical role in data communication and networking. Following transceivers, optical engines and optical multiplexers also hold substantial market shares, driven by increasing demands for data bandwidth and high-performance computing. Variable optical attenuators and active <a href="https://www.marketresearchfuture.com/reports/active-optical-cable-market-10954">optical cables</a> contribute to the segment, catering to specific applications that require precise control and faster connections. The market is expected to witness key growth trends with active optical cables emerging rapidly due to the surge in data center traffic and demand for efficient, lightweight solutions. Furthermore, advancements in silicon photonics technology are driving innovations in optical engines and transceivers, enhancing their efficiency and performance. As enterprises and service providers focus on upgrading their infrastructure, the product segment is anticipated to experience robust growth in the coming years.</p>

    <p>Transceivers (Dominant) vs. Active Optical Cables (Emerging)</p>

    <p>Transceivers serve as a cornerstone of the Silicon Photonics Market, designed for high-speed data transmission, and are extensively utilized in data centers and telecommunications. Their dominance is attributed to their ability to integrate seamlessly with various networking standards, thereby supporting large volumes of data traffic. In contrast, active optical cables represent an emerging segment characterized by their lightweight design and high adaptability for short-distance data communications, particularly in high-performance computing environments. They provide significant advantages over traditional copper cables, including increased bandwidth and reduced energy consumption. As the need for efficient data transfer solutions grows, both transceivers and active optical cables are poised to play pivotal roles in shaping the future of the silicon photonics industry.</p>

    By Component: Mux/Demux Modules (Largest) vs. Optical Isolators (Fastest-Growing)

    <p>In the Silicon Photonics Market, the component segment showcases a diverse range of critical technologies, with Mux/Demux Modules leading in market share. These modules facilitate the multiplexing and demultiplexing of optical signals, playing a crucial role in high-speed data transmission. Optical Isolators, on the other hand, are emerging rapidly, becoming increasingly essential in preventing back reflections in optical systems, which is vital for ensuring signal integrity. The market dynamics for components in this sector are influenced by the growing demand for bandwidth and data transmission capabilities in telecommunications and data centers. Innovations in Mux/Demux technology and the heightened need for dependable optical isolators are driving considerable investments and research in this segment. Additionally, advancements in manufacturing processes and materials are enabling more efficient and compact designs, boosting overall growth in the Silicon Photonics Market.</p>

    <p>Mux/Demux Modules (Dominant) vs. AWG Terminals (Emerging)</p>

    <p>Mux/Demux Modules hold a dominant position in the Silicon Photonics Market due to their vital role in facilitating efficient optical communication. These modules allow multiple signals to travel simultaneously over a single optical fiber, enhancing capacity without additional infrastructure. The technological maturity and established market presence contribute to their strong market share. In contrast, AWG Terminals are considered an emerging technology within this domain. Though they currently represent a smaller fraction of the market, they offer unique advantages in waveguide multiplexing, efficiently managing wavelength division multiplexing schemes. As networks evolve, AWG Terminals are increasingly recognized for their potential to improve spectral efficiency and support broader bandwidth applications, which may lead to more significant market traction.</p>

    By End User: Military & Defense Industry (Largest) vs. IT & Telecommunications Industry (Fastest-Growing)

    <p>In the Silicon Photonics Market, the Military &amp; Defense industry holds the largest share due to its critical demand for high-speed, secure communications. This segment benefits from the necessity to maintain robust defense systems and the growing adoption of advanced technologies for tactical communications. Conversely, the IT &amp; Telecommunications industry is rapidly expanding its scope within this market. The surge in data consumption and the increasing need for higher bandwidth in telecommunications infrastructure are driving significant growth in this segment. As the demand for faster data transmission and communication systems rises, the IT &amp; Telecommunications industry is positioned to experience the fastest growth within the Silicon Photonics Market. Factors such as the advent of 5G technology, increasing cloud computing, and the urgent need for data center efficiencies are boosting investments in silicon photonics applications. This trend indicates a shift towards more integrated and efficient optical communication solutions, propelling the industry forward at an unprecedented pace.</p>

    <p>Military &amp; Defense Industry (Dominant) vs. IT &amp; Telecommunications Industry (Emerging)</p>

    <p>The Military &amp; Defense industry remains a dominant force in the Silicon Photonics Market, characterized by its rigorous standards and the necessity for reliable, high-performance communication systems. This segment emphasizes secure data transmission and advanced technologies such as phased array radars and Lidar, critical for modern warfare and surveillance. In contrast, the IT &amp; Telecommunications industry is emerging with a focus on rapid advancements driven by the explosive growth of data. As organizations increasingly rely on enhanced connectivity solutions, silicon photonics plays a crucial role in delivering the required bandwidth and speed. The investment in silicon-based optical components for data centers and fiber-optic networks highlights the industry's shift towards high-performance communication, setting the stage for a more interconnected future.</p>

    Get more detailed insights about Silicon Photonics Market Research Report - Forecast till 2035

    Regional Insights

    By region, the study provides market insights into North America, Europe, Asia-Pacific, and the Rest of the World. Asia-Pacific is the second-largest market for silicon photonics, and it is expected to continue to grow at a significant pace in the coming years. This is due to the presence of emerging economies, such as China and India, and the increasing demand for high-speed data transfer and efficient data communication in the region. Additionally, the region has rapidly growing telecommunications and IT industry, which supports the growth of the silicon photonics market.

    Furthermore, the region has a large number of research and development facilities, which supports the growth of the market. As a result, Asia-Pacific is expected to continue to be the second-largest market for silicon photonics in the coming years, and it may eventually overtake.

    Further, the major countries studied in the market report are The U.S., Canada, Germany, France, the UK, Italy, Spain, China, Japan, India, Australia, South Korea, and Brazil

    Figure 3:  SILICON PHOTONICS MARKET SHARE BY REGION 2022 (%)SILICON PHOTONICS MARKET SHARE BY REGION 2022

    Source: Secondary Research, Primary Research, MRFR Database and Analyst Review

    Europe is the third-largest market for silicon photonics, and it is expected to grow at a steady pace in the coming years. This is due to the presence of well-established telecommunications and IT industries, as well as a large number of research and development facilities in the region. Additionally, the region has a strong technology infrastructure and a large number of players in the market. Furthermore, the increasing demand for high-speed data transfer and efficient data communication in the region is also driving the growth of the market.

    As a result, Europe is expected to continue to be the third-largest market for silicon photonics in the coming years. However, the growth of the market can be affected by various factors, such as competition from other regions, technological advancements, and changes in consumer preferences. Further, the Germany Silicon Photonics market held the largest market share, and the UK Silicon Photonics market was the fastest-growing market in the European region.

    North America is the largest market for silicon photonics, and it is expected to continue to dominate the market in the coming years. The region has a strong technology infrastructure and a large number of research and development facilities, which supports the growth of the silicon photonics market. Furthermore, the increasing demand for high-speed data transfer and efficient data communication in the region is also driving the growth of the market. Moreover, the U.S. Silicon Photonics market held the largest market share, and the Canada Silicon Photonics market was the fastest-growing market in the North American region.

    Key Players and Competitive Insights

    Major market players are spending a lot of money on R&D to increase their product lines, which will help the Silicon Photonics market grow even more. Market participants are also taking a range of strategic initiatives to grow their worldwide footprint, with key market developments such as new product launches, contractual agreements, mergers and acquisitions, increased investments, and collaboration with other organizations. Competitors in the Silicon Photonics industry must offer cost-effective items to expand and survive in an increasingly competitive and rising market environment.

    Manufacturing locally to cut operating costs is one of the main business tactics manufacturers use in the global Silicon Photonics industry to benefit customers and expand the market sector. Major Silicon Photonics market players, including Infinera Corporation, Cisco Systems Inc., Intel Corporation, IBM Corporation, Mellanox Technologies Ltd, Hamamatsu Photonics K.K, STMicroelectronics NV, Finisar Corporation, FLIR Systems, IPG Photonics Corporation, NKT Photonics, SICOYA, AIO Core Co. Ltd, and DAS Photonics, and others, are attempting to increase market demand by funding R&D initiatives.

    Infinera Corporation is a provider of intelligent transport networks, enabling carriers, service providers, and data center operators to scale bandwidth while reducing network complexity and energy usage. Infinera offers a range of products, including photonic integrated circuits, optical networking systems, and optical transport networking services. The company's technology allows customers to scale their networks to meet the growing demand for bandwidth, reduce network complexity, and lower energy usage.

    Cisco Systems, Inc. is a multinational technology company that designs, manufactures, and sells networking equipment. Cisco is a leading provider of networking and communication technology, offering a range of products and services, including routers, switches, security systems, data center products, wireless products, and collaboration tools. The company's technology is used by customers in various industries, including telecommunications, education, healthcare, and government. In addition to its product offerings, Cisco also provides a range of services, such as consulting, technical support, and training.

    Key Companies in the Silicon Photonics Market market include

    Industry Developments

    • Q2 2024: Ayar Labs Raises $130 Million in Series C Funding to Accelerate Optical I/O Solutions Ayar Labs, a leader in silicon photonics for optical I/O, announced the close of a $130 million Series C funding round to scale its manufacturing and commercialization efforts for next-generation optical interconnects.
    • Q2 2024: Intel and Broadcom Demonstrate Industry’s First End-to-End 800G Silicon Photonics Link Intel and Broadcom jointly announced the successful demonstration of an 800G silicon photonics optical link, marking a significant milestone in high-speed data center connectivity.
    • Q2 2024: Cisco to Acquire Luxtera for $660 Million, Expanding Silicon Photonics Portfolio Cisco announced the acquisition of Luxtera, a silicon photonics company, for $660 million to strengthen its data center and networking solutions with advanced optical technologies.
    • Q3 2024: Ayar Labs and GlobalFoundries Announce Strategic Manufacturing Partnership for Silicon Photonics Ayar Labs and GlobalFoundries entered a strategic partnership to scale the manufacturing of Ayar Labs’ silicon photonics-based optical I/O solutions, aiming to meet growing demand in AI and data center markets.
    • Q3 2024: Rockley Photonics Appoints Dr. Andrew Rickman as CEO Rockley Photonics, a developer of integrated silicon photonics solutions, announced the appointment of Dr. Andrew Rickman as Chief Executive Officer to lead the company’s next phase of growth.
    • Q3 2024: SiLC Technologies Raises $25 Million in Series B Funding to Advance 4D+ Vision Silicon Photonics SiLC Technologies, specializing in silicon photonics for machine vision, secured $25 million in Series B funding to accelerate the development and commercialization of its 4D+ Vision chip for automotive and industrial applications.
    • Q4 2024: Intel Launches New 400G Silicon Photonics Transceiver for Data Centers Intel announced the commercial launch of its new 400G silicon photonics transceiver, designed to enable faster and more efficient data transmission in hyperscale data centers.
    • Q4 2024: Cisco Unveils Next-Generation Silicon Photonics Platform for AI Workloads Cisco introduced a new silicon photonics platform aimed at supporting the high bandwidth and low latency requirements of AI and machine learning workloads in large-scale data centers.
    • Q1 2025: Ayar Labs and NVIDIA Collaborate to Integrate Optical I/O in Next-Gen AI Systems Ayar Labs announced a collaboration with NVIDIA to integrate its silicon photonics-based optical I/O technology into NVIDIA’s next-generation AI computing platforms.
    • Q1 2025: Rockley Photonics Opens New Silicon Photonics Manufacturing Facility in the UK Rockley Photonics inaugurated a new manufacturing facility in the United Kingdom dedicated to the production of advanced silicon photonics components for healthcare and data communications.
    • Q2 2025: SiLC Technologies Partners with Continental to Bring Silicon Photonics to Automotive LiDAR SiLC Technologies announced a partnership with automotive supplier Continental to integrate its silicon photonics-based LiDAR technology into next-generation vehicle platforms.
    • Q2 2025: Intel Announces $1 Billion Investment in Silicon Photonics R&D and Manufacturing Expansion Intel revealed a $1 billion investment plan to expand its research, development, and manufacturing capabilities in silicon photonics, aiming to meet surging demand from cloud and AI sectors.

    Future Outlook

    Silicon Photonics Market Future Outlook

    <p>The Silicon Photonics Market is projected to grow at a 26.0% CAGR from 2024 to 2035, driven by advancements in data communication, high-performance computing, and energy efficiency.</p>

    New opportunities lie in:

    • <p>Development of integrated photonic circuits for AI applications.</p><p>Expansion into healthcare diagnostics using silicon photonics.</p><p>Creation of cost-effective manufacturing processes for mass production.</p>

    <p>By 2035, the Silicon Photonics Market is expected to achieve substantial growth, solidifying its role in advanced technology sectors.</p>

    Market Segmentation

    Silicon Photonics Market Product Outlook

    • Optical Engines
    • Variable Optical Attenuators
    • Optical Multiplexers
    • Active Optical Cables
    • Transceivers
    • Others

    Silicon Photonics Market End User Outlook

    • Military & Defense Industry
    • Commercial Industry
    • IT & Telecommunications Industry

    Silicon Photonics Market Component Outlook

    • Micro-Optical Filters
    • Mux/Demux Modules
    • Optical Isolators
    • AWG Terminals

    Report Scope

    MARKET SIZE 20243.15(USD Billion)
    MARKET SIZE 20253.969(USD Billion)
    MARKET SIZE 203540.03(USD Billion)
    COMPOUND ANNUAL GROWTH RATE (CAGR)26.0% (2024 - 2035)
    REPORT COVERAGERevenue Forecast, Competitive Landscape, Growth Factors, and Trends
    BASE YEAR2024
    Market Forecast Period2025 - 2035
    Historical Data2019 - 2024
    Market Forecast UnitsUSD Billion
    Key Companies ProfiledMarket analysis in progress
    Segments CoveredMarket segmentation analysis in progress
    Key Market OpportunitiesAdvancements in data center efficiency drive demand for Silicon Photonics Market solutions.
    Key Market DynamicsRising demand for high-speed data transmission drives innovation and competition in the Silicon Photonics Market.
    Countries CoveredNorth America, Europe, APAC, South America, MEA

    FAQs

    How much is the Silicon Photonics market?

    The Silicon Photonics Market size was valued at USD 1.9 Billion in 2022.

    What is the growth rate of the Silicon Photonics market?

    The global market is projected to grow at a CAGR of 26.00% during the forecast period, 2023-2030.

    Which region held the largest market share in the Silicon Photonics market?

    North America had the largest share in the Silicon Photonics Market.

    Who are the key players in the Silicon Photonics market?

    The key players in the market are Infinera Corporation, Cisco Systems Inc., Intel Corporation, IBM Corporation, Mellanox Technologies Ltd, Hamamatsu Photonics K.K, STMicroelectronics NV, Finisar Corporation, FLIR Systems, IPG Photonics Corporation, NKT Photonics, SICOYA, AIO Core Co. Ltd, and DAS Photonics.

    Which Product led the Silicon Photonics market?

    The transceivers category dominated the market in 2022.

    Which end-user had the largest market share in the market?

    IT &amp; Telecommunication had the largest share in the global market for Silicon Photonics.

    1. SECTION I: EXECUTIVE SUMMARY AND KEY HIGHLIGHTS
      1. | 1.1 EXECUTIVE SUMMARY
      2. | | 1.1.1 Market Overview
      3. | | 1.1.2 Key Findings
      4. | | 1.1.3 Market Segmentation
      5. | | 1.1.4 Competitive Landscape
      6. | | 1.1.5 Challenges and Opportunities
      7. | | 1.1.6 Future Outlook
    2. SECTION II: SCOPING, METHODOLOGY AND MARKET STRUCTURE
      1. | 2.1 MARKET INTRODUCTION
      2. | | 2.1.1 Definition
      3. | | 2.1.2 Scope of the study
      4. | | | 2.1.2.1 Research Objective
      5. | | | 2.1.2.2 Assumption
      6. | | | 2.1.2.3 Limitations
      7. | 2.2 RESEARCH METHODOLOGY
      8. | | 2.2.1 Overview
      9. | | 2.2.2 Data Mining
      10. | | 2.2.3 Secondary Research
      11. | | 2.2.4 Primary Research
      12. | | | 2.2.4.1 Primary Interviews and Information Gathering Process
      13. | | | 2.2.4.2 Breakdown of Primary Respondents
      14. | | 2.2.5 Forecasting Model
      15. | | 2.2.6 Market Size Estimation
      16. | | | 2.2.6.1 Bottom-Up Approach
      17. | | | 2.2.6.2 Top-Down Approach
      18. | | 2.2.7 Data Triangulation
      19. | | 2.2.8 Validation
    3. SECTION III: QUALITATIVE ANALYSIS
      1. | 3.1 MARKET DYNAMICS
      2. | | 3.1.1 Overview
      3. | | 3.1.2 Drivers
      4. | | 3.1.3 Restraints
      5. | | 3.1.4 Opportunities
      6. | 3.2 MARKET FACTOR ANALYSIS
      7. | | 3.2.1 Value chain Analysis
      8. | | 3.2.2 Porter's Five Forces Analysis
      9. | | | 3.2.2.1 Bargaining Power of Suppliers
      10. | | | 3.2.2.2 Bargaining Power of Buyers
      11. | | | 3.2.2.3 Threat of New Entrants
      12. | | | 3.2.2.4 Threat of Substitutes
      13. | | | 3.2.2.5 Intensity of Rivalry
      14. | | 3.2.3 COVID-19 Impact Analysis
      15. | | | 3.2.3.1 Market Impact Analysis
      16. | | | 3.2.3.2 Regional Impact
      17. | | | 3.2.3.3 Opportunity and Threat Analysis
    4. SECTION IV: QUANTITATIVE ANALYSIS
      1. | 4.1 Semiconductor & Electronics, BY Product (USD Billion)
      2. | | 4.1.1 Optical Engines
      3. | | 4.1.2 Variable Optical Attenuators
      4. | | 4.1.3 Optical Multiplexers
      5. | | 4.1.4 Active Optical Cables
      6. | | 4.1.5 Transceivers
      7. | | 4.1.6 Others
      8. | 4.2 Semiconductor & Electronics, BY Component (USD Billion)
      9. | | 4.2.1 Micro-Optical Filters
      10. | | 4.2.2 Mux/Demux Modules
      11. | | 4.2.3 Optical Isolators
      12. | | 4.2.4 AWG Terminals
      13. | 4.3 Semiconductor & Electronics, BY End User (USD Billion)
      14. | | 4.3.1 Military & Defense Industry
      15. | | 4.3.2 Commercial Industry
      16. | | 4.3.3 IT & Telecommunications Industry
      17. | 4.4 Semiconductor & Electronics, BY Region (USD Billion)
      18. | | 4.4.1 North America
      19. | | | 4.4.1.1 US
      20. | | | 4.4.1.2 Canada
      21. | | 4.4.2 Europe
      22. | | | 4.4.2.1 Germany
      23. | | | 4.4.2.2 UK
      24. | | | 4.4.2.3 France
      25. | | | 4.4.2.4 Russia
      26. | | | 4.4.2.5 Italy
      27. | | | 4.4.2.6 Spain
      28. | | | 4.4.2.7 Rest of Europe
      29. | | 4.4.3 APAC
      30. | | | 4.4.3.1 China
      31. | | | 4.4.3.2 India
      32. | | | 4.4.3.3 Japan
      33. | | | 4.4.3.4 South Korea
      34. | | | 4.4.3.5 Malaysia
      35. | | | 4.4.3.6 Thailand
      36. | | | 4.4.3.7 Indonesia
      37. | | | 4.4.3.8 Rest of APAC
      38. | | 4.4.4 South America
      39. | | | 4.4.4.1 Brazil
      40. | | | 4.4.4.2 Mexico
      41. | | | 4.4.4.3 Argentina
      42. | | | 4.4.4.4 Rest of South America
      43. | | 4.4.5 MEA
      44. | | | 4.4.5.1 GCC Countries
      45. | | | 4.4.5.2 South Africa
      46. | | | 4.4.5.3 Rest of MEA
    5. SECTION V: COMPETITIVE ANALYSIS
      1. | 5.1 Competitive Landscape
      2. | | 5.1.1 Overview
      3. | | 5.1.2 Competitive Analysis
      4. | | 5.1.3 Market share Analysis
      5. | | 5.1.4 Major Growth Strategy in the Semiconductor & Electronics
      6. | | 5.1.5 Competitive Benchmarking
      7. | | 5.1.6 Leading Players in Terms of Number of Developments in the Semiconductor & Electronics
      8. | | 5.1.7 Key developments and growth strategies
      9. | | | 5.1.7.1 New Product Launch/Service Deployment
      10. | | | 5.1.7.2 Merger & Acquisitions
      11. | | | 5.1.7.3 Joint Ventures
      12. | | 5.1.8 Major Players Financial Matrix
      13. | | | 5.1.8.1 Sales and Operating Income
      14. | | | 5.1.8.2 Major Players R&D Expenditure. 2023
      15. | 5.2 Company Profiles
      16. | | 5.2.1 Intel Corporation (US)
      17. | | | 5.2.1.1 Financial Overview
      18. | | | 5.2.1.2 Products Offered
      19. | | | 5.2.1.3 Key Developments
      20. | | | 5.2.1.4 SWOT Analysis
      21. | | | 5.2.1.5 Key Strategies
      22. | | 5.2.2 Cisco Systems Inc (US)
      23. | | | 5.2.2.1 Financial Overview
      24. | | | 5.2.2.2 Products Offered
      25. | | | 5.2.2.3 Key Developments
      26. | | | 5.2.2.4 SWOT Analysis
      27. | | | 5.2.2.5 Key Strategies
      28. | | 5.2.3 IBM Corporation (US)
      29. | | | 5.2.3.1 Financial Overview
      30. | | | 5.2.3.2 Products Offered
      31. | | | 5.2.3.3 Key Developments
      32. | | | 5.2.3.4 SWOT Analysis
      33. | | | 5.2.3.5 Key Strategies
      34. | | 5.2.4 Luxtera Inc (US)
      35. | | | 5.2.4.1 Financial Overview
      36. | | | 5.2.4.2 Products Offered
      37. | | | 5.2.4.3 Key Developments
      38. | | | 5.2.4.4 SWOT Analysis
      39. | | | 5.2.4.5 Key Strategies
      40. | | 5.2.5 STMicroelectronics (FR)
      41. | | | 5.2.5.1 Financial Overview
      42. | | | 5.2.5.2 Products Offered
      43. | | | 5.2.5.3 Key Developments
      44. | | | 5.2.5.4 SWOT Analysis
      45. | | | 5.2.5.5 Key Strategies
      46. | | 5.2.6 Infinera Corporation (US)
      47. | | | 5.2.6.1 Financial Overview
      48. | | | 5.2.6.2 Products Offered
      49. | | | 5.2.6.3 Key Developments
      50. | | | 5.2.6.4 SWOT Analysis
      51. | | | 5.2.6.5 Key Strategies
      52. | | 5.2.7 Ayar Labs (US)
      53. | | | 5.2.7.1 Financial Overview
      54. | | | 5.2.7.2 Products Offered
      55. | | | 5.2.7.3 Key Developments
      56. | | | 5.2.7.4 SWOT Analysis
      57. | | | 5.2.7.5 Key Strategies
      58. | | 5.2.8 Nokia Corporation (FI)
      59. | | | 5.2.8.1 Financial Overview
      60. | | | 5.2.8.2 Products Offered
      61. | | | 5.2.8.3 Key Developments
      62. | | | 5.2.8.4 SWOT Analysis
      63. | | | 5.2.8.5 Key Strategies
      64. | | 5.2.9 Broadcom Inc (US)
      65. | | | 5.2.9.1 Financial Overview
      66. | | | 5.2.9.2 Products Offered
      67. | | | 5.2.9.3 Key Developments
      68. | | | 5.2.9.4 SWOT Analysis
      69. | | | 5.2.9.5 Key Strategies
      70. | 5.3 Appendix
      71. | | 5.3.1 References
      72. | | 5.3.2 Related Reports
    6. LIST OF FIGURES
      1. | 6.1 MARKET SYNOPSIS
      2. | 6.2 NORTH AMERICA MARKET ANALYSIS
      3. | 6.3 US MARKET ANALYSIS BY PRODUCT
      4. | 6.4 US MARKET ANALYSIS BY COMPONENT
      5. | 6.5 US MARKET ANALYSIS BY END USER
      6. | 6.6 CANADA MARKET ANALYSIS BY PRODUCT
      7. | 6.7 CANADA MARKET ANALYSIS BY COMPONENT
      8. | 6.8 CANADA MARKET ANALYSIS BY END USER
      9. | 6.9 EUROPE MARKET ANALYSIS
      10. | 6.10 GERMANY MARKET ANALYSIS BY PRODUCT
      11. | 6.11 GERMANY MARKET ANALYSIS BY COMPONENT
      12. | 6.12 GERMANY MARKET ANALYSIS BY END USER
      13. | 6.13 UK MARKET ANALYSIS BY PRODUCT
      14. | 6.14 UK MARKET ANALYSIS BY COMPONENT
      15. | 6.15 UK MARKET ANALYSIS BY END USER
      16. | 6.16 FRANCE MARKET ANALYSIS BY PRODUCT
      17. | 6.17 FRANCE MARKET ANALYSIS BY COMPONENT
      18. | 6.18 FRANCE MARKET ANALYSIS BY END USER
      19. | 6.19 RUSSIA MARKET ANALYSIS BY PRODUCT
      20. | 6.20 RUSSIA MARKET ANALYSIS BY COMPONENT
      21. | 6.21 RUSSIA MARKET ANALYSIS BY END USER
      22. | 6.22 ITALY MARKET ANALYSIS BY PRODUCT
      23. | 6.23 ITALY MARKET ANALYSIS BY COMPONENT
      24. | 6.24 ITALY MARKET ANALYSIS BY END USER
      25. | 6.25 SPAIN MARKET ANALYSIS BY PRODUCT
      26. | 6.26 SPAIN MARKET ANALYSIS BY COMPONENT
      27. | 6.27 SPAIN MARKET ANALYSIS BY END USER
      28. | 6.28 REST OF EUROPE MARKET ANALYSIS BY PRODUCT
      29. | 6.29 REST OF EUROPE MARKET ANALYSIS BY COMPONENT
      30. | 6.30 REST OF EUROPE MARKET ANALYSIS BY END USER
      31. | 6.31 APAC MARKET ANALYSIS
      32. | 6.32 CHINA MARKET ANALYSIS BY PRODUCT
      33. | 6.33 CHINA MARKET ANALYSIS BY COMPONENT
      34. | 6.34 CHINA MARKET ANALYSIS BY END USER
      35. | 6.35 INDIA MARKET ANALYSIS BY PRODUCT
      36. | 6.36 INDIA MARKET ANALYSIS BY COMPONENT
      37. | 6.37 INDIA MARKET ANALYSIS BY END USER
      38. | 6.38 JAPAN MARKET ANALYSIS BY PRODUCT
      39. | 6.39 JAPAN MARKET ANALYSIS BY COMPONENT
      40. | 6.40 JAPAN MARKET ANALYSIS BY END USER
      41. | 6.41 SOUTH KOREA MARKET ANALYSIS BY PRODUCT
      42. | 6.42 SOUTH KOREA MARKET ANALYSIS BY COMPONENT
      43. | 6.43 SOUTH KOREA MARKET ANALYSIS BY END USER
      44. | 6.44 MALAYSIA MARKET ANALYSIS BY PRODUCT
      45. | 6.45 MALAYSIA MARKET ANALYSIS BY COMPONENT
      46. | 6.46 MALAYSIA MARKET ANALYSIS BY END USER
      47. | 6.47 THAILAND MARKET ANALYSIS BY PRODUCT
      48. | 6.48 THAILAND MARKET ANALYSIS BY COMPONENT
      49. | 6.49 THAILAND MARKET ANALYSIS BY END USER
      50. | 6.50 INDONESIA MARKET ANALYSIS BY PRODUCT
      51. | 6.51 INDONESIA MARKET ANALYSIS BY COMPONENT
      52. | 6.52 INDONESIA MARKET ANALYSIS BY END USER
      53. | 6.53 REST OF APAC MARKET ANALYSIS BY PRODUCT
      54. | 6.54 REST OF APAC MARKET ANALYSIS BY COMPONENT
      55. | 6.55 REST OF APAC MARKET ANALYSIS BY END USER
      56. | 6.56 SOUTH AMERICA MARKET ANALYSIS
      57. | 6.57 BRAZIL MARKET ANALYSIS BY PRODUCT
      58. | 6.58 BRAZIL MARKET ANALYSIS BY COMPONENT
      59. | 6.59 BRAZIL MARKET ANALYSIS BY END USER
      60. | 6.60 MEXICO MARKET ANALYSIS BY PRODUCT
      61. | 6.61 MEXICO MARKET ANALYSIS BY COMPONENT
      62. | 6.62 MEXICO MARKET ANALYSIS BY END USER
      63. | 6.63 ARGENTINA MARKET ANALYSIS BY PRODUCT
      64. | 6.64 ARGENTINA MARKET ANALYSIS BY COMPONENT
      65. | 6.65 ARGENTINA MARKET ANALYSIS BY END USER
      66. | 6.66 REST OF SOUTH AMERICA MARKET ANALYSIS BY PRODUCT
      67. | 6.67 REST OF SOUTH AMERICA MARKET ANALYSIS BY COMPONENT
      68. | 6.68 REST OF SOUTH AMERICA MARKET ANALYSIS BY END USER
      69. | 6.69 MEA MARKET ANALYSIS
      70. | 6.70 GCC COUNTRIES MARKET ANALYSIS BY PRODUCT
      71. | 6.71 GCC COUNTRIES MARKET ANALYSIS BY COMPONENT
      72. | 6.72 GCC COUNTRIES MARKET ANALYSIS BY END USER
      73. | 6.73 SOUTH AFRICA MARKET ANALYSIS BY PRODUCT
      74. | 6.74 SOUTH AFRICA MARKET ANALYSIS BY COMPONENT
      75. | 6.75 SOUTH AFRICA MARKET ANALYSIS BY END USER
      76. | 6.76 REST OF MEA MARKET ANALYSIS BY PRODUCT
      77. | 6.77 REST OF MEA MARKET ANALYSIS BY COMPONENT
      78. | 6.78 REST OF MEA MARKET ANALYSIS BY END USER
      79. | 6.79 KEY BUYING CRITERIA OF SEMICONDUCTOR & ELECTRONICS
      80. | 6.80 RESEARCH PROCESS OF MRFR
      81. | 6.81 DRO ANALYSIS OF SEMICONDUCTOR & ELECTRONICS
      82. | 6.82 DRIVERS IMPACT ANALYSIS: SEMICONDUCTOR & ELECTRONICS
      83. | 6.83 RESTRAINTS IMPACT ANALYSIS: SEMICONDUCTOR & ELECTRONICS
      84. | 6.84 SUPPLY / VALUE CHAIN: SEMICONDUCTOR & ELECTRONICS
      85. | 6.85 SEMICONDUCTOR & ELECTRONICS, BY PRODUCT, 2024 (% SHARE)
      86. | 6.86 SEMICONDUCTOR & ELECTRONICS, BY PRODUCT, 2024 TO 2035 (USD Billion)
      87. | 6.87 SEMICONDUCTOR & ELECTRONICS, BY COMPONENT, 2024 (% SHARE)
      88. | 6.88 SEMICONDUCTOR & ELECTRONICS, BY COMPONENT, 2024 TO 2035 (USD Billion)
      89. | 6.89 SEMICONDUCTOR & ELECTRONICS, BY END USER, 2024 (% SHARE)
      90. | 6.90 SEMICONDUCTOR & ELECTRONICS, BY END USER, 2024 TO 2035 (USD Billion)
      91. | 6.91 BENCHMARKING OF MAJOR COMPETITORS
    7. LIST OF TABLES
      1. | 7.1 LIST OF ASSUMPTIONS
      2. | | 7.1.1
      3. | 7.2 North America MARKET SIZE ESTIMATES; FORECAST
      4. | | 7.2.1 BY PRODUCT, 2025-2035 (USD Billion)
      5. | | 7.2.2 BY COMPONENT, 2025-2035 (USD Billion)
      6. | | 7.2.3 BY END USER, 2025-2035 (USD Billion)
      7. | 7.3 US MARKET SIZE ESTIMATES; FORECAST
      8. | | 7.3.1 BY PRODUCT, 2025-2035 (USD Billion)
      9. | | 7.3.2 BY COMPONENT, 2025-2035 (USD Billion)
      10. | | 7.3.3 BY END USER, 2025-2035 (USD Billion)
      11. | 7.4 Canada MARKET SIZE ESTIMATES; FORECAST
      12. | | 7.4.1 BY PRODUCT, 2025-2035 (USD Billion)
      13. | | 7.4.2 BY COMPONENT, 2025-2035 (USD Billion)
      14. | | 7.4.3 BY END USER, 2025-2035 (USD Billion)
      15. | 7.5 Europe MARKET SIZE ESTIMATES; FORECAST
      16. | | 7.5.1 BY PRODUCT, 2025-2035 (USD Billion)
      17. | | 7.5.2 BY COMPONENT, 2025-2035 (USD Billion)
      18. | | 7.5.3 BY END USER, 2025-2035 (USD Billion)
      19. | 7.6 Germany MARKET SIZE ESTIMATES; FORECAST
      20. | | 7.6.1 BY PRODUCT, 2025-2035 (USD Billion)
      21. | | 7.6.2 BY COMPONENT, 2025-2035 (USD Billion)
      22. | | 7.6.3 BY END USER, 2025-2035 (USD Billion)
      23. | 7.7 UK MARKET SIZE ESTIMATES; FORECAST
      24. | | 7.7.1 BY PRODUCT, 2025-2035 (USD Billion)
      25. | | 7.7.2 BY COMPONENT, 2025-2035 (USD Billion)
      26. | | 7.7.3 BY END USER, 2025-2035 (USD Billion)
      27. | 7.8 France MARKET SIZE ESTIMATES; FORECAST
      28. | | 7.8.1 BY PRODUCT, 2025-2035 (USD Billion)
      29. | | 7.8.2 BY COMPONENT, 2025-2035 (USD Billion)
      30. | | 7.8.3 BY END USER, 2025-2035 (USD Billion)
      31. | 7.9 Russia MARKET SIZE ESTIMATES; FORECAST
      32. | | 7.9.1 BY PRODUCT, 2025-2035 (USD Billion)
      33. | | 7.9.2 BY COMPONENT, 2025-2035 (USD Billion)
      34. | | 7.9.3 BY END USER, 2025-2035 (USD Billion)
      35. | 7.10 Italy MARKET SIZE ESTIMATES; FORECAST
      36. | | 7.10.1 BY PRODUCT, 2025-2035 (USD Billion)
      37. | | 7.10.2 BY COMPONENT, 2025-2035 (USD Billion)
      38. | | 7.10.3 BY END USER, 2025-2035 (USD Billion)
      39. | 7.11 Spain MARKET SIZE ESTIMATES; FORECAST
      40. | | 7.11.1 BY PRODUCT, 2025-2035 (USD Billion)
      41. | | 7.11.2 BY COMPONENT, 2025-2035 (USD Billion)
      42. | | 7.11.3 BY END USER, 2025-2035 (USD Billion)
      43. | 7.12 Rest of Europe MARKET SIZE ESTIMATES; FORECAST
      44. | | 7.12.1 BY PRODUCT, 2025-2035 (USD Billion)
      45. | | 7.12.2 BY COMPONENT, 2025-2035 (USD Billion)
      46. | | 7.12.3 BY END USER, 2025-2035 (USD Billion)
      47. | 7.13 APAC MARKET SIZE ESTIMATES; FORECAST
      48. | | 7.13.1 BY PRODUCT, 2025-2035 (USD Billion)
      49. | | 7.13.2 BY COMPONENT, 2025-2035 (USD Billion)
      50. | | 7.13.3 BY END USER, 2025-2035 (USD Billion)
      51. | 7.14 China MARKET SIZE ESTIMATES; FORECAST
      52. | | 7.14.1 BY PRODUCT, 2025-2035 (USD Billion)
      53. | | 7.14.2 BY COMPONENT, 2025-2035 (USD Billion)
      54. | | 7.14.3 BY END USER, 2025-2035 (USD Billion)
      55. | 7.15 India MARKET SIZE ESTIMATES; FORECAST
      56. | | 7.15.1 BY PRODUCT, 2025-2035 (USD Billion)
      57. | | 7.15.2 BY COMPONENT, 2025-2035 (USD Billion)
      58. | | 7.15.3 BY END USER, 2025-2035 (USD Billion)
      59. | 7.16 Japan MARKET SIZE ESTIMATES; FORECAST
      60. | | 7.16.1 BY PRODUCT, 2025-2035 (USD Billion)
      61. | | 7.16.2 BY COMPONENT, 2025-2035 (USD Billion)
      62. | | 7.16.3 BY END USER, 2025-2035 (USD Billion)
      63. | 7.17 South Korea MARKET SIZE ESTIMATES; FORECAST
      64. | | 7.17.1 BY PRODUCT, 2025-2035 (USD Billion)
      65. | | 7.17.2 BY COMPONENT, 2025-2035 (USD Billion)
      66. | | 7.17.3 BY END USER, 2025-2035 (USD Billion)
      67. | 7.18 Malaysia MARKET SIZE ESTIMATES; FORECAST
      68. | | 7.18.1 BY PRODUCT, 2025-2035 (USD Billion)
      69. | | 7.18.2 BY COMPONENT, 2025-2035 (USD Billion)
      70. | | 7.18.3 BY END USER, 2025-2035 (USD Billion)
      71. | 7.19 Thailand MARKET SIZE ESTIMATES; FORECAST
      72. | | 7.19.1 BY PRODUCT, 2025-2035 (USD Billion)
      73. | | 7.19.2 BY COMPONENT, 2025-2035 (USD Billion)
      74. | | 7.19.3 BY END USER, 2025-2035 (USD Billion)
      75. | 7.20 Indonesia MARKET SIZE ESTIMATES; FORECAST
      76. | | 7.20.1 BY PRODUCT, 2025-2035 (USD Billion)
      77. | | 7.20.2 BY COMPONENT, 2025-2035 (USD Billion)
      78. | | 7.20.3 BY END USER, 2025-2035 (USD Billion)
      79. | 7.21 Rest of APAC MARKET SIZE ESTIMATES; FORECAST
      80. | | 7.21.1 BY PRODUCT, 2025-2035 (USD Billion)
      81. | | 7.21.2 BY COMPONENT, 2025-2035 (USD Billion)
      82. | | 7.21.3 BY END USER, 2025-2035 (USD Billion)
      83. | 7.22 South America MARKET SIZE ESTIMATES; FORECAST
      84. | | 7.22.1 BY PRODUCT, 2025-2035 (USD Billion)
      85. | | 7.22.2 BY COMPONENT, 2025-2035 (USD Billion)
      86. | | 7.22.3 BY END USER, 2025-2035 (USD Billion)
      87. | 7.23 Brazil MARKET SIZE ESTIMATES; FORECAST
      88. | | 7.23.1 BY PRODUCT, 2025-2035 (USD Billion)
      89. | | 7.23.2 BY COMPONENT, 2025-2035 (USD Billion)
      90. | | 7.23.3 BY END USER, 2025-2035 (USD Billion)
      91. | 7.24 Mexico MARKET SIZE ESTIMATES; FORECAST
      92. | | 7.24.1 BY PRODUCT, 2025-2035 (USD Billion)
      93. | | 7.24.2 BY COMPONENT, 2025-2035 (USD Billion)
      94. | | 7.24.3 BY END USER, 2025-2035 (USD Billion)
      95. | 7.25 Argentina MARKET SIZE ESTIMATES; FORECAST
      96. | | 7.25.1 BY PRODUCT, 2025-2035 (USD Billion)
      97. | | 7.25.2 BY COMPONENT, 2025-2035 (USD Billion)
      98. | | 7.25.3 BY END USER, 2025-2035 (USD Billion)
      99. | 7.26 Rest of South America MARKET SIZE ESTIMATES; FORECAST
      100. | | 7.26.1 BY PRODUCT, 2025-2035 (USD Billion)
      101. | | 7.26.2 BY COMPONENT, 2025-2035 (USD Billion)
      102. | | 7.26.3 BY END USER, 2025-2035 (USD Billion)
      103. | 7.27 MEA MARKET SIZE ESTIMATES; FORECAST
      104. | | 7.27.1 BY PRODUCT, 2025-2035 (USD Billion)
      105. | | 7.27.2 BY COMPONENT, 2025-2035 (USD Billion)
      106. | | 7.27.3 BY END USER, 2025-2035 (USD Billion)
      107. | 7.28 GCC Countries MARKET SIZE ESTIMATES; FORECAST
      108. | | 7.28.1 BY PRODUCT, 2025-2035 (USD Billion)
      109. | | 7.28.2 BY COMPONENT, 2025-2035 (USD Billion)
      110. | | 7.28.3 BY END USER, 2025-2035 (USD Billion)
      111. | 7.29 South Africa MARKET SIZE ESTIMATES; FORECAST
      112. | | 7.29.1 BY PRODUCT, 2025-2035 (USD Billion)
      113. | | 7.29.2 BY COMPONENT, 2025-2035 (USD Billion)
      114. | | 7.29.3 BY END USER, 2025-2035 (USD Billion)
      115. | 7.30 Rest of MEA MARKET SIZE ESTIMATES; FORECAST
      116. | | 7.30.1 BY PRODUCT, 2025-2035 (USD Billion)
      117. | | 7.30.2 BY COMPONENT, 2025-2035 (USD Billion)
      118. | | 7.30.3 BY END USER, 2025-2035 (USD Billion)
      119. | 7.31 PRODUCT LAUNCH/PRODUCT DEVELOPMENT/APPROVAL
      120. | | 7.31.1
      121. | 7.32 ACQUISITION/PARTNERSHIP
      122. | | 7.32.1

    Silicon Photonics Market Segmentation

    Silicon Photonics Product Outlook (USD Million, 2018-2030)

    • Optical Engines & Variable Optical Attenuators
    • Optical Multiplexers & Active Optical Cable
    • Transceivers
    • Others

    Silicon Photonics Component Outlook (USD Million, 2018-2030)

    • Micro-Optical Filters & Mux/Demux Modules
    • Optical Isolators & AWG Terminals

    Silicon Photonics End User Outlook (USD Million, 2018-2030)

    • Military & Defense Industry
    • Commercial Industry
    • IT & Telecommunications Industry

    Silicon Photonics Regional Outlook (USD Million, 2018-2030)

    • North America Outlook (USD Million, 2018-2030)
      • North America Silicon Photonics by Product
        • Optical Engines & Variable Optical Attenuators
        • Optical Multiplexers & Active Optical Cable
        • Transceivers
        • Others
      • North America Silicon Photonics by Component
        • Micro-Optical Filters & Mux/Demux Modules
        • Optical Isolators & AWG Terminals
      • North America Silicon Photonics by End User
        • Military & Defense Industry
        • Commercial Industry
        • IT & Telecommunications Industry
      • US Outlook (USD Million, 2018-2030)
      • US Silicon Photonics by Product
        • Optical Engines & Variable Optical Attenuators
        • Optical Multiplexers & Active Optical Cable
        • Transceivers
        • Others
      • US Silicon Photonics by Component
        • Micro-Optical Filters & Mux/Demux Modules
        • Optical Isolators & AWG Terminals
      • US Silicon Photonics by End User
        • Military & Defense Industry
        • Commercial Industry
        • IT & Telecommunications Industry
      • CANADA Outlook (USD Million, 2018-2030)
      • CANADA Silicon Photonics by Product
        • Optical Engines & Variable Optical Attenuators
        • Optical Multiplexers & Active Optical Cable
        • Transceivers
        • Others
      • CANADA Silicon Photonics by Component
        • Micro-Optical Filters & Mux/Demux Modules
        • Optical Isolators & AWG Terminals
      • CANADA Silicon Photonics by End User
        • Military & Defense Industry
        • Commercial Industry
        • IT & Telecommunications Industry
    • Europe Outlook (USD Million, 2018-2030)
      • Europe Silicon Photonics by Product
        • Optical Engines & Variable Optical Attenuators
        • Optical Multiplexers & Active Optical Cable
        • Transceivers
        • Others
      • Europe Silicon Photonics by Component
        • Micro-Optical Filters & Mux/Demux Modules
        • Optical Isolators & AWG Terminals
      • Europe Silicon Photonics by End User
        • Military & Defense Industry
        • Commercial Industry
        • IT & Telecommunications Industry
      • Germany Outlook (USD Million, 2018-2030)
      • Germany Silicon Photonics by Product
        • Optical Engines & Variable Optical Attenuators
        • Optical Multiplexers & Active Optical Cable
        • Transceivers
        • Others
      • Germany Silicon Photonics by Component
        • Micro-Optical Filters & Mux/Demux Modules
        • Optical Isolators & AWG Terminals
      • Germany Silicon Photonics by End User
        • Military & Defense Industry
        • Commercial Industry
        • IT & Telecommunications Industry
      • France Outlook (USD Million, 2018-2030)
      • France Silicon Photonics by Product
        • Optical Engines & Variable Optical Attenuators
        • Optical Multiplexers & Active Optical Cable
        • Transceivers
        • Others
      • France Silicon Photonics by Component
        • Micro-Optical Filters & Mux/Demux Modules
        • Optical Isolators & AWG Terminals
      • France Silicon Photonics by End User
        • Military & Defense Industry
        • Commercial Industry
        • IT & Telecommunications Industry
      • UK Outlook (USD Million, 2018-2030)
      • UK Silicon Photonics by Product
        • Optical Engines & Variable Optical Attenuators
        • Optical Multiplexers & Active Optical Cable
        • Transceivers
        • Others
      • UK Silicon Photonics by Component
        • Micro-Optical Filters & Mux/Demux Modules
        • Optical Isolators & AWG Terminals
      • UK Silicon Photonics by End User
        • Military & Defense Industry
        • Commercial Industry
        • IT & Telecommunications Industry
      • ITALY Outlook (USD Million, 2018-2030)
      • ITALY Silicon Photonics by Product
        • Optical Engines & Variable Optical Attenuators
        • Optical Multiplexers & Active Optical Cable
        • Transceivers
        • Others
      • ITALY Silicon Photonics by Component
        • Micro-Optical Filters & Mux/Demux Modules
        • Optical Isolators & AWG Terminals
      • ITALY Silicon Photonics by End User
        • Military & Defense Industry
        • Commercial Industry
        • IT & Telecommunications Industry
      • SPAIN Outlook (USD Million, 2018-2030)
      • Spain Silicon Photonics by Product
        • Optical Engines & Variable Optical Attenuators
        • Optical Multiplexers & Active Optical Cable
        • Transceivers
        • Others
      • Spain Silicon Photonics by Component
        • Micro-Optical Filters & Mux/Demux Modules
        • Optical Isolators & AWG Terminals
      • Spain Silicon Photonics by End User
        • Military & Defense Industry
        • Commercial Industry
        • IT & Telecommunications Industry
      • Rest Of Europe Outlook (USD Million, 2018-2030)
      • Rest Of Europe Silicon Photonics by Product
        • Optical Engines & Variable Optical Attenuators
        • Optical Multiplexers & Active Optical Cable
        • Transceivers
        • Others
      • REST OF EUROPE Silicon Photonics by Component
        • Micro-Optical Filters & Mux/Demux Modules
        • Optical Isolators & AWG Terminals
      • REST OF EUROPE Silicon Photonics by End User
        • Military & Defense Industry
        • Commercial Industry
        • IT & Telecommunications Industry
    • Asia-Pacific Outlook (USD Million, 2018-2030)
      • Asia-Pacific Silicon Photonics by Product
        • Optical Engines & Variable Optical Attenuators
        • Optical Multiplexers & Active Optical Cable
        • Transceivers
        • Others
      • Asia-Pacific Silicon Photonics by Component
        • Micro-Optical Filters & Mux/Demux Modules
        • Optical Isolators & AWG Terminals
      • Asia-Pacific Silicon Photonics by End User
        • Military & Defense Industry
        • Commercial Industry
        • IT & Telecommunications Industry
      • China Outlook (USD Million, 2018-2030)
      • China Silicon Photonics by Product
        • Optical Engines & Variable Optical Attenuators
        • Optical Multiplexers & Active Optical Cable
        • Transceivers
        • Others
      • China Silicon Photonics by Component
        • Micro-Optical Filters & Mux/Demux Modules
        • Optical Isolators & AWG Terminals
      • China Silicon Photonics by End User
        • Military & Defense Industry
        • Commercial Industry
        • IT & Telecommunications Industry
      • Japan Outlook (USD Million, 2018-2030)
      • Japan Silicon Photonics by Product
        • Optical Engines & Variable Optical Attenuators
        • Optical Multiplexers & Active Optical Cable
        • Transceivers
        • Others
      • Japan Silicon Photonics by Component
        • Micro-Optical Filters & Mux/Demux Modules
        • Optical Isolators & AWG Terminals
      • Japan Silicon Photonics by End User
        • Military & Defense Industry
        • Commercial Industry
        • IT & Telecommunications Industry
      • India Outlook (USD Million, 2018-2030)
      • India Silicon Photonics by Product
        • Optical Engines & Variable Optical Attenuators
        • Optical Multiplexers & Active Optical Cable
        • Transceivers
        • Others
      • India Silicon Photonics by Component
        • Micro-Optical Filters & Mux/Demux Modules
        • Optical Isolators & AWG Terminals
      • India Silicon Photonics by End User
        • Military & Defense Industry
        • Commercial Industry
        • IT & Telecommunications Industry
      • Australia Outlook (USD Million, 2018-2030)
      • Australia Silicon Photonics by Product
        • Optical Engines & Variable Optical Attenuators
        • Optical Multiplexers & Active Optical Cable
        • Transceivers
        • Others
      • Australia Silicon Photonics by Component
        • Micro-Optical Filters & Mux/Demux Modules
        • Optical Isolators & AWG Terminals
      • Australia Silicon Photonics by End User
        • Military & Defense Industry
        • Commercial Industry
        • IT & Telecommunications Industry
      • Rest of Asia-Pacific Outlook (USD Million, 2018-2030)
      • Rest of Asia-Pacific Silicon Photonics by Product
        • Optical Engines & Variable Optical Attenuators
        • Optical Multiplexers & Active Optical Cable
        • Transceivers
        • Others
      • Rest of Asia-Pacific Silicon Photonics by Component
        • Micro-Optical Filters & Mux/Demux Modules
        • Optical Isolators & AWG Terminals
      • Rest of Asia-Pacific Silicon Photonics by End User
        • Military & Defense Industry
        • Commercial Industry
        • IT & Telecommunications Industry
    • Rest of the World Outlook (USD Million, 2018-2030)
      • Rest of the World Silicon Photonics by Product
        • Optical Engines & Variable Optical Attenuators
        • Optical Multiplexers & Active Optical Cable
        • Transceivers
        • Others
      • Rest of the World Silicon Photonics by Component
        • Micro-Optical Filters & Mux/Demux Modules
        • Optical Isolators & AWG Terminals
      • Rest of the World Silicon Photonics by End User
        • Military & Defense Industry
        • Commercial Industry
        • IT & Telecommunications Industry
      • Middle East Outlook (USD Million, 2018-2030)
      • Middle East Silicon Photonics by Product
        • Optical Engines & Variable Optical Attenuators
        • Optical Multiplexers & Active Optical Cable
        • Transceivers
        • Others
      • Middle East Silicon Photonics by Component
        • Micro-Optical Filters & Mux/Demux Modules
        • Optical Isolators & AWG Terminals
      • Middle East Silicon Photonics by End User
        • Military & Defense Industry
        • Commercial Industry
        • IT & Telecommunications Industry
      • Africa Outlook (USD Million, 2018-2030)
      • Africa Silicon Photonics by Product
        • Optical Engines & Variable Optical Attenuators
        • Optical Multiplexers & Active Optical Cable
        • Transceivers
        • Others
      • Africa Silicon Photonics by Component
        • Micro-Optical Filters & Mux/Demux Modules
        • Optical Isolators & AWG Terminals
      • Africa Silicon Photonics by End User
        • Military & Defense Industry
        • Commercial Industry
        • IT & Telecommunications Industry
      • Latin America Outlook (USD Million, 2018-2030)
      • Latin America Silicon Photonics by Product
        • Optical Engines & Variable Optical Attenuators
        • Optical Multiplexers & Active Optical Cable
        • Transceivers
        • Others
      • Latin America Silicon Photonics by Component
        • Micro-Optical Filters & Mux/Demux Modules
        • Optical Isolators & AWG Terminals
      • Latin America Silicon Photonics by End User
        • Military & Defense Industry
        • Commercial Industry
        • IT & Telecommunications Industry
    Infographic

    Free Sample Request

    Kindly complete the form below to receive a free sample of this Report

    Get Free Sample

    Customer Strories

    “I am very pleased with how market segments have been defined in a relevant way for my purposes (such as "Portable Freezers & refrigerators" and "last-mile"). In general the report is well structured. Thanks very much for your efforts.”

    Victoria Milne

    Founder
    Case Study
    Chemicals and Materials

    Compare Licence

    ×
    Features License Type
    Single User Multiuser License Enterprise User
    Price $4,950 $5,950 $7,250
    Maximum User Access Limit 1 User Upto 10 Users Unrestricted Access Throughout the Organization
    Free Customization
    Direct Access to Analyst
    Deliverable Format
    Platform Access
    Discount on Next Purchase 10% 15% 15%
    Printable Versions