Smart Contracts Market (2026 - 2035)

Smart Contracts Market Size, Share and Research Report: By Blockchain Platform (Bitcoin, Sidechains, NXT, and Ethereum), By Technology (Ethereum, Rootstock (RSK), Namecoin, Ripple, and Others), By End User (Banking, Government, Management, Supply chain, Automobile, Insurance, Real Estate, and Healthcare), and By Region (North America, Europe, Asia-Pacific, and Rest Of The World) – Market Forecast Till 2035.
ID: MRFR/ICT/3169-HCR
100 Pages
Ankit Gupta
Last Updated: June 30, 2026
Smart Contracts Market
Market Size
Forecast Period2026-2035
CAGR (2026-2035)21.5%
2025 Market SizeUSD 2.78 billion
2035 Market SizeUSD 19.51 billion
Key Players
IBM Corporation
ConsenSys
Chainlink Labs
R3
Ripple Labs
Solana Labs
Opportunities
  • AI-Powered Smart Contract Auditing and Monitoring
  • Zero-Knowledge-Proof Privacy Solutions
  • Emerging-Market Government Services

Smart Contracts Market Summary

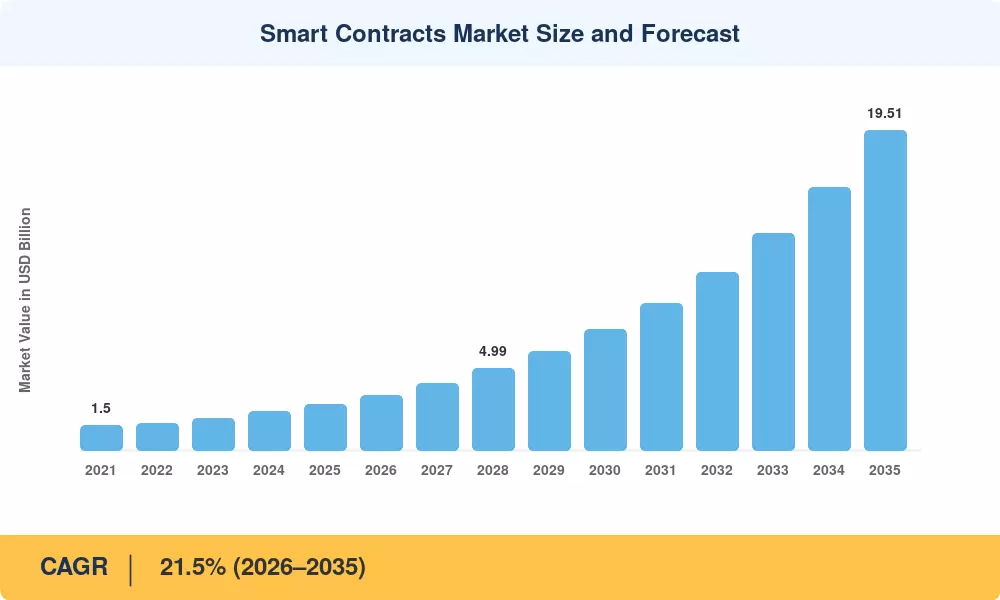
The Smart Contracts Market reached USD 2.78 billion in 2025 and is projected to grow from USD 3.38 billion in 2026 to USD 19.51 billion by 2035, registering a 21.5% CAGR during the 2026–2035 forecast period. Two catalysts are accelerating this trajectory: the European Union's Markets in Crypto-Assets (MiCA) regulation, which gives financial institutions a compliance template for deploying on-chain settlement workflows [1], and Wyoming's state-issued stable-token legislation, which creates a regulatory sandbox for programmable fiat instruments [2]. Together, these frameworks compress enterprise project timelines from years to months.

The technical transition underway is replacing legacy clearing and reconciliation layers, generally run by three or four intermediaries, with self-executing code that settles transactions in minutes instead of days. Large banks like JPMorgan and HSBC are already using blockchain payment rails for high-value cross-border transactions, while multinational retailers are trialing stablecoin payment channels to reduce card-processing fees by up to 70% [3]. Interoperability protocols connecting public and private ledgers have matured enough to enable multi-network orchestration, removing a big hurdle to adoption that plagued early roll-outs.

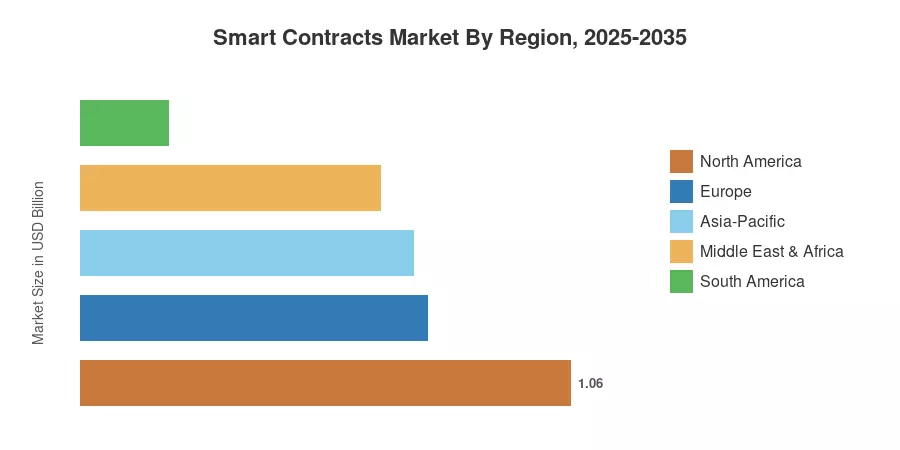
North America holds around 38% of the Smart Contracts Market share, backed by strong venture-capital support and regulatory clarity in important U.S. states. The Asia-Pacific area is the fastest expanding, led by government-sponsored digitalization efforts in India, South Korea and Singapore. Europe is second with about 27%, fuelled by MiCA uptake and the European Central Bank’s digital euro experimentation. Post-quantum encryption and green consensus methods are reducing perceived risk, and sectors such as healthcare and utilities are likely to be early adopters in the next wave through 2035, particularly conservative sectors.

Key Report Takeaways

• By Contract Type & Deployment Model

  • Application Logic Contracts held 44.8% of revenue share in 2025, reflecting strong demand for programmable financial settlement and supply-chain automation.
  • Decentralized Autonomous Organizations are set to expand at a 32.7% CAGR through 2035, fueled by community-governed treasury models in DeFi and gaming ecosystems.
  • Layer-2 solutions are forecast to record the fastest deployment-model CAGR of 30.9% to 2035, as rollup architectures reduce transaction costs by over 90%.

• By Enterprise Size & End-User Industry

  • Large organizations accounted for 63.2% of the Smart Contracts Market in 2025, led by banks and insurers embedding blockchain into core operations.
  • Small and medium enterprises are adopting smart contracts at a 29.5% CAGR, enabled by low-code blockchain platforms that eliminate the need for Solidity expertise.

• By Geography

  • North America leads the Smart Contracts Market with approximately 38% share, underpinned by U.S. fintech innovation corridors and Canadian blockchain sandbox programs.
  • Asia-Pacific's 25.8% CAGR positions it as the fastest-growing region, with India's Digital India Stack and South Korea's CBDC pilots as primary accelerants.


Smart Contracts Market Size and Forecast (2021–2035)

MRFR’s forecasts integrate bottom-up income analysis of platform licensing, transaction-fee pools, and consulting-integration services with top-down validation against enterprise blockchain spending standards released by the World Economic Forum [4][5]. Historical figures are sourced from annual reports, SEC filings and venture-capital databases. Forecast years are based on a calibrated CAGR, guided by regulatory acceptance curves and protocol-level on-chain activity measures.
Smart Contracts Market Size and Forecast
Our Impact
Enabled $4.3B Revenue Impact for Fortune 500 and Leading Multinationals
Partnering with 2000+ Global Organizations Each Year
30K+ Citations by Top-Tier Firms in the Industry

Driver Impact Analysis

Driver ~% Impact on CAGR Geographic Relevance Impact Timeline
Enterprise blockchain settlement adoption 22–26% North America, Europe Short-term (≤2 yr)
Regulatory frameworks (MiCA, Wyoming) 18–22% Europe, North America Short-term (≤2 yr)
Real-world asset tokenization 15–19% Global Medium-term (2–4 yr)
DeFi protocol expansion 12–16% Global Medium-term (2–4 yr)
Layer-2 scaling solutions 10–14% Global Short-term (≤2 yr)
Government digitization mandates 8–12% Asia-Pacific, MEA Long-term (≥4 yr)
AI-powered contract auditing 5–9% North America, Europe Long-term (≥4 yr)


Enterprise Blockchain Settlement Adoption

Major banks are replacing multi-day clearing cycles with blockchain-based instant settlement. JPMorgan's Onyx platform processed over USD 700 billion in tokenized repo transactions by late 2024, demonstrating that smart contracts can handle institutional-grade volumes without manual reconciliation [3]. HSBC and Standard Chartered have followed with similar programmable-payment corridors for trade finance, cutting operational costs by an estimated 40–60%. This driver exerts the strongest near-term pull on the Smart Contracts Market because it converts proof-of-concept skepticism into revenue-generating infrastructure.

Regulatory Clarity Accelerating Deployment

MiCA's phased rollout across EU member states created the first comprehensive legal framework for crypto-asset services, including explicit provisions for smart-contract-based stablecoin issuance [1]. Across the Atlantic, Wyoming's 2024 Stable Token Act authorized the state treasury to issue a fiat-backed digital token on a public blockchain, setting a precedent for other U.S. states. Regulatory certainty compresses compliance review from 18 months to as few as 4 months, directly shortening sales cycles for smart-contract platform vendors.

Real-World-Asset Tokenization

The World Economic Forum estimates that USD 16 trillion in illiquid assets could be tokenized by 2030, spanning property deeds, carbon credits, private equity, and trade receivables [9]. Smart contracts underpin every step of this value chain — from origination and fractional ownership logic to automated dividend distribution and secondary trading. projects tokenized asset management revenues alone at USD 600 billion by 2030, making this driver the primary mid-term catalyst for the Smart Contracts Market [15].

Layer-2 Scaling and Cost Reduction

Ethereum rollup networks such as Arbitrum, Optimism, and zkSync reduced per-transaction gas costs by 95–99% between 2023 and 2025, unlocking use cases previously priced out of Layer-1 execution [8]. Average transaction fees on leading Layer-2 networks dropped below USD 0.01, making micro-payment and IoT-triggered smart contracts commercially viable for the first time. This cost deflation is especially important for the Smart Contracts Market in Asia-Pacific, where small-ticket trade-finance and agricultural-supply-chain applications require sub-cent execution economics.


Restraints Impact Analysis

The restraint-impact percentages below represent the estimated drag each factor exerts on market adoption momentum. These are directional assessments and are not additive to the CAGR.

Restraint ~% Negative Impact on CAGR Geographic Relevance Impact Timeline
Smart contract code vulnerabilities –15 to –20% Global Short-term
Legal enforceability uncertainty –12 to –16% Global Medium-term
Blockchain scalability constraints –8 to –12% Global Short-term
Regulatory fragmentation across jurisdictions –6 to –10% Asia-Pacific, South America Long-term
Blockchain developer talent shortage –5 to –8% Global Medium-term


Smart Contract Code Vulnerabilities

Between 2021 and 2024, over USD 5.8 billion was lost to smart-contract exploits, re-entrancy attacks, and flash-loan manipulations according to Chainalysis data [16]. High-profile incidents such as the Euler Finance exploit (USD 197 Million, March 2023) and the Mixin Network breach (USD 200 Million, September 2023) erode institutional confidence. While formal-verification tools and bug-bounty programs mitigate risk, the perception that code-is-law exposes firms to uninsurable losses remains the single largest headwind to the Smart Contracts Market in regulated industries.

Legal Enforceability Uncertainty

Most jurisdictions have yet to grant smart contracts the same legal standing as traditional contracts. English common-law systems require identifiable offer, acceptance, and consideration — elements that autonomous on-chain execution can obscure [17]. The UK Law Commission's 2023 advisory paper acknowledged smart contracts as legally enforceable in principle, but left dispute-resolution mechanics largely undefined. Until arbitration frameworks mature, enterprises in insurance, real estate, and government procurement remain cautious.

Blockchain Developer Talent Shortage

A 2024 Electric Capital developer report found that the total number of active blockchain developers globally plateaued at roughly 23,000 monthly contributors, far below the labor demand generated by enterprise adoption [19]. Solidity and Rust proficiency remain concentrated in the U.S. and India, creating geographic bottlenecks. This constraint inflates consulting rates and extends project delivery timelines by 3–6 months, temporarily slowing Smart Contracts Market expansion in regions with limited developer ecosystems.


Smart Contracts Market Opportunities

AI-Powered Smart Contract Auditing and Monitoring

Generative AI and large language models are increasingly deployed to scan, audit, and simulate smart-contract behavior before mainnet deployment. Firms like CertiK and Trail of Bits now offer AI-enhanced audit pipelines that detect vulnerabilities in hours rather than weeks, reducing audit costs by up to 60% [13]. This lowers the barrier for SMEs to deploy production-grade contracts, directly addressing the restraint described in.

Zero-Knowledge-Proof Privacy Solutions

ZK-rollups and ZK-proof protocols such as zkSync and Polygon zkEVM enable confidential transaction execution while preserving on-chain verifiability. Enterprise users in healthcare and defense — sectors where data privacy is non-negotiable — are piloting ZK-based smart contracts for patient-record consent management and classified supply-chain tracking [12]. This technology converts privacy-sensitive verticals from skeptics into active adopters of the Smart Contracts Market.

Emerging-Market Government Services

India's Open Network for Digital Commerce and Nigeria's eNaira CBDC program illustrate how governments in emerging economies are leveraging smart contracts to automate subsidy disbursement, land-title registration, and public procurement [10]. The addressable opportunity exceeds USD 400 billion in annual government payment flows across South Asia and Sub-Saharan Africa, with smart contracts offering transparency and corruption-reduction benefits that traditional systems cannot match.

Insurance Parametric Contract Automation

Parametric insurance products — which automatically trigger payouts when predefined conditions (rainfall levels, earthquake magnitude) are met — represent one of the fastest-growing use cases. Swiss Re and Lemonade have deployed Ethereum-based parametric policies in crop insurance and flight-delay markets [11]. Globally, the parametric insurance segment could drive over USD 1.2 billion in smart-contract platform revenue by 2032.

Carbon-Credit and ESG Tokenization

Voluntary carbon markets surpassed USD 2 billion in annual trading volume in 2024, and smart contracts provide the transparent provenance tracking that corporate buyers demand [14]. Platforms such as Toucan Protocol and KlimaDAO use on-chain registries to retire verified carbon credits, eliminating double-counting risks. As ESG reporting mandates tighten under the EU's Corporate Sustainability Reporting Directive, demand for verifiable, contract-governed offset mechanisms will expand Smart Contracts Market revenue in Europe and North America.


Smart Contracts Market Future Outlook

AI-Autonomous Contract Orchestration

By 2030, AI agents are expected to autonomously negotiate, deploy, and manage smart contracts on behalf of enterprises, reducing human intervention to exception handling. estimates that AI-augmented process automation could unlock USD 4.4 trillion in annual value globally by 2030, and smart contracts sit at the execution layer of that automation stack [13][20]. Contract-lifecycle platforms will integrate large language models to draft, audit, and optimize on-chain logic in natural language, compressing development time from weeks to hours.

Platform Economics and Protocol Consolidation

The current landscape of over 100 Layer-1 blockchains will consolidate toward 10–15 dominant execution environments connected by standardized interoperability bridges. Ethereum, Solana, and a handful of enterprise-grade permissioned platforms will capture the bulk of the Smart Contracts Market's transaction-fee revenue. At the same time, smaller chains pivot to niche verticals such as gaming, identity, or IoT [8]. Protocol-level revenue-sharing models — inspired by Ethereum's EIP-1559 fee-burn mechanism — will reshape vendor economics by aligning platform incentives with on-chain activity volume.

ESG and Sustainability-Linked Smart Contracts

The International Energy Agency projects global corporate demand for verified carbon offsets to triple by 2032, reaching USD 50 billion annually [14]. Smart contracts provide the immutable audit trail required by regulators under the EU's Corporate Sustainability Reporting Directive and the SEC's climate-disclosure rule. Automated sustainability-linked loan covenants — where interest rates adjust in real-time based on verified ESG performance — represent a high-value use case that will embed the Smart Contracts Market deeper into mainstream corporate treasury operations.

Post-Quantum Security and Institutional Trust

NIST's finalization of post-quantum cryptographic standards in 2024 set the stage for blockchain networks to upgrade their signature schemes before quantum computing reaches a cryptographically relevant scale [12]. Ethereum's roadmap includes a quantum-resistant signature migration, and enterprise platforms like R3's Corda are already testing lattice-based encryption. These upgrades are critical to the Smart Contracts Market's long-term viability because institutional allocators — pension funds, sovereign wealth funds — require assurance that on-chain assets will remain secure through 2040 and beyond.


Smart Contracts Market Segmentation

By Contract Type

Segment Key Metric Primary Demand Driver
Application Logic Contracts 44.8% share (2025) Automated settlement, DeFi protocols
Smart Legal Contracts USD 0.58 billion (2025) Regulatory compliance, insurance claims
Decentralized Autonomous Organizations 32.7% CAGR (2026–2035) Community governance, treasury management


Application Logic Contracts dominate the Smart Contracts Market because they power the core transaction-execution layer for DeFi lending, decentralized exchanges, and cross-border payment protocols. Enterprises value their deterministic execution and atomic settlement guarantees, which eliminate counterparty risk in high-value financial workflows. Smart Legal Contracts are gaining traction in insurance and real estate, where hybrid on-chain/off-chain architectures allow automated claim processing while preserving human-readable legal terms that satisfy regulatory requirements [17].

Decentralized Autonomous Organizations represent the fastest-growing contract type, driven by their ability to coordinate decentralized governance and capital allocation without a centralized management layer. DAOs now manage aggregate treasuries exceeding USD 30 billion across DeFi, gaming, and social-media verticals, and institutional investors are increasingly participating through compliant DAO wrapper structures [6].

By Deployment Model

Segment Key Metric Primary Demand Driver
Public Permissionless Chains 49.5% share (2025) DeFi, NFT, tokenized-asset trading
Private Consortium Chains USD 0.62 billion (2025) Enterprise confidentiality, regulatory compliance
Layer-2 Solutions 30.9% CAGR (2026–2035) Cost reduction, throughput scaling


Public Permissionless Chains retain the largest deployment share within the Smart Contracts Market, reflecting the composability advantages that open networks offer DeFi developers and tokenized-asset issuers. Ethereum alone processes over 1.2 million transactions daily across its Layer-1 and rollup ecosystem. Private Consortium Chains serve enterprise clients requiring data confidentiality — banks running interbank settlement on R3 Corda or Hyperledger Fabric, for instance — and command premium pricing through annual licensing and integration-service fees.

By Enterprise Size

Segment Key Metric Primary Demand Driver
Large Enterprises 63.2% share (2025) Core banking transformation, trade-finance digitization
Small and Medium Enterprises 29.5% CAGR (2026–2035) Low-code platforms, SaaS blockchain tools


Large enterprises drive the majority of the current Smart Contracts Market revenue through multi-million-dollar platform-integration projects in banking, insurance, and supply-chain management. SMEs, however, are the growth story: cloud-native platforms from vendors such as Alchemy, Thirdweb, and QuickNode allow small businesses to deploy smart contracts without hiring blockchain developers, compressing onboarding from months to days.

By End-User Industry

Segment Key Metric Primary Demand Driver
BFSI 36% share (2025) Payment rails, trade finance, KYC/AML automation
Retail & E-Commerce 21.6% CAGR (2026–2035) Loyalty programs, programmable stablecoins
Government USD 0.25 billion (2025) Digital identity, subsidy disbursement
Healthcare 24.8% CAGR (2026–2035) Patient consent, pharmaceutical provenance
Supply Chain & Logistics 16% share (2025) Provenance tracking, automated invoicing
Real Estate USD 0.11 billion (2025) Tokenized deeds, fractional ownership


BFSI remains the anchor vertical for the Smart Contracts Market, accounting for the largest industry share. Banks are moving beyond pilot programs into production-grade settlement and compliance systems, with JPMorgan, Goldman Sachs, and Citigroup all operating proprietary smart-contract infrastructure. Retail & E-Commerce is emerging as a high-growth end-user segment as brands integrate loyalty-token programs and programmable coupon logic into customer engagement platforms.


Regional Market Share Analysis

Region Key Metric Primary Investment Themes
North America 38% share (2025) Enterprise settlement, stablecoin regulation, DeFi infrastructure
Europe 27% share (2025) MiCA compliance, digital euro pilots, ESG tokenization
Asia-Pacific 25.8% CAGR (2026–2035) Government digitization, CBDC development, Layer-2 scaling
South America USD 0.19 billion (2025) Fintech inclusion, remittance optimization
Middle East & Africa 23.4% CAGR (2026–2035) Smart-city programs, oil & gas supply-chain modernization
Total USD 2.78 billion (2025)

The Smart Contracts Market exhibits pronounced regional variation shaped by regulatory maturity, venture-capital density, and government blockchain strategies. North America retains dominance through deep financial-sector integration, while Asia-Pacific is emerging as the primary growth engine.


North America

Country Key Metric Key Driver
United States 78% of regional share SEC and CFTC regulatory clarity; venture capital concentration
Canada 14% of regional share Ontario Securities Commission blockchain sandbox
Mexico USD 0.08 billion (2025) Cross-border remittance smart-contract corridors


The United States remains the epicenter of the Smart Contracts Market, hosting the majority of Layer-1 protocol foundations and audit firms. California and New York together account for over 60% of domestic blockchain venture funding, while Wyoming's favorable legal environment attracts on-chain asset issuers seeking state-level regulatory certainty [2]. Canada's blockchain sandbox programs — operated by the Ontario Securities Commission and Payments Canada — provide regulated testing environments for bank-grade smart contracts, positioning the country as a secondary hub within the region.

Europe

Country Key Metric Key Driver
Germany 23.5% CAGR (2026–2035) BaFin crypto-custody license; automotive supply-chain pilots
United Kingdom 26% of regional share FCA regulatory engagement; London fintech ecosystem
France USD 0.09 billion (2025) Banque de France CBDC experimentation
Italy 18.5% CAGR (2026–2035) Insurance-sector parametric contract demand
Spain 8% of regional share Barcelona blockchain hub; public-sector pilots
Nordic Countries USD 0.06 billion (2025) Green-consensus energy alignment; digital identity programs
Russia 3% of regional share CFA law digital financial asset framework
Rest of Europe 17.2% CAGR (2026–2035) Swiss Crypto Valley; Liechtenstein Blockchain Act


MiCA's full enforcement across the European Union in 2025 has catalyzed institutional adoption by harmonizing licensing requirements for crypto-asset service providers. Germany's BaFin issued over 30 crypto-custody licenses by early 2025, and the UK's Financial Conduct Authority outlined a bespoke regulatory approach to stablecoins and on-chain settlement [1]. These moves make Europe the world's most comprehensively regulated Smart Contracts Market, attracting compliance-focused enterprise buyers from banking and insurance.

Asia-Pacific

Country Key Metric Key Driver
China 29% of regional share Blockchain Service Network; digital yuan smart-contract hooks
India 27.4% CAGR (2026–2035) Digital India Stack; ONDC commerce protocol
Japan USD 0.07 billion (2025) Revised Payment Services Act; STO platforms
South Korea 26.8% CAGR (2026–2035) CBDC pilot; K-blockchain certification program
ASEAN 21% of regional share Singapore MAS regulatory sandbox; Thailand digital-baht pilots
Rest of Asia-Pacific USD 0.04 billion (2025) Australia's Treasury token-mapping consultation


Government-led blockchain infrastructure programs differentiate the Asia-Pacific from other regions. China's Blockchain Service Network — a state-endorsed permissioned backbone — enables local governments to deploy smart contracts for land registration, tax collection, and healthcare credentialing at the provincial scale [10]. India's National Payments Corporation is integrating smart-contract hooks into its Unified Payments Interface, potentially exposing 300 million digital wallets to programmable payment functionality.

South America

Country Key Metric Key Driver
Brazil 58% of regional share Drex CBDC; central-bank blockchain sandbox
Argentina 22.6% CAGR (2026–2035) Inflation-hedge stablecoin demand; DeFi adoption
Rest of South America USD 0.04 billion (2025) Colombia and Chile fintech-regulation reforms


Brazil's central bank launched the Drex programmable-real pilot in 2024, making it the most advanced CBDC project in Latin America and a direct catalyst for smart-contract middleware vendors [10]. Argentina's chronic inflation has driven grassroots adoption of stablecoin-based savings and remittance applications, creating bottom-up demand for the Smart Contracts Market in peer-to-peer financial services.

Middle East & Africa

Country Key Metric Key Driver
Saudi Arabia 31% of regional share Vision 2030 smart-city infrastructure programs
UAE 25.2% CAGR (2026–2035) DIFC and ADGM virtual-asset regulatory frameworks
South Africa USD 0.02 billion (2025) SARB Project Khokha II blockchain settlement pilot
Egypt 19.8% CAGR (2026–2035) National post-trade infrastructure modernization
Rest of MEA 15% of regional share Kenya, Nigeria digital identity and CBDC pilots


The UAE's Dubai International Financial Centre and Abu Dhabi Global Market have established dedicated virtual-asset regulatory frameworks that attract global smart-contract platform vendors seeking a Middle Eastern beachhead [18]. Saudi Arabia's NEOM smart-city project incorporates blockchain-based utility metering and supply-chain provenance tracking, positioning the Kingdom as a long-term demand anchor for the Smart Contracts Market in the region.


Smart Contracts Market By Region, 2025-2035

Competitive Benchmarking

The Smart Contracts Market is characterized by minimal concentration, as expected with an HHI below 600. The total proportion of the top-five suppliers is estimated at 25–32%, with the rest of the revenue split between scores of protocol foundations, auditing firms, middleware platforms, and consultancy integrators. Competitive fragmentation is sustained by open-source protocol economics and cheap switching costs.

Company Est. Revenue Share Range Key Offerings Strategic Positioning
IBM Corporation 6–9% Hyperledger Fabric, blockchain consulting Enterprise-grade permissioned platforms for BFSI and supply chain
ConsenSys 5–8% MetaMask, Infura, Linea zkEVM Full-stack Ethereum infrastructure and developer tooling
Chainlink Labs 4–7% Decentralized oracle network, CCIP Cross-chain data delivery and interoperability middleware
R3 4–6% Corda enterprise blockchain Regulated financial services settlement and digital-asset issuance
Ripple Labs 3–6% XRP Ledger, Ripple Payments Cross-border payment settlement for banks and money-service businesses
Solana Labs 3–5% Solana blockchain, Firedancer validator High-throughput, low-cost programmable transactions for DeFi and payments
OpenZeppelin 2–4% Defender, Contracts library, audit services Smart-contract security tooling and open-source standards
Ava Labs 2–4% Avalanche C-Chain, subnet architecture Customizable enterprise subnets with sub-second finality
Hedera Hashgraph 2–3% Hedera Token Service, consensus service Enterprise governance via council model; energy-efficient consensus
Input Output Global 1–3% Cardano blockchain, Plutus smart contracts Peer-reviewed protocol design targeting government and education sectors


Recent News & Developments

  • JPMorgan (October 2024): Expanded Onyx blockchain platform to support programmable multi-currency settlement across 12 additional corridor pairs, processing over USD 2 billion daily in tokenized repo and FX transactions [3].


  • ConsenSys (June 2024): Released Linea zkEVM public mainnet, offering Ethereum-equivalent execution at 95% lower gas costs and attracting over 2 million unique wallets within six months [6].


  • OpenZeppelin (November 2024): Introduced Defender 2.0 AI-assisted audit module, reducing average audit turnaround from 14 days to 3 days for standard ERC-20 and ERC-721 contracts [13].


Smart Contracts Market Report Scope

Parameter Detail
Market Scope Global Smart Contracts Market by Contract Type, Deployment Model, Enterprise Size, End-User Industry, and Region
Study Period 2021–2035
CAGR 21.5% (2026–2035)
Base Year Market Size USD 2.78 billion (2025)
Forecast Year Market Size USD 19.51 billion (2035)
Fastest Growing Segment Decentralized Autonomous Organizations (32.7% CAGR)
Fastest Growing Region Asia-Pacific (25.8% CAGR)
Companies Profiled 10 (IBM, ConsenSys, Chainlink Labs, R3, Ripple Labs, Solana Labs, OpenZeppelin, Ava Labs, Hedera Hashgraph, Input Output Global)
Valuation Currency USD billion


FAQs

How should institutional investors evaluate Smart Contracts Market exposure through public equities versus direct protocol tokens?
Public equities such as Coinbase and Galaxy Digital offer regulated, auditable exposure without custody risk, while protocol tokens like ETH provide direct upside tied to on-chain fee revenue [24]. Most institutional allocators blend both, capping token exposure at 10–15% of their digital-asset sleeve.
What technical due diligence steps should enterprises take before selecting a Smart Contracts Market platform vendor?
Evaluate the vendor's audit history, bug-bounty track record, and formal-verification tooling coverage across deployed contracts [16]. Insist on third-party penetration testing and escrow-based upgrade governance before signing production-level agreements.
How do gas-fee structures differ across competing Smart Contracts Market platforms, and why does this matter for procurement?
Ethereum charges variable gas fees based on network congestion, while Solana and Avalanche use fixed or near-zero fee models [23]. Procurement teams should model annual transaction volumes against each platform's fee curve to forecast the total cost of ownership.
What insurance products exist to mitigate smart-contract exploit risk in the Smart Contracts Market?
Nexus Mutual and InsurAce offer on-chain coverage pools that pay claims upon verified exploit events, though premiums can reach 5–15% annually [11]. Traditional insurers like Aon and Marsh now offer bespoke cyber policies covering blockchain-specific loss scenarios.
How do cross-chain bridges impact vendor lock-in risk in the Smart Contracts Market?
Bridges like Chainlink CCIP and LayerZero enable contract logic to execute across multiple networks, reducing single-chain dependency [8]. Enterprises should prioritize vendors supporting open bridge standards to preserve portability.
What role do smart-contract standards such as ERC-4626 play in procurement decisions for the Smart Contracts Market?
ERC-4626 standardizes tokenized-vault interfaces, allowing enterprises to swap yield-strategy providers without rewriting integration code [23]. Adopting standards-compliant contracts lowers switching costs and accelerates multi-vendor interoperability.
How does jurisdictional arbitrage influence where enterprises deploy Smart Contracts Market solutions?
Firms often incorporate smart-contract entities in jurisdictions with clear legal frameworks — Wyoming, Switzerland, or Singapore — to minimize enforcement ambiguity [2][18]. Tax treatment of on-chain revenue and token classification varies widely, making legal-structure planning essential.    
Author
Author
Author Profile
Ankit Gupta LinkedIn
Team Lead - Research
Ankit Gupta is a seasoned market intelligence and strategic research professional with over six plus years of experience in the ICT and Semiconductor industries. With academic roots in Telecom, Marketing, and Electronics, he blends technical insight with business strategy. Ankit has led 200+ projects, including work for Fortune 500 clients like Microsoft and Rio Tinto, covering market sizing, tech forecasting, and go-to-market strategies. Known for bridging engineering and enterprise decision-making, his insights support growth, innovation, and investment planning across diverse technology markets.

Research Approach


Secondary Research

The secondary research process involved comprehensive analysis of regulatory databases, peer-reviewed technology journals, blockchain publications, and authoritative technology organizations. Key sources included the US Commodity Futures Trading Commission (CFTC), Financial Crimes Enforcement Network (FinCEN), European Banking Authority (EBA), European Securities and Markets Authority (ESMA), US Securities and Exchange Commission (SEC), Monetary Authority of Singapore (MAS), Swiss Federal Assembly Blockchain Regulations, Financial Action Task Force (FATF), World Economic Forum (WEF) Global Blockchain Reports, International Organization for Standardization (ISO) Blockchain Technical Committee (TC 307), IEEE Standards Association, National Institute of Standards and Technology (NIST), OECD Blockchain Policy Centre, International Monetary Fund (IMF) Fintech Reports, Bank for International Settlements (BIS) Innovation Hub, European Central Bank (ECB) Digital Currency Reports, US Federal Reserve Financial Stability Reports, Chainalysis Blockchain Data Platform, DeFi Llama Protocol Analytics, and national financial regulatory authority reports from key blockchain markets.

For Ethereum, Hyperledger Fabric, R3 Corda, Rootstock (RSK), Cardano, and other smart contract platforms, these sources were used to gather transaction volume statistics, regulatory approval data, blockchain security studies, enterprise adoption trends, and market landscape analysis for Ethereum, Hyperledger Fabric, R3 Corda, Rootstock (RSK), Cardano, and other smart contract platforms.


Primary Research

In order to gather both qualitative and quantitative insights, supply-side and demand-side stakeholders were interviewed during the primary research process. CEOs, VPs of Product Development, blockchain architects, and commercial directors from Web3 startups, blockchain infrastructure firms, and providers of smart contract platforms were examples of supply-side sources. Chief Technology Officers (CTOs), Chief Information Officers (CIOs), blockchain leads, procurement heads from banking and financial institutions, insurance companies, supply chain companies, healthcare organizations, real estate firms, and government agencies investigating blockchain implementations were examples of demand-side sources. Market segmentation, confirmed protocol development schedules, corporate adoption trends, integration tactics, and regulatory compliance dynamics were all confirmed by primary research.

Primary Respondent Breakdown:

By Designation: C-level Primaries (32%), Director Level (31%), Others (37%)

By Region: North America (32%), Europe (30%), Asia-Pacific (28%), Rest of World (10%)


Market Size Estimation

Revenue mapping and transaction volume analysis were used to determine the global market valuation. The methodology comprised:

Finding more than fifty-five major smart contract platforms and blockchain infrastructure suppliers across North America, Europe, Asia-Pacific, and the Middle East;

Product mapping products across Ethereum, Hyperledger Fabric, R3 Corda, Rootstock (RSK), Cardano, Tezos, EOS, and other blockchain platforms Examination of reported and projected yearly income related to enterprise license, protocol fees, and smart contract services

Analysis of reported and modeled annual revenues specific to smart contract services, protocol fees, and enterprise licensing

Coverage of platform providers that will account for 75–80% of the worldwide market share in 2024

Extrapolation of segment-specific valuations utilizing top-down (platform provider revenue validation) and bottom-up (transaction volume × average gas fees/protocol fees by network) methods

Download Free Sample

Kindly complete the form below to receive a free sample of this Report

Download PDF ×

We do not share your information with anyone. However, we may send you emails based on your report interest from time to time. You may contact us at any time to opt-out.
















