Smart Office Market (2026 - 2035)

Smart Office Market Size, Share and Research Report: By Technology (Internet of Things, Artificial Intelligence, Cloud Computing, Big Data, Automation), By Smart Office Solutions (Smart Lighting, Smart Thermostats, Smart Security Systems, Collaboration Tools, Room Scheduling Systems), By End User (Corporate Offices, SMEs, Educational Institutions, Government Offices, Healthcare Facilities), By Deployment Type (On-Premises, Cloud-Based, Hybrid) and By Regional (North America, Europe, South America, Asia Pacific, Middle East and Africa) - Industry Forecast Till 2035
ID: MRFR/SEM/5113-HCR
100 Pages
Ankit Gupta, Shubham Munde
Last Updated: July 14, 2026
Smart Office Market
Market Size
Forecast Period2026-2035
CAGR (2026-2035)12.5%
2025 Market SizeUSD 62.75 Billion
2035 Market SizeUSD 203.78 Billion
Key Players
Siemens AG
Honeywell International
Johnson Controls International
Schneider Electric
Cisco Systems
ABB Ltd.
Opportunities
  • Retrofit-as-a-Service Financing Models
  • Private 5G Campus Networks
  • Emerging-Market Smart-City Mandates

Smart Office Market Summary

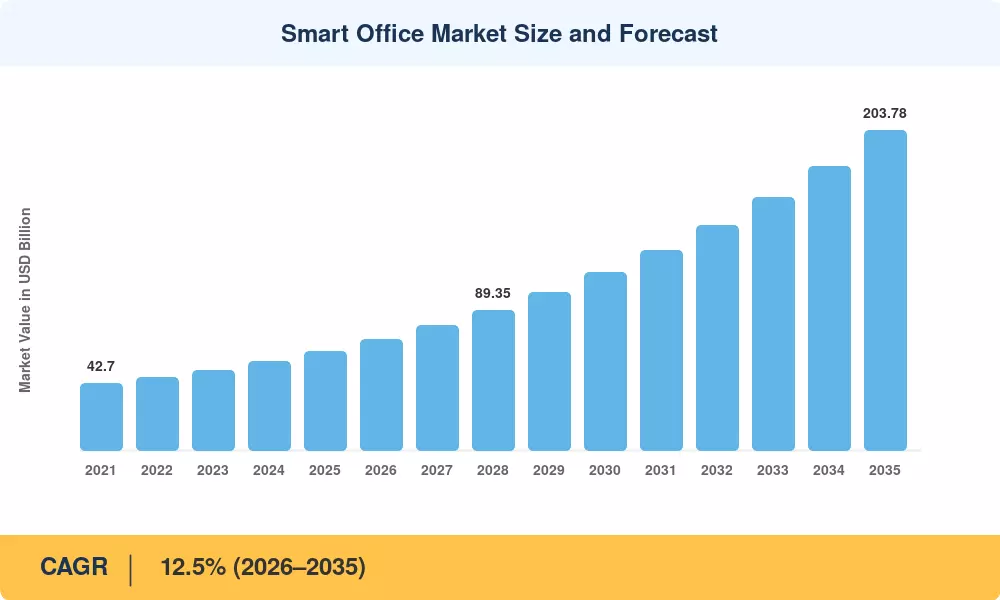
The Smart Office Market was valued at USD 62.75 billion in 2025 and is projected to reach USD 70.60 billion in 2026, climbing to USD 203.78 billion by 2035 at a CAGR of 12.5% during the 2026–2035 forecast window. Two forces are pulling capital into this space at an accelerating rate: the European Union's recast Energy Performance of Buildings Directive (EPBD 2024/1275), which mandates zero-emission standards for commercial properties by 2030, and the permanent entrenchment of hybrid work across corporate real estate portfolios worldwide [1]. Together, these catalysts have converted what was once a discretionary technology upgrade into a compliance-driven imperative.

Legacy building-management systems—proprietary, hardware-locked, and siloed—are rapidly giving way to modular, software-defined architectures. Landlords in California, Singapore, and South Korea are retrofitting assets with connected HVAC controls, demand-responsive lighting, and cloud-based occupancy platforms to meet tightening fault-detection and emission standards. Global corporate real-estate spending on intelligent workspace technology exceeded USD 18 billion in 2024, according to JLL estimates, signaling a permanent shift from static fit-outs to sensor-rich, analytics-driven environments [2].

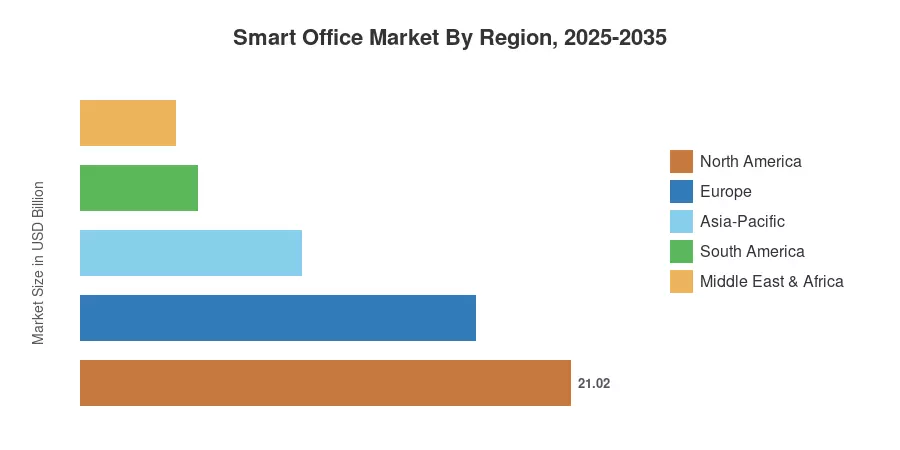
North America leads the Smart Office Market with roughly 33.5% of 2025 revenue, underpinned by early adoption cycles across Fortune 500 headquarters and coworking operators. Asia-Pacific represents the fastest-growing region at a projected 15.1% CAGR through 2035, fueled by smart-city mandates in China, India, and South Korea. Europe holds the second-largest share at approximately 27%, driven by stringent EU carbon-neutrality targets. As sensor costs continue to decline and 5G connectivity matures, the Smart Office Market is set for sustained double-digit expansion through the mid-2030s.

Key Report Takeaways

• By Product

  • Energy Management Systems commanded 26.5% of 2025 Smart Office Market revenue, reflecting the priority organizations place on reducing operational energy costs across commercial portfolios.
  • Smart HVAC Control Systems are forecast to expand at a 15.4% CAGR through 2035, driven by real-time occupancy-based climate optimization and tightening emission thresholds.

• By Component

  • Hardware accounted for 42.3% of the Smart Office Market in 2025, encompassing sensors, controllers, gateways, and edge computing appliances.
  • Services are projected to grow at a 15.6% CAGR to 2035 as enterprises increasingly outsource integration, managed operations, and ongoing analytics.

• By Building Type

  • Retrofits represented 68.2% of the 2025 value, as landlords prioritize upgrading legacy assets over new construction amid cost inflation.

• By Connectivity Technology

  • Wi-Fi contributed 36.4% of 2025 connectivity revenue, remaining the default protocol for mid-density office deployments.
  • Cellular (4G/5G) connectivity is projected to grow at a 16.3% CAGR through 2035 as private 5G networks gain traction in large campuses.

• By Region

  • North America accounted for 33.5% of the 2025 Smart Office Market revenue.
  • Asia-Pacific is forecast to post the fastest CAGR of 15.1% to 2035.


Market Size and Forecast (2021–2035)

Market Research Future derives historical estimates from a combination of public filings, customs-trade databases, and proprietary vendor surveys, while the forward projection applies a bottom-up model calibrated against macroeconomic indicators, policy timelines, and technology adoption curves.
Smart Office Market Size and Forecast
Our Impact
Enabled $4.3B Revenue Impact for Fortune 500 and Leading Multinationals
Partnering with 2000+ Global Organizations Each Year
30K+ Citations by Top-Tier Firms in the Industry

Driver Impact Analysis

Driver ~% Impact on CAGR Geographic Relevance Impact Timeline
Permanent hybrid work adoption ~2.5% Global Short-term (≤2 yr)
Energy-performance regulatory mandates ~2.2% Europe, North America Medium-term (2–4 yr)
Falling IoT sensor and edge-compute costs ~1.8% Global Short-term (≤2 yr)
5G/private-network campus connectivity ~1.5% North America, Asia-Pacific Medium-term (2–4 yr)
AI and machine-learning workspace analytics ~1.8% North America, Europe Long-term (≥4 yr)
ESG reporting and green-building certification ~1.4% Europe, Asia-Pacific Medium-term (2–4 yr)
Corporate real-estate portfolio optimization ~1.3% Global Long-term (≥4 yr)

Permanent Hybrid Work Adoption

Corporate occupancy rates in major US and European metro markets stabilized near 55–60% of pre-2020 levels through 2024, according to Kastle Systems badge-swipe data [2]. That structural under-utilization has forced facilities teams to deploy desk-booking engines, room-scheduling platforms, and occupancy-sensing hardware to right-size their footprints. JLL estimates that companies adopting dynamic space management reduce per-seat costs by 20–25%, creating a self-funding business case for the Smart Office Market that persists regardless of macroeconomic cycles [2].

Energy-Performance Regulatory Mandates

The EU's EPBD recast requires all new commercial buildings to be zero-emission by 2028 and existing stock to reach minimum energy-performance class E by 2030 [1]. California's Title 24 2025 code update adds automated demand-response and fault-detection requirements for office buildings over 50,000 sq ft [7]. These mandates compel property owners to install connected BMS layers—creating a regulatory floor beneath the Smart Office Market's growth trajectory that insulates demand from discretionary budget cuts.

Falling IoT Sensor and Edge-Compute Costs

Average unit costs for commercial-grade occupancy sensors fell roughly 35% between 2021 and 2024, while edge-gateway compute capability doubled at comparable price points [4]. This cost curve follows a pattern similar to LED lighting a decade earlier—once payback periods drop below 18 months, adoption transitions from pilot to portfolio-wide rollout. BSRIA estimates the global installed base of commercial building IoT endpoints will exceed 3.5 billion by 2028, up from 1.8 billion in 2024 [4].

AI and Machine-Learning Workspace Analytics

Predictive algorithms that correlate badge data, calendar feeds, and environmental sensors can reduce HVAC runtime by 15–20% in partially occupied buildings [6]. Early adopters such as "The Edge" in Amsterdam and Salesforce Tower in San Francisco report energy-intensity reductions exceeding 30% after deploying AI-tuned control loops [6]. As these reference cases multiply, AI-driven optimization is shifting from a premium differentiator to table-stakes specification in the Smart Office Market.

Restraints Impact Analysis

Restraint ~% Drag on CAGR Geographic Relevance Impact Timeline
Data privacy and cybersecurity concerns ~–1.2% Europe, North America Short-term (≤2 yr)
Integration complexity with legacy BMS ~–1.0% Global Medium-term (2–4 yr)
High upfront retrofit capital expenditure ~–0.8% Emerging markets Medium-term (2–4 yr)
Fragmented protocol standards ~–0.6% Global Long-term (≥4 yr)
Skilled workforce shortage for system integration ~–0.5% Asia-Pacific, MEA Medium-term (2–4 yr)


Data Privacy and Cybersecurity Concerns

Granular occupancy tracking—badge swipes, desk sensors, video analytics—raises serious GDPR and CCPA compliance questions that slow procurement timelines by 6–12 months in regulated industries [12]. A 2024 Ponemon Institute study found that 42% of CISOs ranked smart-building IoT as a top-three attack-surface expansion risk, and the average breach cost for building-automation network intrusions reached USD 4.2 million [12]. Until vendors standardize zero-trust architectures at the edge, privacy friction will constrain adoption velocity in healthcare, financial services, and government verticals.

Integration Complexity with Legacy BMS

Commercial buildings over 15 years old often employ proprietary BACnet or Modbus control layers without native IP connectivity [13]. To connect legacy stacks to cloud-native smart-office platforms involves specialized middleware, protocol translators and longer commissioning expenditures that might add 30-40% to a retrofit budget. CABA studies show that integration of labor contributes to about half of the total project cost in buildings built before 2010, lowering ROI estimations for the Smart Office Market in older urban cores [13].


High Upfront Retrofit Capital Expenditure

In rising economies like India, Brazil, Southeast Asia, commercial landlords are paying 300-500 basis points more to borrow than their developed market counterparts, and this pushes the payback period for smart-office retrofits beyond acceptable levels [10]. Commercial mortgage rates in India averaged 9.5% in 2024, according to World Bank data, compared with 5.2% in the US, making deployment of the same sensor twice as expensive on a net-present-value basis [10].

Smart Office Market Opportunities

Retrofit-as-a-Service Financing Models

Third-party Energy Service Companies (ESCOs) and PropTech lenders are bundling sensor deployments, integration and analytics into managed subscriptions that remove the need for upfront cash. This finance innovation might unleash the 40% of global office stock that is currently too financially limited for standard refit approaches, enabling a USD 25+ billion addressable expansion for the Smart Office Market by 2030 [10].

Private 5G Campus Networks

Telecom companies, including Deutsche Telekom, NTT and Verizon, are experimenting private 5G slices for major corporate campuses. These dedicated networks offer ultra-reliable, low-latency connections for thousands of IoT endpoints – eliminating the bandwidth ceiling imposed by Wi-Fi on dense deployments and creating new Smart Office Market revenue sources in connectivity infrastructure and managed services [5].

Emerging-Market Smart-City Mandates

India's Smart Cities Mission (Phase 2) allocates USD 7.5 billion through 2028 for intelligent urban infrastructure, with commercial building automation as a priority pillar. Similarly, Saudi Arabia's NEOM and Egypt's New Administrative Capital projects embed smart-office specifications into their construction codes, providing greenfield demand in regions where the Smart Office Market currently holds single-digit penetration [10].

Occupancy Data Monetization and Workplace Analytics Platforms

Aggregated, anonymized occupancy data has value well beyond facilities management—landlords can license neighborhood foot-traffic patterns to retailers, and employers can benchmark space utilization against industry peers. Startups like VergeSense and Density have raised over USD 300 million combined to build analytics marketplaces, signaling investor confidence in data-driven business models adjacent to the Smart Office Market [6].

ESG Reporting and Green-Lease Alignment

The EU's Corporate Sustainability Reporting Directive (CSRD) now requires Scope 2 emissions disclosure for commercial real estate. Smart-office platforms that auto-generate audit-ready energy reports reduce compliance overhead and strengthen tenant-landlord green-lease negotiations—a dual incentive that positions the Smart Office Market at the intersection of regulatory compliance and competitive leasing strategy [7].


Smart Office Market Future Outlook

Autonomous Building Operations and AI Orchestration

By 2030, leading office portfolios will operate on closed-loop AI controllers that manage lighting, HVAC, access, and cleaning schedules without human intervention. estimates autonomous building management can reduce total operating expenses by 25–30% relative to manually supervised systems [6]. This shift will restructure Smart Office Market vendor positioning—software and analytics providers will capture a growing share of recurring revenue at the expense of hardware-centric players.

Platform Consolidation and Software-Defined Workspaces

The current vendor landscape—fragmented across point solutions for lighting, HVAC, access, and desk booking—is converging toward integrated platforms. Cisco, Microsoft, and Siemens have each acquired or built unified workspace platforms since 2023, and this consolidation trend will accelerate through 2028. The resulting "workspace-as-a-platform" model will shift procurement from capital-intensive hardware purchases to subscription-based software licensing, reshaping revenue composition across the Smart Office Market.

Electrification and Grid-Interactive Buildings

As commercial buildings increasingly participate in demand-response programs and behind-the-meter storage, smart-office platforms will evolve into grid-edge orchestration layers. The IEA projects that grid-interactive commercial buildings could reduce peak electricity demand by 10–15% in OECD markets by 2030 [17]. Smart-office systems that integrate EV charging, on-site solar, and battery dispatch will command premium pricing and open adjacent revenue streams.

ESG Data Infrastructure and Sustainability Reporting

The convergence of the EU's CSRD, the SEC's climate-disclosure rules, and IFRS S2 sustainability standards will make automated Scope 1 and Scope 2 emissions tracking a non-negotiable feature of office-building management [7]. Smart-office platforms that provide audit-grade energy-consumption data will become essential compliance infrastructure, creating a durable demand floor for the Smart Office Market that is decoupled from discretionary technology spending.


Smart Office Market Segmentation

By Product

The Smart Office Market product segmentation reflects the layered technology stack required to digitize commercial workspace operations.

Segment Key Metric Primary Demand Driver
Security and Access Control Systems USD 14.82 Billion (2025) Touchless entry, visitor management
Energy Management Systems 26.5% revenue share (2025) Regulatory compliance, operating-cost reduction
Smart HVAC Control Systems 15.4% CAGR (2026–2035) Occupancy-adaptive climate control
Other (Lighting, AV, Desk Booking) USD 11.30 Billion (2025) Hybrid-work space optimization


Energy Management Systems anchor the Smart Office Market product landscape because they deliver the most quantifiable ROI—typically 18–24 months payback via electricity savings. Demand-response integration and real-time sub-metering increasingly differentiate premium offerings from basic monitoring tools. Smart HVAC Control Systems represent the fastest-growing product category as buildings move from scheduled to occupancy-driven climate control, reducing energy waste in partially occupied post-pandemic offices by 20–30% [6].

By Component

The Smart Office Market component structure captures the hardware-to-services value progression.

Segment Key Metric Primary Demand Driver
Hardware 42.3% revenue share (2025) Sensor, controller, and gateway deployment
Software Platforms 13.8% CAGR (2026–2035) Cloud analytics, digital-twin integration
Services 15.6% CAGR (2026–2035) Managed operations, system integration


Hardware retains the largest share of the Smart Office Market because every deployment begins with physical sensor installation. However, the growth differential favors services and software, which together are expected to surpass hardware revenue share by 2032 as the installed base matures and landlords shift spending toward ongoing analytics and managed operations.

By Building Type

Segment Key Metric Primary Demand Driver
Retrofits 68.2% revenue share (2025) Regulatory deadlines on existing stock
New Buildings 14.2% CAGR (2026–2035) Integrated smart-spec construction


Retrofits dominate near-term spending because the global commercial building stock averages over 25 years in age, and regulatory mandates target existing assets first. New buildings carry higher per-square-foot smart-office intensity but represent a smaller volume base in the Smart Office Market through the early forecast period.

By Connectivity Technology

Segment Key Metric Primary Demand Driver
Wi-Fi 36.4% revenue share (2025) Ubiquitous coverage, low marginal cost
Bluetooth Low Energy USD 6.90 Billion (2025) Indoor positioning, asset tracking
Zigbee and Thread 12.0% CAGR (2026–2035) Low-power mesh for sensor networks
Wired Ethernet/PoE USD 7.25 Billion (2025) Deterministic latency, power delivery
Cellular (4G/5G) 16.3% CAGR (2026–2035) Private 5G campus deployments


Wi-Fi remains the default connectivity backbone for the Smart Office Market, but its dominance is eroding as enterprises deploy private 5G slices that offer dedicated bandwidth, sub-10ms latency, and deterministic quality-of-service for mission-critical building controls [5].


Regional Market Share Analysis

Region Key Metric (2025) Primary Investment Themes
North America 33.5% revenue share Hybrid-work optimization, HVAC decarbonization
Europe 27.0% revenue share EPBD compliance, green-building certification
Asia-Pacific 15.1% CAGR (2026–2035) Smart-city programs, new-build specification
South America USD 5.02 Billion Coworking expansion, Class-A office modernization
Middle East & Africa USD 4.08 Billion Mega-project construction, Vision 2030 mandates
Total USD 62.75 Billion

The Smart Office Market exhibits a clear developed-economy lead, though growth momentum is rotating toward Asia-Pacific and select Middle Eastern markets as smart-city policies and new construction pipelines accelerate.


North America

Country Key Metric Key Driver
United States 74.2% of regional share Fortune 500 hybrid-work rollout
Canada 14.8% of regional share Federal carbon-pricing compliance
Mexico 11.0% of regional share Nearshoring office construction boom


US corporate occupancy strategies are the single largest demand engine for the Smart Office Market in North America. Title 24 updates in California and New York's Local Law 97—which penalizes buildings exceeding carbon-intensity thresholds from 2024 onward—have made sensor-driven energy management a compliance necessity rather than a discretionary upgrade [7]. Canada's federal carbon-pricing escalation to CAD 170 per tonne by 2030 reinforces the business case for intelligent HVAC and lighting controls across the country's 450 million sq ft of Class-A office stock [16].

Europe

Country Key Metric Key Driver
Germany 13.6% CAGR (2026–2035) Building Energy Act (GEG) enforcement
United Kingdom USD 4.15 Billion (2025) Net-zero government estate mandate
France 12.8% CAGR (2026–2035) Décret tertiaire energy-reduction targets
Italy USD 1.82 Billion (2025) Superbonus retrofit incentives
Spain 13.1% CAGR (2026–2035) PNIEC clean-energy plan
Nordic Countries USD 1.55 Billion (2025) Advanced digital infrastructure base
Russia 10.8% CAGR (2026–2035) State digitization programs
Rest of Europe USD 2.42 Billion (2025) EU cohesion fund allocations


The EPBD recast positions Europe as the most regulation-intensive region for the Smart Office Market through 2035. Germany's Building Energy Act requires all commercial properties to integrate automated fault-detection and demand-response systems by 2027, while France's Décret tertiaire mandates a 40% reduction in commercial building energy consumption by 2030 relative to a 2010 baseline [1]. These binding targets convert the entire European office stock into a captive retrofit market.

Asia-Pacific

Country Key Metric Key Driver
China 32.5% of regional share National "dual carbon" policy
India 16.2% CAGR (2026–2035) Smart Cities Mission Phase 2
Japan USD 2.85 Billion (2025) Society 5.0 workplace digitization
South Korea 15.5% CAGR (2026–2035) K-Green New Deal office retrofits
ASEAN USD 1.90 Billion (2025) Commercial construction pipeline
Rest of Asia-Pacific 13.8% CAGR (2026–2035) Urbanization and FDI inflows


Asia-Pacific's growth trajectory in the Smart Office Market reflects a combination of government-led smart-city mandates and an enormous base of new commercial construction. China's "dual carbon" commitment—peak emissions by 2030, carbon neutrality by 2060—has triggered provincial-level building-automation codes that affect over 2 billion sq m of commercial floor area [8]. India's Phase 2 Smart Cities Mission, with USD 7.5 billion in allocated funding, explicitly prioritizes intelligent building-management systems in its 100-city implementation framework [10].

South America

Country Key Metric Key Driver
Brazil 58.0% of regional share São Paulo/Rio Class-A office modernization
Argentina 13.5% CAGR (2026–2035) Buenos Aires coworking expansion
Rest of South America USD 1.12 Billion (2025) Chile and Colombia digital-economy programs


Brazil dominates the South American Smart Office Market, where São Paulo's Faria Lima financial corridor and Rio's Porto Maravilha redevelopment are driving landlords to install connected-building platforms as a competitive differentiator for multinational tenants seeking consistent global workplace standards [10].

Middle East & Africa

Country Key Metric Key Driver
Saudi Arabia 34.0% of regional share Vision 2030 mega-projects (NEOM, The Line)
UAE 28.5% of regional share Dubai Smart City 2030 strategy
South Africa 12.2% CAGR (2026–2035) Johannesburg/Cape Town commercial digitization
Egypt 11.8% CAGR (2026–2035) New Administrative Capital smart-building codes
Rest of MEA USD 0.68 Billion (2025) African Development Bank urban programs


The Middle East's Smart Office Market is propelled by sovereign-wealth-funded mega-projects that specify intelligent building systems from the design stage. NEOM's specifications require full sensor integration, AI-managed HVAC, and zero-carbon office operations across its 170-km linear development [10]. In Africa, South Africa and Egypt lead adoption as developers embed connected-building specifications into new commercial districts to attract foreign corporate tenants.


Smart Office Market By Region, 2025-2035

Competitive Benchmarking

The Smart Office Market exhibits medium concentration, with the top five players holding an estimated 28–35% combined revenue share. The Herfindahl-Hirschman Index sits in the moderate range (~600–800), reflecting a mix of building-automation incumbents, networking giants, and specialist software firms competing across overlapping solution layers.

Company Est. Revenue Share Range Key Offerings Strategic Positioning
Siemens AG ~7–10% Desigo CC platform, Comfy workplace app Full-stack BMS-to-app integration
Honeywell International ~6–9% Forge platform, connected buildings suite Cloud-native analytics leader
Johnson Controls International ~5–8% OpenBlue platform, Metasys BAS Large-campus retrofit specialist
Schneider Electric ~4–7% EcoStruxure Building, SpaceLogic Energy management and sustainability
Cisco Systems ~4–6% Meraki smart spaces, Webex devices Network-centric workspace convergence
ABB Ltd. ~3–5% ABB Ability platform, KNX controls Electrification and building automation
Signify (Philips Lighting) ~3–5% Interact Office, Li-Fi connectivity Lighting-as-a-platform strategy
Crestron Electronics ~2–4% Crestron Flex, XiO Cloud AV/UC meeting-room automation
Lutron Electronics ~2–4% Vive wireless, Ketra tunable lighting Lighting control and shading
IBM Corporation ~2–4% TRIRIGA, Maximo for buildings AI-driven facility management

Recent News & Developments

  • Siemens AG (July 2022 ): Acquired Brightly Software for USD 1.6 billion to add cloud-based asset-management capabilities to its Desigo smart-building platform, strengthening its end-to-end Smart Office Market positioning.
  • European Commission (June 2024): Published the EPBD recast implementing regulation, setting binding zero-emission new-building deadlines for 2028 and retrofit efficiency floors for 2030, creating multi-billion-dollar compliance demand across the Smart Office Market [1].
  • Johnson Controls (December 2020.): Partnered with Microsoft to integrate OpenBlue with Azure Digital Twins, enabling real-time digital replicas of building operations for predictive maintenance [11].

Smart Office Market Report Scope

Parameter Detail
Market Scope Smart Office Market encompassing connected systems for commercial workplace automation
Study Period 2021–2035
CAGR (Forecast Window) 12.5% (2026–2035)
Market Size (2025 Base Year) USD 62.75 Billion
Market Size (2035 Forecast) USD 203.78 Billion
Fastest Growing Segments Services (component), Cellular 4G/5G (connectivity), Smart HVAC Control Systems (product)
Companies Profiled Siemens, Honeywell, Johnson Controls, Schneider Electric, Cisco, ABB, Signify, Crestron, Lutron, IBM
Valuation Currency USD Billion


FAQs

What payback period should enterprises expect from a full smart-office retrofit?
Most mid-sized commercial retrofits achieve payback within 24–36 months through energy savings and space-utilization gains [6]. Retrofit-as-a-service models can eliminate upfront capital entirely by converting costs into monthly operating expenses.
How does the Smart Office Market address vendor lock-in risk across building-automation platforms?
Open protocols like BACnet/IP and Matter reduce switching costs significantly. Buyers should mandate API-level interoperability in procurement contracts to preserve future flexibility [14].
Which connectivity protocol is most cost-effective for offices exceeding 500 endpoints?
Wi-Fi suits coverage, but private 5G handles density and deterministic latency better at scale [5]. A hybrid approach—Wi-Fi for general use, 5G for critical controls—balances cost and performance.
How do digital twins improve Smart Office Market ROI for large campus operators?
Digital twins simulate operational changes before physical implementation, cutting commissioning time by up to 40% [11]. They also enable predictive maintenance that reduces unplanned downtime.
What cybersecurity framework best protects connected office infrastructure?
NIST CSF 2.0 and IEC 62443 provide layered defenses purpose-built for operational-technology environments [12]. Zero-trust network segmentation at the edge is becoming a baseline procurement requirement.
How does the Smart Office Market support Scope 2 emissions reporting under CSRD?
Smart-office platforms auto-aggregate energy data from sub-meters and BMS feeds into audit-ready formats [7]. This eliminates manual data collection that previously delayed and error-prone reporting.
What role do coworking operators play in driving Smart Office Market adoption?
Flexible-space operators like WeWork and IWG deploy sensor-dense environments to optimize per-seat economics [2]. Their technology specifications increasingly set the benchmark for traditional landlords.    
Author
Author
Author Profile
Ankit Gupta LinkedIn
Team Lead - Research
Ankit Gupta is a seasoned market intelligence and strategic research professional with over six plus years of experience in the ICT and Semiconductor industries. With academic roots in Telecom, Marketing, and Electronics, he blends technical insight with business strategy. Ankit has led 200+ projects, including work for Fortune 500 clients like Microsoft and Rio Tinto, covering market sizing, tech forecasting, and go-to-market strategies. Known for bridging engineering and enterprise decision-making, his insights support growth, innovation, and investment planning across diverse technology markets.
Co-Author
Co-Author Profile
Shubham Munde LinkedIn
Team Lead - Research
Shubham brings over 7 years of expertise in Market Intelligence and Strategic Consulting, with a strong focus on the Automotive, Aerospace, and Defense sectors. Backed by a solid foundation in semiconductors, electronics, and software, he has successfully delivered high-impact syndicated and custom research on a global scale. His core strengths include market sizing, forecasting, competitive intelligence, consumer insights, and supply chain mapping. Widely recognized for developing scalable growth strategies, Shubham empowers clients to navigate complex markets and achieve a lasting competitive edge. Trusted by start-ups and Fortune 500 companies alike, he consistently converts challenges into strategic opportunities that drive sustainable growth.

Research Approach


Secondary Research

The secondary research process involved comprehensive analysis of regulatory databases, building standards publications, IoT infrastructure reports, and authoritative facility management sources. Key sources included the US General Services Administration (GSA) Smart Buildings Program, US Department of Energy (DOE) Building Technologies Office, National Institute of Standards and Technology (NIST) Cybersecurity for IoT Program, Environmental Protection Agency (EPA) ENERGY STAR Commercial Buildings Data, International Energy Agency (IEA) Energy Efficiency Indicators, European Commission Energy Performance of Buildings Directive (EPBD) Database, Eurostat Building Stock Statistics, OECD Infrastructure Investment Statistics, and National Bureau of Statistics of China (Smart City & Building Data). Industry-specific sources included the International Facility Management Association (IFMA), Building Owners and Managers Association (BOMA), American Society of Heating, Refrigerating and Air-Conditioning Engineers (ASHRAE), Continental Automated Buildings Association (CABA), Smart Buildings Alliance (SBA), US Green Building Council (USGBC) LEED Project Database, Building Research Establishment (BRE) BREEAM Standards, and Institute of Electrical and Electronics Engineers (IEEE) Standards Association (IoT & Building Automation).

These sources were employed to compile data on the adoption rates of building automation, energy efficiency regulations, IoT deployment statistics, smart building investment flows, and compliance standards for lighting controls, HVAC systems, access control, and energy management platforms.


Primary Research

Qualitative and quantitative insights were obtained by interviewing supply-side and demand-side stakeholders during the primary research process. The supply-side sources consist of CEOs, VPs of IoT & Building Automation, Chief Technology Officers, Heads of Product Development for Smart Building Solutions, and Commercial Directors from integrated building management system (BMS) manufacturers, smart lighting OEMs, HVAC control providers, physical security solution vendors, and audiovisual conferencing technology companies. Chief Facility Officers, Corporate Real Estate Directors, VP of Workplace Experience, Chief Information Officers (CIOs) from IT & Telecom and BFSI sectors, Healthcare Facility Managers, Smart Building Consultants, and Procurement Heads from commercial property developers, enterprise occupiers, and facility management service providers comprised demand-side sources. The primary research validated market segmentation across hardware components (sensors, controllers, actuators) and software platforms, confirmed IoT integration roadmaps, and gathered insights on retrofit vs. new construction adoption patterns, energy-as-a-service business models, and cybersecurity implementation in connected office environments.

Primary Respondent Breakdown:

• By Designation: C-level Primaries (40%), Director Level (22%), Others (38%)

• By Region: North America (33%), Europe (29%), Asia-Pacific (31%), Rest of World (7%)


Market Size Estimation

Revenue mapping and deployment volume analysis were employed to determine the global market valuation of commercial real estate. The methodology comprised the following:

• The identification of over 50 key technology providers and system integrators in North America, Europe, Asia-Pacific, and the Middle East and Africa

• Product mapping for smart lighting and controls, security and access control systems, energy management systems, HVAC control systems, audio-video conferencing systems, and fire and safety systems

• Analysis of component-level segmentation with a focus on hardware (sensors, HVAC controllers, lighting ballasts, surveillance equipment), software (building management platforms, IoT analytics, workplace applications), and services (integration, managed services, consulting)

• Analysis of building types to differentiate between retrofit installations (existing building automation enhancements) and new construction (smart-ready infrastructure)

• Examination of annual revenues that are reported and modeled for commercial building automation divisions and smart office portfolios

• Manufacturers and service providers that account for 75-80% of the global market share in 2024 are included.

• Segment-specific valuations for intelligent workplace solutions are derived through extrapolation using bottom-up (smart device deployment volume × ASP by country/region) and top-down (vendor revenue validation and real estate investment flow analysis) approaches.

Download Free Sample

Kindly complete the form below to receive a free sample of this Report

Download PDF ×

We do not share your information with anyone. However, we may send you emails based on your report interest from time to time. You may contact us at any time to opt-out.
















