×
Hero Background
English
Chinese
French
Japanese
Korean
German
Spanish

Smart Stadium Market Analysis

ID: MRFR/SEM/1986-HCR
100 Pages
Aarti Dhapte
October 2025

Smart Stadium Market Research Report Information By Component (Software and Service), By Deployment Type (On-Premise and Software-as-a-Service), By Platform (Application Management Platform, Device Management Platform, and Network Management Platform), And By Region (North America, Europe, Asia-Pacific, And Rest Of The World) – Industry Forecast Till 2035

Share:
Download PDF ×

We do not share your information with anyone. However, we may send you emails based on your report interest from time to time. You may contact us at any time to opt-out.

Smart Stadium Market Infographic
Purchase Options

Market Analysis

In-depth Analysis of Smart Stadium Market Industry Landscape

The Smart Stadium market has undergone substantial growth, driven by the intersection of sports and technology to enhance the overall fan experience. The market dynamics are shaped by a convergence of factors that leverage cutting-edge technologies to transform traditional sports venues into interconnected and immersive entertainment hubs. One of the primary drivers behind the rise of the Smart Stadium market is the increasing demand for enhanced fan engagement. With the integration of technologies like Wi-Fi, Bluetooth, and mobile apps, smart stadiums provide spectators with interactive and personalized experiences, such as real-time statistics, instant replays, and in-seat food ordering, elevating the overall enjoyment of live events.

Furthermore, the advent of the Internet of Things (IoT) and data analytics has significantly contributed to the market dynamics of smart stadiums. Sensors and connected devices throughout the venue collect and analyze data, offering insights into crowd behavior, traffic flow, and facility utilization. This data-driven approach allows stadium operators to optimize operations, improve safety, and enhance the overall fan experience. From efficient parking management to personalized promotions, smart stadiums leverage data to create a seamless and enjoyable event environment.

The demand for increased operational efficiency and sustainability has also influenced the growth of the Smart Stadium market. Smart technologies enable stadiums to implement energy-efficient solutions, such as smart lighting, heating, ventilation, and air conditioning (HVAC) systems. Additionally, waste management and water conservation initiatives contribute to the overall sustainability goals of modern sports venues. As environmental consciousness grows, stadiums are adopting smart solutions not only to improve the fan experience but also to align with global sustainability trends.

Moreover, the integration of artificial intelligence (AI) and augmented reality (AR) has played a crucial role in shaping the market dynamics of smart stadiums. AI-powered chatbots assist fans with queries and provide real-time information, while AR enhances the in-stadium experience through interactive overlays, virtual mascots, and immersive displays. These technologies not only entertain spectators but also open new avenues for sponsorship and advertising opportunities, further monetizing the smart stadium ecosystem.

However, challenges such as high implementation costs and the need for robust cybersecurity measures pose considerations for stadium operators. The initial investment required for deploying smart technologies can be significant, particularly for existing stadiums looking to retrofit their infrastructure. Balancing the upfront costs with the long-term benefits and revenue opportunities is a critical aspect of smart stadium development. Additionally, with the increasing connectivity and data-sharing within smart stadiums, cybersecurity becomes a paramount concern. Safeguarding fan data, financial transactions, and critical infrastructure from cyber threats is essential for maintaining trust and ensuring the secure operation of smart stadium systems.

Author
Aarti Dhapte
Team Lead - Research

She holds an experience of about 6+ years in Market Research and Business Consulting, working under the spectrum of Information Communication Technology, Telecommunications and Semiconductor domains. Aarti conceptualizes and implements a scalable business strategy and provides strategic leadership to the clients. Her expertise lies in market estimation, competitive intelligence, pipeline analysis, customer assessment, etc.

Leave a Comment

FAQs

What is the projected market valuation of the Smart Stadium Market by 2035?

The Smart Stadium Market is projected to reach a valuation of 85.51 USD Billion by 2035.

What was the market valuation of the Smart Stadium Market in 2024?

In 2024, the Smart Stadium Market had a valuation of 8.77 USD Billion.

What is the expected CAGR for the Smart Stadium Market during the forecast period 2025 - 2035?

The expected CAGR for the Smart Stadium Market during the forecast period 2025 - 2035 is 23.0%.

Which companies are considered key players in the Smart Stadium Market?

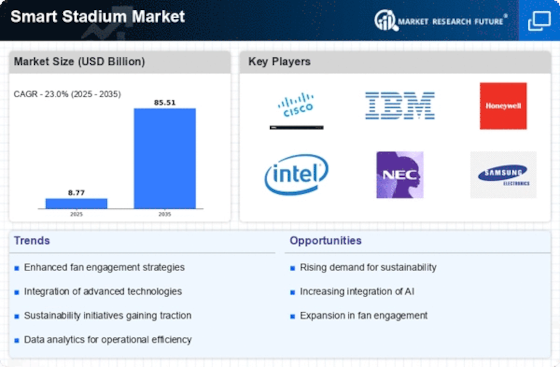
Key players in the Smart Stadium Market include Cisco Systems, IBM, Honeywell, Intel Corporation, NEC Corporation, Samsung Electronics, Siemens AG, Verizon Communications, and LG Electronics.

What are the main components of the Smart Stadium Market?

The main components of the Smart Stadium Market include Software, valued at 3.51 USD Billion, and Services, valued at 5.26 USD Billion.

How is the Smart Stadium Market segmented by deployment type?

The Smart Stadium Market is segmented by deployment type into On-Premise, valued at 3.51 USD Billion, and Software-as-a-Service, valued at 5.26 USD Billion.

Market Summary

As per MRFR analysis, the Smart Stadium Market Size was estimated at 8.77 USD Billion in 2024. The Smart Stadium industry is projected to grow from 10.79 USD Billion in 2025 to 85.51 USD Billion by 2035, exhibiting a compound annual growth rate (CAGR) of 23.0 during the forecast period 2025 - 2035.

Key Market Trends & Highlights

The Smart Stadium Market is poised for substantial growth driven by technological advancements and evolving consumer preferences.

  • Enhanced fan engagement through immersive experiences is becoming a focal point in stadium design.
  • Sustainability initiatives are increasingly influencing the development of smart stadiums, particularly in North America.
  • Data-driven decision making is gaining traction, with software solutions leading the market in terms of revenue.
  • Technological advancements and a growing demand for sustainable practices are key drivers propelling the market forward.

Market Size & Forecast

2024 Market Size 8.77 (USD Billion)
2035 Market Size 85.51 (USD Billion)
CAGR (2025 - 2035) 23.0%
Largest Regional Market Share in 2024 Europe

Major Players

<p>Cisco Systems (US), IBM (US), Honeywell (US), Intel Corporation (US), NEC Corporation (JP), Samsung Electronics (KR), Siemens AG (DE), Verizon Communications (US), LG Electronics (KR)</p>

Market Trends

The Smart Stadium Market is currently experiencing a transformative phase, driven by advancements in technology and the increasing demand for enhanced fan experiences. Stadiums are evolving into interconnected environments, where digital solutions facilitate seamless interactions between fans, teams, and venue management. This shift is characterized by the integration of smart technologies, such as IoT devices, mobile applications, and data analytics, which collectively aim to improve operational efficiency and elevate spectator engagement. As a result, stakeholders are increasingly investing in infrastructure that supports these innovations, indicating a robust growth trajectory for the market. Moreover, sustainability has emerged as a pivotal consideration within the Smart Stadium Market. Stakeholders are recognizing the importance of eco-friendly practices, which not only contribute to environmental conservation but also resonate with the values of modern consumers. This trend is prompting the adoption of energy-efficient systems, waste management solutions, and sustainable materials in stadium construction and operation. Consequently, the Smart Stadium Market appears poised for continued expansion, as it aligns with broader societal shifts towards sustainability and technological integration.

Enhanced Fan Engagement

The Smart Stadium Market is witnessing a notable trend towards enhanced fan engagement through the use of mobile applications and interactive technologies. These tools allow spectators to access real-time information, participate in polls, and enjoy personalized experiences, thereby fostering a deeper connection with the event.

Sustainability Initiatives

Sustainability initiatives are gaining traction within the Smart Stadium Market, as venues increasingly adopt eco-friendly practices. This includes the implementation of energy-efficient systems and waste reduction strategies, reflecting a growing commitment to environmental responsibility among stakeholders.

Data-Driven Decision Making

Data-driven decision making is becoming a cornerstone of operations in the Smart Stadium Market. By leveraging analytics, stadium management can optimize resource allocation, enhance security measures, and improve overall operational efficiency, leading to a more streamlined experience for all stakeholders.

Smart Stadium Market Market Drivers

Technological Advancements

The Smart Stadium Market is experiencing a surge in technological advancements that enhance the overall spectator experience. Innovations such as augmented reality, high-speed Wi-Fi, and mobile applications are becoming integral to stadium operations. These technologies facilitate real-time engagement, allowing fans to access information, view instant replays, and interact with the venue in unprecedented ways. According to recent estimates, the integration of advanced technologies in stadiums is projected to increase operational efficiency by up to 30%. This trend not only improves fan satisfaction but also drives revenue growth through enhanced advertising opportunities and merchandise sales. As a result, the Smart Stadium Market is likely to witness substantial investments in technology, further propelling its expansion.

Enhanced Data Analytics Capabilities

The Smart Stadium Market is increasingly leveraging data analytics to optimize operations and enhance the fan experience. By collecting and analyzing data from various sources, including ticket sales, social media interactions, and in-stadium behavior, operators can make informed decisions that drive engagement and revenue. The use of predictive analytics allows stadiums to anticipate fan needs, tailor marketing strategies, and improve service delivery. Market Research Future indicates that organizations utilizing advanced data analytics can achieve a revenue increase of up to 25%. This capability not only enhances operational efficiency but also fosters a more personalized experience for fans, making it a crucial driver in the Smart Stadium Market.

Increased Focus on Safety and Security

Safety and security concerns are paramount in the Smart Stadium Market, particularly in light of rising global threats. Stadiums are increasingly adopting advanced surveillance systems, crowd management technologies, and emergency response protocols to ensure the safety of attendees. The implementation of biometric screening and facial recognition systems is becoming more prevalent, enhancing security measures while streamlining entry processes. Market data suggests that investments in security technologies within stadiums are expected to grow significantly, with projections indicating a compound annual growth rate of over 10% in the coming years. This heightened focus on safety not only protects fans but also fosters a sense of trust and loyalty, which is essential for the long-term success of the Smart Stadium Market.

Growing Demand for Sustainable Practices

Sustainability is emerging as a critical driver in the Smart Stadium Market, as stakeholders increasingly prioritize eco-friendly practices. Stadiums are adopting green building standards, utilizing renewable energy sources, and implementing waste reduction strategies to minimize their environmental impact. The trend towards sustainability is not merely a response to regulatory pressures; it is also driven by fan expectations and corporate responsibility initiatives. Recent studies indicate that nearly 70% of fans prefer attending events at venues that demonstrate a commitment to sustainability. This shift is prompting stadium operators to invest in sustainable technologies, which could lead to a reduction in operational costs by up to 20%. Consequently, the Smart Stadium Market is likely to see a rise in the adoption of sustainable practices, aligning with broader environmental goals.

Rising Popularity of Esports and Virtual Events

The Smart Stadium Market is witnessing a notable shift with the rising popularity of esports and virtual events. As traditional sports venues adapt to accommodate esports tournaments, they are transforming into multifunctional spaces that cater to diverse audiences. This trend is driven by the increasing viewership and participation in esports, which has seen exponential growth in recent years. Stadiums are investing in state-of-the-art broadcasting technologies and immersive experiences to attract esports fans, thereby expanding their market reach. Data suggests that the esports market is projected to surpass 1 billion dollars in revenue, creating new opportunities for stadium operators. This evolution not only diversifies the offerings within the Smart Stadium Market but also positions venues as versatile hubs for entertainment.

Market Segment Insights

By Component: Software (Largest) vs. Service (Fastest-Growing)

<p>In the Smart Stadium Market, the component segmentation reveals that software holds the largest market share, driven by an increasing demand for advanced management systems and data analytics solutions. As stadiums increasingly adopt innovative technologies for enhanced spectator experiences, software solutions that facilitate crowd management, ticketing, and facility operations are becoming indispensable. On the other hand, the service segment is witnessing rapid growth as organizations look to leverage expert services for installation, maintenance, and support. This service sector supports the successful implementation of smart technologies and ensures optimal performance and user experience.</p>

<p>Software (Dominant) vs. Service (Emerging)</p>

<p>Software solutions dominate the Smart Stadium Market due to their ability to provide essential functionalities that significantly enhance the operational effectiveness of stadiums. Aspects such as real-time data analytics, enhanced security protocols, and comprehensive event management capabilities are pushing the demand for software higher. Conversely, the service segment, while emerging, is gaining attention as it encompasses critical offerings like consultancy and ongoing support that help stadiums integrate and optimize smart technology. This segment's emergence reflects a growing realization that expert services are vital for maximizing the potential of smart stadium initiatives, illustrating a dynamic interplay between software and service in shaping the future of smart venues.</p>

By Deployment Type: On-Premise (Largest) vs. Software-as-a-Service (Fastest-Growing)

<p>In the Smart Stadium Market, the deployment type segment showcases a distinct distribution of preferences among two primary models: On-Premise and Software-as-a-Service (SaaS). On-Premise solutions dominate the market due to their ability to offer higher security and customization tailored to the specific requirements of stadium operators. However, SaaS is rapidly gaining traction as organizations increasingly prioritize flexibility, lower upfront costs, and the convenience of remote access to systems for real-time data management and analysis. In terms of growth trends, the SaaS deployment model for smart stadiums is projected to outpace the On-Premise solution, primarily driven by technological advancements and the growing adoption of Internet of Things (IoT) applications in stadiums. Factors such as increasing consumer demand for enhanced experiences, coupled with the need for efficient management systems and analytics, are propelling the shift towards SaaS-based solutions. This trend reflects a broader evolution in how smart technologies are integrated into sports venues, pointing towards a future where agility and scalability are paramount.</p>

<p>Deployment Type: On-Premise (Dominant) vs. Software-as-a-Service (Emerging)</p>

<p>The On-Premise deployment type remains dominant in the Smart Stadium Market, favored for its robust security attributes and ability to handle sensitive data effectively. Stadiums with significant technical infrastructure tend to opt for this model, as it allows complete control over systems and data privacy. This segment also benefits from the customization options it provides, enabling tailored solutions specific to individual venue demands. Conversely, Software-as-a-Service is quickly emerging as a competitive force in the marketplace, appealing particularly to smaller organizations seeking cost-effective solutions without the burden of maintaining extensive hardware. SaaS-based offerings enable greater scalability and rapid deployment of functionalities, aligning with the broader industry trend of digital transformation in stadium management, making it an attractive option for modern sports venues.</p>

By Platform: Application Management Platform (Largest) vs. Device Management Platform (Fastest-Growing)

<p>The Smart Stadium Market exhibits a diverse portfolio in the platform segment, with the Application Management Platform commanding the largest share. This platform is instrumental in integrating various applications that enhance fan experiences and stadium operations. Conversely, the Device Management Platform, though currently smaller in comparison, is rapidly gaining traction due to increasing demand for real-time device monitoring and management, making it the fastest-growing segment within the market.</p>

<p>Application Management Platform (Dominant) vs. Network Management Platform (Emerging)</p>

<p>The Application Management Platform stands as the dominant force within the Smart Stadium Market, characterized by its ability to deliver seamless application integration across various stadium functions, improving efficiency and user experience. In contrast, the Network Management Platform is emerging as an essential component in the smart stadium ecosystem. With the rising adoption of IoT devices and advanced networking solutions, it is crucial for managing the vast array of interconnected systems. The Network Management Platform focuses on ensuring robust connectivity and security, securing its place as a key player in the evolving digital landscape of smart stadiums.</p>

Get more detailed insights about Smart Stadium Market Research Report- Global Forecast to 2035

Regional Insights

North America : Innovation and Technology Leader

North America is the largest market for smart stadiums, holding approximately 45% of the global share. The region's growth is driven by increasing investments in technology, enhanced fan experiences, and the integration of IoT solutions. Regulatory support for smart infrastructure and sustainability initiatives further catalyze market expansion. The demand for advanced analytics and real-time data is also on the rise, pushing stadiums to adopt smart technologies. The United States is the leading country in this sector, with significant contributions from major cities hosting large-scale events. Key players like Cisco Systems, IBM, and Honeywell are at the forefront, providing innovative solutions that enhance operational efficiency and fan engagement. The competitive landscape is robust, with ongoing collaborations and partnerships aimed at integrating cutting-edge technologies into stadium operations.

Europe : Emerging Market with Potential

Europe is witnessing a growing trend in smart stadium adoption, accounting for approximately 30% of the global market share. The region's growth is fueled by increasing consumer demand for enhanced experiences and the need for energy-efficient solutions. Regulatory frameworks promoting smart city initiatives and sustainability are significant catalysts for this market. Countries are investing in digital infrastructure to support smart technologies in stadiums, enhancing both operational efficiency and fan engagement. Leading countries in this market include the United Kingdom, Germany, and France, where major events drive the need for smart solutions. The competitive landscape features key players like Siemens AG and NEC Corporation, who are innovating to meet the demands of modern stadiums. Collaborations between technology providers and stadium operators are becoming common, ensuring that facilities are equipped with the latest advancements in smart technology.

Asia-Pacific : Rapid Growth and Adoption

Asia-Pacific is emerging as a significant player in the smart stadium market, holding around 20% of the global share. The region's rapid urbanization and increasing disposable income are driving demand for enhanced sports and entertainment experiences. Governments are actively promoting smart city initiatives, which include the development of smart stadiums as part of broader urban planning strategies. This regulatory support is crucial for the market's growth, as it encourages investment in advanced technologies. Countries like Japan, South Korea, and Australia are leading the charge in smart stadium development. Major events, such as the Olympics and World Cup, are catalysts for innovation and investment in this sector. Key players like Samsung Electronics and LG Electronics are heavily involved, providing cutting-edge solutions that enhance fan experiences and operational efficiency. The competitive landscape is dynamic, with a focus on integrating IoT and AI technologies into stadium operations.

Middle East and Africa : Emerging Powerhouse in Sports

The Middle East and Africa region is gradually emerging in the smart stadium market, holding about 5% of the global share. The growth is primarily driven by the increasing popularity of sports and entertainment events, coupled with significant investments in infrastructure. Governments are recognizing the potential of smart stadiums to enhance fan experiences and operational efficiency, leading to supportive regulatory frameworks. The region's focus on hosting international events is also a key driver for market growth. Countries like the United Arab Emirates and South Africa are at the forefront of this trend, with major developments underway to create state-of-the-art facilities. The competitive landscape includes local and international players, with companies like Honeywell and Siemens AG actively participating in the market. Collaborations between technology providers and stadium operators are essential for integrating smart solutions that meet the evolving demands of fans and event organizers.

.webp

Key Players and Competitive Insights

The Smart Stadium Market is currently characterized by a dynamic competitive landscape, driven by technological advancements and an increasing demand for enhanced fan experiences. Major players such as Cisco Systems (US), IBM (US), and Samsung Electronics (South Korea) are at the forefront, each adopting distinct strategies to solidify their market positions. Cisco Systems (US) focuses on integrating advanced networking solutions to enhance connectivity within stadiums, while IBM (US) emphasizes data analytics and AI to optimize operations and improve fan engagement. Samsung Electronics (South Korea) leverages its expertise in display technology to create immersive environments, thereby enhancing the overall spectator experience. Collectively, these strategies contribute to a competitive environment that prioritizes innovation and customer-centric solutions.

In terms of business tactics, companies are increasingly localizing manufacturing and optimizing supply chains to enhance operational efficiency. The Smart Stadium Market appears moderately fragmented, with a mix of established players and emerging startups. The collective influence of key players shapes market dynamics, as they engage in strategic partnerships and collaborations to expand their reach and capabilities.

In August 2025, Cisco Systems (US) announced a partnership with a leading sports league to implement its next-generation networking solutions across multiple stadiums. This strategic move is likely to enhance connectivity and data management, positioning Cisco as a leader in the digital transformation of sports venues. The partnership underscores the importance of robust infrastructure in delivering seamless fan experiences and operational efficiencies.

In September 2025, IBM (US) launched a new AI-driven analytics platform specifically designed for stadium operations. This platform aims to provide real-time insights into crowd management and resource allocation, which could significantly improve operational efficiency. By harnessing AI, IBM is not only enhancing the operational capabilities of stadiums but also reinforcing its position as a key player in the Smart Stadium Market.

In July 2025, Samsung Electronics (South Korea) unveiled a series of advanced display solutions tailored for sports venues, featuring enhanced resolution and interactivity. This launch is indicative of Samsung's commitment to innovation in fan engagement technologies. By providing cutting-edge visual experiences, Samsung is likely to attract more partnerships with stadium operators looking to elevate the spectator experience.

As of October 2025, current competitive trends in the Smart Stadium Market include a strong emphasis on digitalization, sustainability, and AI integration. Strategic alliances are increasingly shaping the landscape, as companies collaborate to leverage complementary strengths. Looking ahead, competitive differentiation is expected to evolve, with a shift from price-based competition to a focus on innovation, technology, and supply chain reliability. This transition suggests that companies that prioritize technological advancements and sustainable practices will likely emerge as leaders in the Smart Stadium Market.

.webp

Key Companies in the Smart Stadium Market market include

Industry Developments

JIG-SAW joined hands with Climatec in Major League Baseball (MLB) to bring Smart Stadium Market technology to the San Diego Padres in September 2023. In the same vein, Climatec will play a vital role in JIG-SAW’s IoT technology during the design, installation and service stages. The implementation of this technology is expected to lead to reduced operation as well as maintenance costs, longer lifespan for facilities and improved customer experience for fans.

Acrisure Stadium, which is home to the Pittsburgh Steelers, announced that Evolv Technology will be its official fan screening provider in March 2023.

In February 2023, Fujitsu and EintrachtTech GmbH's digital center teamed up for sustainable stadium management at Deutsche Bank Park. Mainova AG has already equipped the stadium with a sensor solution that checks information on the condition of green areas and training fields and sends over the LoRaWAN gateway. However, it is Fujitsu who will take advantage of this existing facility further minimizing water consumption where an AI platform predicts future usage trends. Besides, there are efforts aimed at ensuring smart queue management at fan stores within sports venues.

Schneider Electric acquired the AVEVA communication technology consulting company in January 2023. The two companies partner together in order to enable complete digitization of their client’s operations. They achieve significant benefits by reducing energy consumption or carbon dioxide emissions per unit of output. This cooperation speeds up customers’ way towards better efficiency side by side with sustainability.

During December 2022, Cisco Systems Inc. collaborated with WaitTime so realize real-time crowd management platform use at Etihad Stadium.

A multiyear global partnership between Real Madrid and Cisco Systems Inc was announced by them in November 2022 to develop Europe's first Wi-Fi 6 stadium network at Santiago Bernabéu Stadium. The objective is to make ground rank among the world’s most sophisticated stadiums ever used for any sports event.

March 2022 saw Cisco Systems Inc. signing a multiyear agreement with Real Madrid, whereby the company will install the biggest Wi-Fi 6 stadium network at Santiago Bernabéu Stadium, which will be one of the most advanced sporting venues when it comes to technology. For instance, this multipurpose stadium is going to have not fewer than 1200 Wi-Fi 6 access points that guarantee a faster and smooth experience for fans, unlike older versions.

.webp

Future Outlook

Smart Stadium Market Future Outlook

<p>The Smart Stadium Market is projected to grow at a 23.0% CAGR from 2024 to 2035, driven by advancements in technology, enhanced fan experiences, and operational efficiencies.</p>

New opportunities lie in:

  • <p>Integration of AI-driven analytics for real-time decision-making</p>
  • <p>Development of mobile applications for personalized fan engagement</p>
  • <p>Implementation of sustainable energy solutions for stadium operations</p>

<p>By 2035, the Smart Stadium Market is expected to be a pivotal sector, reflecting substantial growth and innovation.</p>

Market Segmentation

Smart Stadium Market Platform Outlook

  • Application Management Platform
  • Device Management Platform
  • Network Management Platform

Smart Stadium Market Component Outlook

  • Software
  • Service

Smart Stadium Market Deployment Type Outlook

  • On-Premise
  • Software-as-a-Service

Report Scope

MARKET SIZE 20248.77(USD Billion)
MARKET SIZE 202510.79(USD Billion)
MARKET SIZE 203585.51(USD Billion)
COMPOUND ANNUAL GROWTH RATE (CAGR)23.0% (2024 - 2035)
REPORT COVERAGERevenue Forecast, Competitive Landscape, Growth Factors, and Trends
BASE YEAR2024
Market Forecast Period2025 - 2035
Historical Data2019 - 2024
Market Forecast UnitsUSD Billion
Key Companies ProfiledMarket analysis in progress
Segments CoveredMarket segmentation analysis in progress
Key Market OpportunitiesIntegration of advanced technologies enhances fan engagement and operational efficiency in the Smart Stadium Market.
Key Market DynamicsTechnological advancements drive enhanced fan experiences, influencing competitive dynamics in the Smart Stadium Market.
Countries CoveredNorth America, Europe, APAC, South America, MEA

FAQs

What is the projected market valuation of the Smart Stadium Market by 2035?

The Smart Stadium Market is projected to reach a valuation of 85.51 USD Billion by 2035.

What was the market valuation of the Smart Stadium Market in 2024?

In 2024, the Smart Stadium Market had a valuation of 8.77 USD Billion.

What is the expected CAGR for the Smart Stadium Market during the forecast period 2025 - 2035?

The expected CAGR for the Smart Stadium Market during the forecast period 2025 - 2035 is 23.0%.

Which companies are considered key players in the Smart Stadium Market?

Key players in the Smart Stadium Market include Cisco Systems, IBM, Honeywell, Intel Corporation, NEC Corporation, Samsung Electronics, Siemens AG, Verizon Communications, and LG Electronics.

What are the main components of the Smart Stadium Market?

The main components of the Smart Stadium Market include Software, valued at 3.51 USD Billion, and Services, valued at 5.26 USD Billion.

How is the Smart Stadium Market segmented by deployment type?

The Smart Stadium Market is segmented by deployment type into On-Premise, valued at 3.51 USD Billion, and Software-as-a-Service, valued at 5.26 USD Billion.

  1. SECTION I: EXECUTIVE SUMMARY AND KEY HIGHLIGHTS
    1. EXECUTIVE SUMMARY
      1. Market Overview
      2. Key Findings
      3. Market Segmentation
      4. Competitive Landscape
      5. Challenges and Opportunities
      6. Future Outlook
  2. SECTION II: SCOPING, METHODOLOGY AND MARKET STRUCTURE
    1. MARKET INTRODUCTION
      1. Definition
      2. Scope of the study
    2. RESEARCH METHODOLOGY
      1. Overview
      2. Data Mining
      3. Secondary Research
      4. Primary Research
      5. Forecasting Model
      6. Market Size Estimation
      7. Data Triangulation
      8. Validation
  3. SECTION III: QUALITATIVE ANALYSIS
    1. MARKET DYNAMICS
      1. Overview
      2. Drivers
      3. Restraints
      4. Opportunities
    2. MARKET FACTOR ANALYSIS
      1. Value chain Analysis
      2. Porter's Five Forces Analysis
      3. COVID-19 Impact Analysis
  4. SECTION IV: QUANTITATIVE ANALYSIS
    1. Semiconductor & Electronics, BY Component (USD Billion)
      1. Software
      2. Service
    2. Semiconductor & Electronics, BY Deployment Type (USD Billion)
      1. On-Premise
      2. Software-as-a-Service
    3. Semiconductor & Electronics, BY Platform (USD Billion)
      1. Application Management Platform
      2. Device Management Platform
      3. Network Management Platform
    4. Semiconductor & Electronics, BY Region (USD Billion)
      1. North America
      2. Europe
      3. APAC
      4. South America
      5. MEA
  5. SECTION V: COMPETITIVE ANALYSIS
    1. Competitive Landscape
      1. Overview
      2. Competitive Analysis
      3. Market share Analysis
      4. Major Growth Strategy in the Semiconductor & Electronics
      5. Competitive Benchmarking
      6. Leading Players in Terms of Number of Developments in the Semiconductor & Electronics
      7. Key developments and growth strategies
      8. Major Players Financial Matrix
    2. Company Profiles
      1. Cisco Systems (US)
      2. IBM (US)
      3. Honeywell (US)
      4. Intel Corporation (US)
      5. NEC Corporation (JP)
      6. Samsung Electronics (KR)
      7. Siemens AG (DE)
      8. Verizon Communications (US)
      9. LG Electronics (KR)
    3. Appendix
      1. References
      2. Related Reports
  6. LIST OF FIGURES
    1. MARKET SYNOPSIS
    2. NORTH AMERICA MARKET ANALYSIS
    3. US MARKET ANALYSIS BY COMPONENT
    4. US MARKET ANALYSIS BY DEPLOYMENT TYPE
    5. US MARKET ANALYSIS BY PLATFORM
    6. CANADA MARKET ANALYSIS BY COMPONENT
    7. CANADA MARKET ANALYSIS BY DEPLOYMENT TYPE
    8. CANADA MARKET ANALYSIS BY PLATFORM
    9. EUROPE MARKET ANALYSIS
    10. GERMANY MARKET ANALYSIS BY COMPONENT
    11. GERMANY MARKET ANALYSIS BY DEPLOYMENT TYPE
    12. GERMANY MARKET ANALYSIS BY PLATFORM
    13. UK MARKET ANALYSIS BY COMPONENT
    14. UK MARKET ANALYSIS BY DEPLOYMENT TYPE
    15. UK MARKET ANALYSIS BY PLATFORM
    16. FRANCE MARKET ANALYSIS BY COMPONENT
    17. FRANCE MARKET ANALYSIS BY DEPLOYMENT TYPE
    18. FRANCE MARKET ANALYSIS BY PLATFORM
    19. RUSSIA MARKET ANALYSIS BY COMPONENT
    20. RUSSIA MARKET ANALYSIS BY DEPLOYMENT TYPE
    21. RUSSIA MARKET ANALYSIS BY PLATFORM
    22. ITALY MARKET ANALYSIS BY COMPONENT
    23. ITALY MARKET ANALYSIS BY DEPLOYMENT TYPE
    24. ITALY MARKET ANALYSIS BY PLATFORM
    25. SPAIN MARKET ANALYSIS BY COMPONENT
    26. SPAIN MARKET ANALYSIS BY DEPLOYMENT TYPE
    27. SPAIN MARKET ANALYSIS BY PLATFORM
    28. REST OF EUROPE MARKET ANALYSIS BY COMPONENT
    29. REST OF EUROPE MARKET ANALYSIS BY DEPLOYMENT TYPE
    30. REST OF EUROPE MARKET ANALYSIS BY PLATFORM
    31. APAC MARKET ANALYSIS
    32. CHINA MARKET ANALYSIS BY COMPONENT
    33. CHINA MARKET ANALYSIS BY DEPLOYMENT TYPE
    34. CHINA MARKET ANALYSIS BY PLATFORM
    35. INDIA MARKET ANALYSIS BY COMPONENT
    36. INDIA MARKET ANALYSIS BY DEPLOYMENT TYPE
    37. INDIA MARKET ANALYSIS BY PLATFORM
    38. JAPAN MARKET ANALYSIS BY COMPONENT
    39. JAPAN MARKET ANALYSIS BY DEPLOYMENT TYPE
    40. JAPAN MARKET ANALYSIS BY PLATFORM
    41. SOUTH KOREA MARKET ANALYSIS BY COMPONENT
    42. SOUTH KOREA MARKET ANALYSIS BY DEPLOYMENT TYPE
    43. SOUTH KOREA MARKET ANALYSIS BY PLATFORM
    44. MALAYSIA MARKET ANALYSIS BY COMPONENT
    45. MALAYSIA MARKET ANALYSIS BY DEPLOYMENT TYPE
    46. MALAYSIA MARKET ANALYSIS BY PLATFORM
    47. THAILAND MARKET ANALYSIS BY COMPONENT
    48. THAILAND MARKET ANALYSIS BY DEPLOYMENT TYPE
    49. THAILAND MARKET ANALYSIS BY PLATFORM
    50. INDONESIA MARKET ANALYSIS BY COMPONENT
    51. INDONESIA MARKET ANALYSIS BY DEPLOYMENT TYPE
    52. INDONESIA MARKET ANALYSIS BY PLATFORM
    53. REST OF APAC MARKET ANALYSIS BY COMPONENT
    54. REST OF APAC MARKET ANALYSIS BY DEPLOYMENT TYPE
    55. REST OF APAC MARKET ANALYSIS BY PLATFORM
    56. SOUTH AMERICA MARKET ANALYSIS
    57. BRAZIL MARKET ANALYSIS BY COMPONENT
    58. BRAZIL MARKET ANALYSIS BY DEPLOYMENT TYPE
    59. BRAZIL MARKET ANALYSIS BY PLATFORM
    60. MEXICO MARKET ANALYSIS BY COMPONENT
    61. MEXICO MARKET ANALYSIS BY DEPLOYMENT TYPE
    62. MEXICO MARKET ANALYSIS BY PLATFORM
    63. ARGENTINA MARKET ANALYSIS BY COMPONENT
    64. ARGENTINA MARKET ANALYSIS BY DEPLOYMENT TYPE
    65. ARGENTINA MARKET ANALYSIS BY PLATFORM
    66. REST OF SOUTH AMERICA MARKET ANALYSIS BY COMPONENT
    67. REST OF SOUTH AMERICA MARKET ANALYSIS BY DEPLOYMENT TYPE
    68. REST OF SOUTH AMERICA MARKET ANALYSIS BY PLATFORM
    69. MEA MARKET ANALYSIS
    70. GCC COUNTRIES MARKET ANALYSIS BY COMPONENT
    71. GCC COUNTRIES MARKET ANALYSIS BY DEPLOYMENT TYPE
    72. GCC COUNTRIES MARKET ANALYSIS BY PLATFORM
    73. SOUTH AFRICA MARKET ANALYSIS BY COMPONENT
    74. SOUTH AFRICA MARKET ANALYSIS BY DEPLOYMENT TYPE
    75. SOUTH AFRICA MARKET ANALYSIS BY PLATFORM
    76. REST OF MEA MARKET ANALYSIS BY COMPONENT
    77. REST OF MEA MARKET ANALYSIS BY DEPLOYMENT TYPE
    78. REST OF MEA MARKET ANALYSIS BY PLATFORM
    79. KEY BUYING CRITERIA OF SEMICONDUCTOR & ELECTRONICS
    80. RESEARCH PROCESS OF MRFR
    81. DRO ANALYSIS OF SEMICONDUCTOR & ELECTRONICS
    82. DRIVERS IMPACT ANALYSIS: SEMICONDUCTOR & ELECTRONICS
    83. RESTRAINTS IMPACT ANALYSIS: SEMICONDUCTOR & ELECTRONICS
    84. SUPPLY / VALUE CHAIN: SEMICONDUCTOR & ELECTRONICS
    85. SEMICONDUCTOR & ELECTRONICS, BY COMPONENT, 2024 (% SHARE)
    86. SEMICONDUCTOR & ELECTRONICS, BY COMPONENT, 2024 TO 2035 (USD Billion)
    87. SEMICONDUCTOR & ELECTRONICS, BY DEPLOYMENT TYPE, 2024 (% SHARE)
    88. SEMICONDUCTOR & ELECTRONICS, BY DEPLOYMENT TYPE, 2024 TO 2035 (USD Billion)
    89. SEMICONDUCTOR & ELECTRONICS, BY PLATFORM, 2024 (% SHARE)
    90. SEMICONDUCTOR & ELECTRONICS, BY PLATFORM, 2024 TO 2035 (USD Billion)
    91. BENCHMARKING OF MAJOR COMPETITORS
  7. LIST OF TABLES
    1. LIST OF ASSUMPTIONS
    2. North America MARKET SIZE ESTIMATES; FORECAST
      1. BY COMPONENT, 2025-2035 (USD Billion)
      2. BY DEPLOYMENT TYPE, 2025-2035 (USD Billion)
      3. BY PLATFORM, 2025-2035 (USD Billion)
    3. US MARKET SIZE ESTIMATES; FORECAST
      1. BY COMPONENT, 2025-2035 (USD Billion)
      2. BY DEPLOYMENT TYPE, 2025-2035 (USD Billion)
      3. BY PLATFORM, 2025-2035 (USD Billion)
    4. Canada MARKET SIZE ESTIMATES; FORECAST
      1. BY COMPONENT, 2025-2035 (USD Billion)
      2. BY DEPLOYMENT TYPE, 2025-2035 (USD Billion)
      3. BY PLATFORM, 2025-2035 (USD Billion)
    5. Europe MARKET SIZE ESTIMATES; FORECAST
      1. BY COMPONENT, 2025-2035 (USD Billion)
      2. BY DEPLOYMENT TYPE, 2025-2035 (USD Billion)
      3. BY PLATFORM, 2025-2035 (USD Billion)
    6. Germany MARKET SIZE ESTIMATES; FORECAST
      1. BY COMPONENT, 2025-2035 (USD Billion)
      2. BY DEPLOYMENT TYPE, 2025-2035 (USD Billion)
      3. BY PLATFORM, 2025-2035 (USD Billion)
    7. UK MARKET SIZE ESTIMATES; FORECAST
      1. BY COMPONENT, 2025-2035 (USD Billion)
      2. BY DEPLOYMENT TYPE, 2025-2035 (USD Billion)
      3. BY PLATFORM, 2025-2035 (USD Billion)
    8. France MARKET SIZE ESTIMATES; FORECAST
      1. BY COMPONENT, 2025-2035 (USD Billion)
      2. BY DEPLOYMENT TYPE, 2025-2035 (USD Billion)
      3. BY PLATFORM, 2025-2035 (USD Billion)
    9. Russia MARKET SIZE ESTIMATES; FORECAST
      1. BY COMPONENT, 2025-2035 (USD Billion)
      2. BY DEPLOYMENT TYPE, 2025-2035 (USD Billion)
      3. BY PLATFORM, 2025-2035 (USD Billion)
    10. Italy MARKET SIZE ESTIMATES; FORECAST
      1. BY COMPONENT, 2025-2035 (USD Billion)
      2. BY DEPLOYMENT TYPE, 2025-2035 (USD Billion)
      3. BY PLATFORM, 2025-2035 (USD Billion)
    11. Spain MARKET SIZE ESTIMATES; FORECAST
      1. BY COMPONENT, 2025-2035 (USD Billion)
      2. BY DEPLOYMENT TYPE, 2025-2035 (USD Billion)
      3. BY PLATFORM, 2025-2035 (USD Billion)
    12. Rest of Europe MARKET SIZE ESTIMATES; FORECAST
      1. BY COMPONENT, 2025-2035 (USD Billion)
      2. BY DEPLOYMENT TYPE, 2025-2035 (USD Billion)
      3. BY PLATFORM, 2025-2035 (USD Billion)
    13. APAC MARKET SIZE ESTIMATES; FORECAST
      1. BY COMPONENT, 2025-2035 (USD Billion)
      2. BY DEPLOYMENT TYPE, 2025-2035 (USD Billion)
      3. BY PLATFORM, 2025-2035 (USD Billion)
    14. China MARKET SIZE ESTIMATES; FORECAST
      1. BY COMPONENT, 2025-2035 (USD Billion)
      2. BY DEPLOYMENT TYPE, 2025-2035 (USD Billion)
      3. BY PLATFORM, 2025-2035 (USD Billion)
    15. India MARKET SIZE ESTIMATES; FORECAST
      1. BY COMPONENT, 2025-2035 (USD Billion)
      2. BY DEPLOYMENT TYPE, 2025-2035 (USD Billion)
      3. BY PLATFORM, 2025-2035 (USD Billion)
    16. Japan MARKET SIZE ESTIMATES; FORECAST
      1. BY COMPONENT, 2025-2035 (USD Billion)
      2. BY DEPLOYMENT TYPE, 2025-2035 (USD Billion)
      3. BY PLATFORM, 2025-2035 (USD Billion)
    17. South Korea MARKET SIZE ESTIMATES; FORECAST
      1. BY COMPONENT, 2025-2035 (USD Billion)
      2. BY DEPLOYMENT TYPE, 2025-2035 (USD Billion)
      3. BY PLATFORM, 2025-2035 (USD Billion)
    18. Malaysia MARKET SIZE ESTIMATES; FORECAST
      1. BY COMPONENT, 2025-2035 (USD Billion)
      2. BY DEPLOYMENT TYPE, 2025-2035 (USD Billion)
      3. BY PLATFORM, 2025-2035 (USD Billion)
    19. Thailand MARKET SIZE ESTIMATES; FORECAST
      1. BY COMPONENT, 2025-2035 (USD Billion)
      2. BY DEPLOYMENT TYPE, 2025-2035 (USD Billion)
      3. BY PLATFORM, 2025-2035 (USD Billion)
    20. Indonesia MARKET SIZE ESTIMATES; FORECAST
      1. BY COMPONENT, 2025-2035 (USD Billion)
      2. BY DEPLOYMENT TYPE, 2025-2035 (USD Billion)
      3. BY PLATFORM, 2025-2035 (USD Billion)
    21. Rest of APAC MARKET SIZE ESTIMATES; FORECAST
      1. BY COMPONENT, 2025-2035 (USD Billion)
      2. BY DEPLOYMENT TYPE, 2025-2035 (USD Billion)
      3. BY PLATFORM, 2025-2035 (USD Billion)
    22. South America MARKET SIZE ESTIMATES; FORECAST
      1. BY COMPONENT, 2025-2035 (USD Billion)
      2. BY DEPLOYMENT TYPE, 2025-2035 (USD Billion)
      3. BY PLATFORM, 2025-2035 (USD Billion)
    23. Brazil MARKET SIZE ESTIMATES; FORECAST
      1. BY COMPONENT, 2025-2035 (USD Billion)
      2. BY DEPLOYMENT TYPE, 2025-2035 (USD Billion)
      3. BY PLATFORM, 2025-2035 (USD Billion)
    24. Mexico MARKET SIZE ESTIMATES; FORECAST
      1. BY COMPONENT, 2025-2035 (USD Billion)
      2. BY DEPLOYMENT TYPE, 2025-2035 (USD Billion)
      3. BY PLATFORM, 2025-2035 (USD Billion)
    25. Argentina MARKET SIZE ESTIMATES; FORECAST
      1. BY COMPONENT, 2025-2035 (USD Billion)
      2. BY DEPLOYMENT TYPE, 2025-2035 (USD Billion)
      3. BY PLATFORM, 2025-2035 (USD Billion)
    26. Rest of South America MARKET SIZE ESTIMATES; FORECAST
      1. BY COMPONENT, 2025-2035 (USD Billion)
      2. BY DEPLOYMENT TYPE, 2025-2035 (USD Billion)
      3. BY PLATFORM, 2025-2035 (USD Billion)
    27. MEA MARKET SIZE ESTIMATES; FORECAST
      1. BY COMPONENT, 2025-2035 (USD Billion)
      2. BY DEPLOYMENT TYPE, 2025-2035 (USD Billion)
      3. BY PLATFORM, 2025-2035 (USD Billion)
    28. GCC Countries MARKET SIZE ESTIMATES; FORECAST
      1. BY COMPONENT, 2025-2035 (USD Billion)
      2. BY DEPLOYMENT TYPE, 2025-2035 (USD Billion)
      3. BY PLATFORM, 2025-2035 (USD Billion)
    29. South Africa MARKET SIZE ESTIMATES; FORECAST
      1. BY COMPONENT, 2025-2035 (USD Billion)
      2. BY DEPLOYMENT TYPE, 2025-2035 (USD Billion)
      3. BY PLATFORM, 2025-2035 (USD Billion)
    30. Rest of MEA MARKET SIZE ESTIMATES; FORECAST
      1. BY COMPONENT, 2025-2035 (USD Billion)
      2. BY DEPLOYMENT TYPE, 2025-2035 (USD Billion)
      3. BY PLATFORM, 2025-2035 (USD Billion)
    31. PRODUCT LAUNCH/PRODUCT DEVELOPMENT/APPROVAL
    32. ACQUISITION/PARTNERSHIP

Smart Stadium Market Segmentation

Market Segmentation Overview

  • Detailed segmentation data will be available in the full report
  • Comprehensive analysis by multiple parameters
  • Regional and country-level breakdowns
  • Market size forecasts by segment
Infographic

Free Sample Request

Kindly complete the form below to receive a free sample of this Report

Get Free Sample

Customer Strories

“I am very pleased with how market segments have been defined in a relevant way for my purposes (such as "Portable Freezers & refrigerators" and "last-mile"). In general the report is well structured. Thanks very much for your efforts.”

Victoria Milne

Founder

Compare Licence

×
Features License Type
Single User Multiuser License Enterprise User
Price $4,950 $5,950 $7,250
Maximum User Access Limit 1 User Upto 10 Users Unrestricted Access Throughout the Organization
Free Customization
Direct Access to Analyst
Deliverable Format
Platform Access
Discount on Next Purchase 10% 15% 15%
Printable Versions