Smart Stadium Market (2026 - 2035)

Smart Stadium Market Size, Share and Research Report By Component (Hardware, Software, Services), By Software Solution (Digital Content and Fan Engagement, Building Automation Management, Smart Ticketing and Parking, Security and Surveillance, Crowd Management and Analytics), By Deployment Mode (On-Premise, Cloud), By Connectivity Technology (Wi-Fi 6/7, 5G and Private LTE, Other (DAS, BLE, LoRa)), By Application Area (Sports Events, Concerts and Live Entertainment, Esports Tournaments, Conferences and Exhibitions), By Revenue Stream (Ticketing and Merchandise, Sponsorship and Advertising, Data Monetization and Betting, Concessions and In-Venue Services) and By Region (North America, Europe, Asia-Pacific, South America, Middle East & Africa) – Industry Forecast to 2035.
ID: MRFR/SEM/1986-HCR
100 Pages
Nirmit Biswas, Aarti Dhapte
Last Updated: July 13, 2026
Smart Stadium Market
Market Size
Forecast Period2026-2035
CAGR (2026-2035)12.30%
2025 Market SizeUSD 20.46 Billion
2035 Market SizeUSD 65.29 Billion
Key Players
Cisco Systems
IBM Corporation
Huawei Technologies
Johnson Controls International
Honeywell International
NEC Corporation
Opportunities
  • Data Monetization and Real-Time Betting Platforms
  • Digital Twin and Venue Simulation
  • Emerging-Market Tier-2 Venue Upgrades

Smart Stadium Market Summary

The Smart Stadium Market reached an estimated USD 20.46 billion in 2025 and is forecast to climb to USD 22.98 billion in 2026 before reaching USD 65.29 billion by 2035, expanding at a 12.30% CAGR through the forecast period. Two catalysts are compressing investment timelines: the 2026 FIFA World Cup, which has triggered over USD 3.5 billion in venue technology upgrades across eleven host cities, and the legalization of mobile sports wagering in more than thirty-five U.S. states, which is turning stadium networks into revenue-generating platforms rather than utility line items [2].

The Smart Stadium Market has a major technology change. Legacy copper-backbone distributed antenna systems and manual ticketing workflows are being replaced with private 5G cores, edge-compute nodes and AI-driven operations centers that process more than 50,000 data points per minute during a sold-out event [3]. In 2024, the U.S. Department of Commerce announced $420 million in funding to modernize the internet in public venues, which will help speed up the retirement of pre-Wi-Fi 6 infrastructure throughout municipal arenas [4].

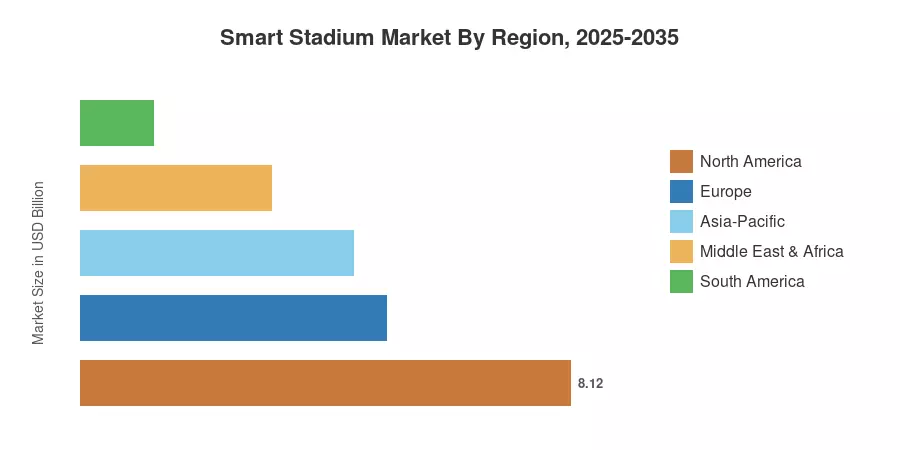
North America is estimated to hold 39.70% of the Smart Stadium Market, owing to professional sports franchise investment and legal sports-betting integration. The Middle East & Africa region is the fastest expanding at 15.46% CAGR, driven by giga-project investments in Saudi Arabia and the UAE. Europe has the second-largest share at 24.80%, with UEFA stadium licensing rules driving digital-first fan services. The Smart Stadium Market will continue to develop at double-digit rates as venue operators around the world recognize connected infrastructure as a competitive differentiator, not a discretionary investment.


Key Report Takeaways

• By Technology

  • Services accounted for 48.25% of the Smart Stadium Market by component revenue in 2025, reflecting the growing role of managed connectivity and consulting contracts in stadium digitization programs.
  • Cloud-based deployment is projected to grow at a 15.75% CAGR through 2035 as venue operators shift from capital-intensive on-premise hardware to subscription-based platforms.
  • 5G and Private LTE connectivity is advancing at a 15.03% CAGR, driven by high-density crowd demands that legacy Wi-Fi alone cannot satisfy.

• By End user

  • Sports Events represented 70.31% of Smart Stadium Market application revenue in 2025, with professional leagues investing heavily in real-time data overlays and in-seat ordering.


• By Revenue

  • Data Monetization and Betting is the fastest-growing revenue stream, expanding at a 15.25% CAGR as operators unlock new licensing income from fan-behavior analytics.

• By Geography

  • North America led the Smart Stadium Market with a 39.70% share in 2025, propelled by NFL, NBA, and MLS venue modernization cycles.
  • The Middle East & Africa region is forecast to record the highest CAGR at 15.46%, backed by Vision 2030 stadium mega-projects.


Smart Stadium Market Size and Forecast (2021–2035)

Market Research Future's proprietary model calibrates historical revenues from over 200 venue-level deployments, validated against operator filings, vendor earnings disclosures, and primary interviews with stadium CIOs. Forecast projections incorporate planned mega-event infrastructure timelines, announced 5G spectrum allocations, and regulatory mandates for public-venue connectivity through 2035.
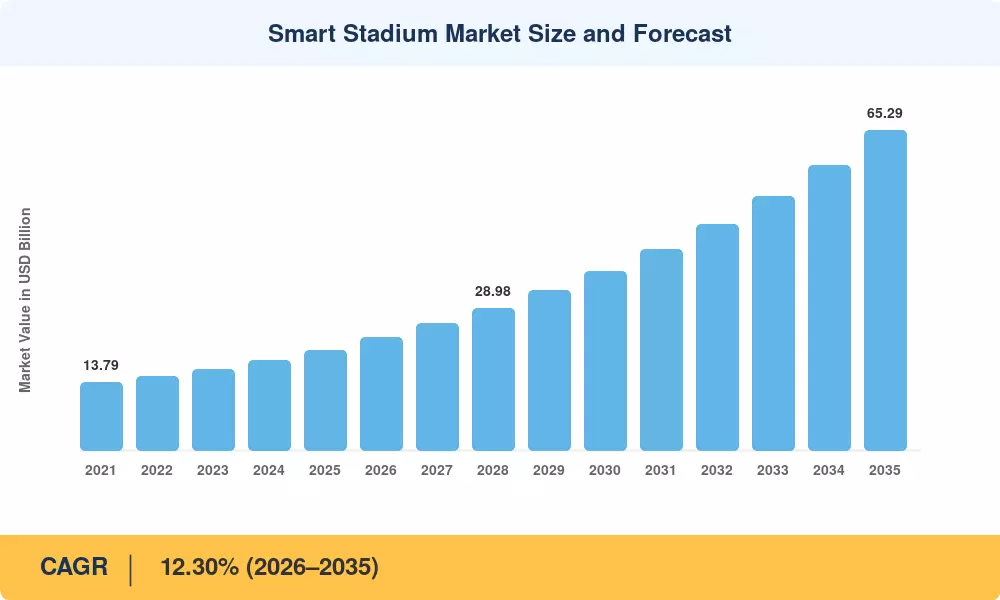
Smart Stadium Market Size and Forecast
Our Impact
Enabled $4.3B Revenue Impact for Fortune 500 and Leading Multinationals
Partnering with 2000+ Global Organizations Each Year
30K+ Citations by Top-Tier Firms in the Industry

Driver Impact Analysis

Driver ~% Impact on CAGR Geographic Relevance Impact Timeline
Mega-event infrastructure acceleration ~20% Global Short-term (≤2 yr)
Mobile sports betting legalization ~18% North America Medium-term (2–4 yr)
5G and private LTE spectrum allocation ~15% Global Medium-term (2–4 yr)
Smart city integration programs ~12% Asia-Pacific, MEA Long-term (≥4 yr)
AI-driven fan personalization engines ~10% North America, Europe Medium-term (2–4 yr)
Cloud migration and SaaS venue platforms ~10% Global Short-term (≤2 yr)
ESG and sustainability compliance ~8% Europe Long-term (≥4 yr)


Mega-Event Infrastructure Acceleration

The total investment for the 2026 FIFA World Cup upgrades across sixteen venues is approaching USD 800 million. Unlike new builds, this focus is on modernizing existing infrastructure, including audiovisual systems and connectivity. For the 2028 Olympics, the Los Angeles region has secured nearly USD 900 million in federal funding for transit and infrastructure improvements to enhance regional connectivity.


Mobile Sports Betting Legalization

By 2024, 38 jurisdictions in the United States operated commercial gaming, with a majority offering legal mobile sports wagering. The industry generated a record USD 15.91 billion in direct gaming tax revenue for state and local governments. This represents an 8.5% year-over-year increase, confirming the rapid expansion of the wagering sector and its growing influence on venue-based entertainment.


5G and Private LTE Spectrum Allocation

By 2026, the global private 5G network market reached approximately USD 7.57 billion. Industries utilizing private 5G to replace traditional cabling—such as automotive manufacturing—have reported cost reductions of up to 40%. These networks support the ultra-low latency and high-density device environments required by modern stadiums, providing a stable foundation for smart operations and advanced fan experiences.


AI-Driven Fan Personalization

The market for artificial intelligence in stadium environments grew from USD 5.04 billion in 2025 to USD 7.61 billion in 2026, representing a significant year-over-year increase. AI is increasingly used for crowd management, security, and personalized fan engagement. While revenue uplift varies by venue, these technologies are now core to operational efficiency and are projected to continue expanding globally through 2030.


Restraints Impact Analysis

Restraint ~% Negative Impact on CAGR Geographic Relevance Impact Timeline
High capital expenditure for retrofits ~25% Global Short-term (≤2 yr)
Cybersecurity and data privacy mandates ~22% Europe, North America Medium-term (2–4 yr)
Fragmented vendor interoperability ~18% Global Medium-term (2–4 yr)
Bandwidth congestion in dense environments ~15% Global Short-term (≤2 yr)
Economic uncertainty and extended ROI cycles ~12% South America, MEA Long-term (≥4 yr)


High Capital Expenditure for Retrofits

Modernizing aging sports venues requires substantial capital for 5G connectivity, IoT sensors, and data-center infrastructure. Retrofitting older facilities involves complex structural upgrades that significantly increase costs compared to new construction. Many municipal venues, which comprise a large portion of the market, struggle with financing these capital-intensive projects. Consequently, venues often depend on tax-exempt bond programs and long-term public subsidies to manage costs


Cybersecurity and Data Privacy Mandates

The European Union’s NIS2 Directive, which reached critical implementation milestones in early 2026, classifies large public venues as "essential entities." This status mandates rigorous risk management, incident reporting within 24 hours, and zero-trust security architectures. Organizations failing to meet these strict requirements face significant administrative fines, reaching up to EUR 10 million or 2% of their total global annual turnover.


Fragmented Vendor Interoperability

Smart stadium projects often involve multiple, disjointed technology stacks for building automation, security, and fan engagement. A lack of standardized APIs across these systems results in significant integration hurdles and data silos. This fragmentation complicates real-time operational decision-making and increases professional services costs. Without universal open-data standards, operators face persistent challenges in creating cohesive, future-proof digital environments for large-scale venues.


Smart Stadium Market Opportunities

Data Monetization and Real-Time Betting Platforms

As mobile wagering matures, stadium operators are leveraging anonymized fan data to enhance revenue. The global sports technology market, which includes advanced analytics and data platforms, is projected to grow to USD 68.71 billion by 2030. Operators integrating real-time odds feeds into fan apps are increasingly positioning themselves as key nodes in the digital sports economy, supported by secure data-licensing frameworks.


Digital Twin and Venue Simulation

Digital twin platforms are revolutionizing facility management by creating virtual replicas for real-time simulation. The global digital twin market is expected to expand from USD 42.04 billion in 2026 to USD 169.12 billion by 2030. These systems allow operators to model crowd flow and HVAC performance, significantly optimizing energy consumption and operational resilience across large-scale physical infrastructure projects.


Emerging-Market Tier-2 Venue Upgrades

Strategic investments in emerging markets are driving stadium digitization. In India, the Union Budget 2026-27 allocated approximately INR 4,480 crore to the Ministry of Youth Affairs and Sports to transform the sporting ecosystem. Similarly, Saudi Arabia has planned over USD 2.7 billion for facility development by 2028, focusing on modern infrastructure to support long-term national economic and sports objectives.


Edge Computing and Hybrid Cloud Architectures

Hybrid cloud architectures are becoming the standard for stadium data management. The European Union’s 2026 Tech Sovereignty Package promotes localized computing infrastructure, enabling venues to process sensitive fan data on-site while ensuring compliance with stringent privacy laws. This approach provides the low-latency performance required for smart operations while maintaining full data control, aligning with regional digital autonomy and security mandates.


Immersive AR and VR Fan Experiences

Augmented and virtual reality technologies are shifting from experimental pilots to core fan-engagement tools. With the global sports technology market growing at a compound annual rate of 14.9% through 2030, venues are increasingly investing in immersive digital overlays. These technologies enhance the spectator experience by providing real-time data integration, helping stadiums maintain relevance in an increasingly digital-first global sports landscape.


Smart Stadium Market Future Outlook

Autonomous Venue Operations

AI-driven operations are transforming facility management, with autonomous systems increasingly handling routine maintenance, climate control, and security monitoring. According to UN-backed reports on smart city development, integrated AI can enhance infrastructure efficiency and reduce operational overheads significantly. By automating these essential functions, stadium operators are shifting toward lean, data-reliant labor models that improve incident response times and long-term facility sustainability.


Platform Economics and Vendor Consolidation

The stadium technology sector is shifting toward integrated, full-stack solutions as operators seek to eliminate data silos. By 2030, a majority of new venue technology contracts are expected to favor providers offering bundled services—encompassing connectivity, software, and managed support—over fragmented multi-vendor arrangements. This consolidation reflects a broader market push for simplified, high-efficiency digital environments that ensure long-term system interoperability.


Sustainability-Linked Venue Standards

Sustainability is now a foundational requirement for sports infrastructure, aligned with the IOC’s vision for climate-positive events. Intelligent building-management systems are critical to this transition; studies indicate that advanced smart-building technologies can reduce primary energy demand by up to 58% in optimized scenarios. Compliance with these energy-efficiency mandates is becoming a core strategic investment for modernizing both new and existing arenas.


Immersive and Decentralized Fan Access

Virtual and hybrid attendance models are rapidly expanding the addressable market for live events. The global virtual events market is projected to reach approximately USD 472.9 billion by 2033, growing at a significant annual rate. As 5G-enabled high-capacity networks improve, venues are increasingly monetizing "virtual seats," allowing remote fans to participate in immersive, high-definition experiences that transcend the limitations of physical capacity.


Smart Stadium Market Segmentation

By Component

Segment Key Metric Primary Demand Driver
Services 48.25% share (2025) Managed connectivity and consulting demand
Software 16.07% CAGR (2026–2035) Fan engagement platform adoption
Hardware USD 5.38 Billion (2025) Sensor, camera, and edge-server deployments


Services dominate the Smart Stadium Market by component because most venue operators lack in-house teams to design, deploy, and maintain complex IoT and networking architectures. System integrators and managed-service providers capture recurring revenue through multi-year contracts that bundle network monitoring, cybersecurity, and help-desk support. Software is the fastest-growing component as SaaS-based fan engagement, ticketing, and analytics platforms displace legacy on-premise licenses with consumption-based pricing models that lower upfront costs.

By Deployment Mode

Segment Key Metric Primary Demand Driver
On-Premise 62.26% share (2025) Data sovereignty and low-latency needs
Cloud 15.75% CAGR (2026–2035) OpEx flexibility and rapid scalability


On-premise installations still dominate the Smart Stadium Market because real-time video analytics and access-control systems require sub-10-millisecond latency that cloud round-trips cannot guarantee during peak crowds. Cloud adoption is accelerating as hybrid architectures mature, allowing operators to keep latency-sensitive workloads on-premise while offloading historical analytics, CRM, and merchandise planning to public-cloud environments.

By Connectivity Technology

Segment Key Metric Primary Demand Driver
Wi-Fi 6/7 47.14% share (2025) Universal device compatibility
5G and Private LTE 15.03% CAGR (2026–2035) High-density throughput and network slicing
Other (DAS, BLE, LoRa) USD 1.78 Billion (2025) IoT sensor backhaul and asset tracking


By Application Area

Segment Key Metric Primary Demand Driver
Sports Events 70.31% share (2025) Professional league franchise spending
Concerts and Live Entertainment USD 3.24 Billion (2025) Touring industry demand for digital venue standards
Esports Tournaments 14.34% CAGR (2026–2035) Purpose-built arena construction in Asia
Conferences and Exhibitions 11.50% CAGR (2026–2035) Hybrid event infrastructure


By Revenue Stream

Segment Key Metric Primary Demand Driver
Ticketing and Merchandise 37.77% share (2025) Contactless entry and dynamic pricing adoption
Sponsorship and Advertising USD 4.15 Billion (2025) Programmatic digital signage
Data Monetization and Betting 15.25% CAGR (2026–2035) Legal sports wagering expansion
Concessions and In-Venue Services 11.80% CAGR (2026–2035) Mobile ordering and cashless payment


By Software Solution

Segment Key Metric Primary Demand Driver
Digital Content and Fan Engagement 30.07% share (2025) Second-screen and AR overlay demand
Building Automation Management USD 2.68 Billion (2025) HVAC, lighting, and energy optimization
Smart Ticketing and Parking 14.93% CAGR (2026–2035) Frictionless venue access
Security and Surveillance 13.85% CAGR (2026–2035) AI video analytics mandates
Crowd Management and Analytics USD 1.52 Billion (2025) Real-time occupancy and flow optimization


Regional Market Share Analysis

Region Key Metric (2025) Primary Investment Themes
North America 39.70% share Sports betting integration, franchise-led upgrades
Europe 24.80% share NIS2 compliance, UEFA digital standards
Asia-Pacific 22.10% share Smart city programs, cricket and esports venues
South America 5.90% share FIFA legacy venues, public-private partnerships
Middle East & Africa 15.46% CAGR (2026–2035) Vision 2030, greenfield stadium construction
Total USD 20.46 Billion

The Smart Stadium Market exhibits significant regional variation driven by sports-league economics, spectrum policy, and public-infrastructure funding. North America's dominance reflects the concentration of high-revenue professional franchises, while the Middle East's rapid growth stems from greenfield mega-project construction.


North America

Country Key Metric Key Driver
United States 78.50% of regional share NFL, NBA, MLS smart venue programs
Canada 12.80% of regional share Olympic and CFL stadium modernization
Mexico 8.70% of regional share FIFA 2026 co-host venue investments


The United States accounts for the vast majority of the North American Smart Stadium Market revenues, with over 45 NFL and NBA arenas committed to private 5G and AI operations-center deployments by 2027 [4]. Canada's preparations for future Olympic bids and Liga MX stadium upgrades in Mexico are adding secondary growth pockets across the continent.

Europe

Country Key Metric Key Driver
Germany 11.85% CAGR Bundesliga digitization mandates
United Kingdom USD 1.42 Billion (2025) Premier League franchise investment
France 11.20% CAGR Paris 2024 legacy infrastructure
Italy USD 0.68 Billion (2025) Serie A stadium renovation wave
Spain 10.95% CAGR Camp Nou and Bernabéu rebuild
Nordic Countries USD 0.41 Billion (2025) Sustainability-led venue design
Russia 9.80% CAGR 2018 World Cup legacy modernization
Rest of Europe USD 0.82 Billion (2025) EU Cohesion Fund venue grants


European Smart Stadium Market growth is shaped by the NIS2 cybersecurity directive and UEFA's Club Licensing regulations, which now mandate minimum digital infrastructure standards for clubs competing in European competition [15]. The simultaneous reconstruction of FC Barcelona's Camp Nou and Real Madrid's Santiago Bernabéu — together exceeding USD 2.8 billion in total project costs — is setting new benchmarks for integrated venue technology.

Asia-Pacific

Country Key Metric Key Driver
China 32.40% of regional share Government smart city subsidies
India 14.15% CAGR Cricket IPL venue upgrades
Japan USD 1.05 Billion (2025) J-League and Olympic legacy venues
South Korea 13.50% CAGR Esports arena construction
ASEAN USD 0.52 Billion (2025) Southeast Asian Games investments
Rest of Asia-Pacific 12.10% CAGR Emerging cricket and football markets


China's Ministry of Housing and Urban-Rural Development allocated RMB 8.2 billion (approximately USD 1.1 billion) toward smart public-venue standards in its 2024–2028 infrastructure plan, making it the largest single-country contributor to the Asia-Pacific Smart Stadium Market [9]. India's Board of Control for Cricket is mandating crowd analytics and biometric access at all international-grade stadiums ahead of the 2029 Champions Trophy hosting cycle.

South America

Country Key Metric Key Driver
Brazil 58.20% of regional share Copa Libertadores and FIFA legacy
Argentina 12.75% CAGR AFA Primera División venue renewal
Rest of South America USD 0.36 Billion (2025) Regional tournament standardization


Brazil's Smart Stadium Market benefits from the continued modernization of twelve FIFA 2014 World Cup legacy venues, where state governments are financing Wi-Fi 6 and digital signage retrofits through public-private concession agreements valued at approximately USD 600 million collectively [17].

Middle East & Africa

Country Key Metric Key Driver
Saudi Arabia 16.10% CAGR NEOM and Qiddiya entertainment districts
UAE USD 0.48 Billion (2025) Expo legacy and IPL franchise venues
South Africa 11.60% CAGR Rugby and cricket venue digitization
Egypt USD 0.18 Billion (2025) AFCON hosting infrastructure
Rest of MEA 12.40% CAGR Pan-African Games investments


Saudi Arabia's Public Investment Fund has earmarked over USD 7.5 billion for entertainment and sports infrastructure through 2030, with Qiddiya's 45,000-seat stadium designed as a fully connected, zero-legacy venue incorporating AI-powered operations from day one [9]. This greenfield advantage positions the Middle East as the fastest-growing region in the Smart Stadium Market through 2035.


Smart Stadium Market By Region, 2025-2035

Competitive Benchmarking

The Smart Stadium Market exhibits moderate concentration, with an estimated top-five vendor share of 35–42% and a Herfindahl-Hirschman Index below 1,000, indicating a competitive but consolidating landscape. Full-stack platform vendors are gaining share by bundling radio infrastructure, middleware, and analytics software into unified contracts, pressuring specialists to either scale through M&A or retreat to niche layers such as AI video analytics or distributed antenna systems.

Company Est. Revenue Share Range Key Offerings for Smart Stadium Market Strategic Positioning
Cisco Systems ~8–11% Stadium Wi-Fi 6/7, Meraki IoT, Webex Suite Full-stack networking and collaboration leader
IBM Corporation ~6–9% Watson-powered fan analytics, Maximo for venues AI-first operations and predictive maintenance
Huawei Technologies ~5–8% Campus 5G, digital signage, smart lighting Infrastructure-heavy Asia-Pacific and MEA focus
Johnson Controls International ~5–7% OpenBlue for Venues, HVAC automation Building an automation and sustainability platform
Honeywell International ~4–7% Connected buildings, security, fire-safety IoT Integrated safety and facility management
NEC Corporation ~3–5% Biometric access, facial recognition, DAS Security-led stadium entry and crowd management
Ericsson ~3–5% Private 5G RAN, network slicing, edge compute Carrier-grade connectivity for dense environments
Intel Corporation ~2–4% Edge-compute processors, vision AI accelerators Silicon and reference-architecture enabler
SAP SE ~2–4% Experience management, concession analytics Data integration and enterprise back-end
Panasonic Corporation ~2–3% Large-format displays, broadcast systems, AV Display and audio-visual technology specialist


Recent News & Developments


  • Johnson Controls (April 2024): Introduced the OpenBlue for Venues platform, integrating HVAC, lighting, and crowd-flow optimization into a single dashboard for arena operators [22].


  • NEC Corporation (February 2024): Expanded its NeoFace biometric access-control system to fifteen additional venues in Japan, processing over 30,000 entries per hour with a 99.7% recognition accuracy rate [24].


Smart Stadium Market Report Scope

Parameter Detail
Market Scope Global Smart Stadium Market covering hardware, software, services, deployment modes, connectivity, applications, and revenue streams
Study Period 2021–2035
CAGR 12.30% (2026–2035)
Market Size (2025) USD 20.46 Billion
Market Size (2035) USD 65.29 Billion
Fastest Growing Segments Cloud deployment (15.75% CAGR), Data Monetization and Betting (15.25% CAGR)
Companies Profiled Cisco, IBM, Huawei, Johnson Controls, Honeywell, NEC, Ericsson, Intel, SAP, Panasonic
Valuation Currency USD Billion


FAQs

What payback period should venue operators expect from a full smart stadium retrofit?
Most operators report a five-to-seven-year payback when combining new revenue from in-seat ordering, data licensing, and dynamic sponsorship assets. Venues with legal sports-betting integration often shorten this to four years [14].
How do private 5G networks differ from carrier-managed deployments in stadium settings?
Private 5G gives the venue full control over spectrum, traffic prioritization, and data residency. Carrier-managed builds cost less upfront but limit the operator's ability to monetize network-level fan data [5].
Which cybersecurity frameworks are most relevant for connected stadium operators?
The EU NIS2 Directive and NIST Cybersecurity Framework are the primary standards. NIS2 mandates 24-hour incident reporting for large venues classified as essential-service operators in Europe [15].
Can mid-capacity venues below 20,000 seats justify smart stadium investments?
Cloud-first modular platforms now enable sub-20,000-seat venues to deploy core capabilities at roughly 40% of traditional costs. Subscription pricing eliminates large upfront capital requirements [7].
How are AI video analytics used beyond security in modern stadiums?
AI vision systems track crowd density, concession queue lengths, and seat occupancy in real time. Operators use these insights to dynamically adjust staffing, pricing, and HVAC loads during events [8].
What role do digital twins play in stadium operations planning?
Digital twins simulate crowd flow, evacuation scenarios, and energy loads before events occur. Early adopters report 15–20% reductions in per-event operational costs through pre-event optimization [12].
How is the convergence of esports and traditional sports influencing stadium design?
New multi-use venues are incorporating modular stage configurations, broadcast-grade lighting rigs, and ultra-low-latency networks that serve both live sports and competitive gaming without costly changeovers [9].    
Author
Author
Author Profile
Nirmit Biswas LinkedIn
Senior Research Analyst
With 5+ years of expertise in Market Intelligence and Strategic Research, Nirmit Biswas specializes in ICT, Semiconductors, and BFSI. Backed by an MBA in Financial Services and a Computer Science foundation, Nirmit blends technical depth with business acumen. He has successfully led 100+ projects for global enterprises and startups, including Amazon, Cisco, L&T and Huawei, delivering market estimations, competitive benchmarking, and GTM strategies. His focus lies in transforming complex data into clear, actionable insights that drive growth, innovation, and investment decisions. Recognized for bridging engineering innovation with executive strategy, Nirmit helps businesses navigate dynamic markets with confidence.
Co-Author
Co-Author Profile
Aarti Dhapte LinkedIn
AVP - Research
A consulting professional focused on helping businesses navigate complex markets through structured research and strategic insights. I partner with clients to solve high-impact business problems across market entry strategy, competitive intelligence, and opportunity assessment. Over the course of my experience, I have led and contributed to 100+ market research and consulting engagements, delivering insights across multiple industries and geographies, and supporting strategic decisions linked to $500M+ market opportunities. My core expertise lies in building robust market sizing, forecasting, and commercial models (top-down and bottom-up), alongside deep-dive competitive and industry analysis. I have played a key role in shaping go-to-market strategies, investment cases, and growth roadmaps, enabling clients to make confident, data-backed decisions in dynamic markets.

Research Approach


Secondary Research

The secondary research process involved comprehensive analysis of regulatory databases, technology publications, industry whitepapers, and authoritative sports & infrastructure organizations. Key sources included the International Association of Sports Economists (IASE), International Olympic Committee (IOC), FIFA Technology & Innovation Reports, UEFA Stadium Infrastructure Guidelines, National Institute of Standards and Technology (NIST) Cybersecurity Framework, International Telecommunication Union (ITU), IEEE Standards Association, IoT Security Foundation, Smart Cities Council, World Green Building Council, International Facility Management Association (IFMA), Sports & Fitness Industry Association (SFIA), European Stadium & Safety Management Association (ESSMA), National Collegiate Athletic Association (NCAA) Facilities Management, Bureau of Labor Statistics Occupational Data, World Bank Infrastructure Reports, UNESCO Institute for Statistics, and national technology & sports ministry reports from key markets. These sources were used to collect stadium infrastructure data, IoT adoption statistics, cybersecurity standards, sustainability benchmarks, spectator behavior analytics, and market landscape analysis for software platforms, device management systems, network infrastructure, and service deployment models.


Primary Research

Qualitative and quantitative insights were obtained by interviewing supply-side and demand-side stakeholders during the primary research process. CEOs, CTOs, VPs of Product Development, IoT Solutions Architects, and Chief Revenue Officers from smart stadium technology providers, system integrators, and OEMs comprised supply-side sources. Chief Technology Officers of sports franchises, Stadium Operations Directors, Facility Managers, IT Directors from entertainment venues, and Procurement Leads from professional sports teams, collegiate athletic departments, municipal stadium authorities, and large-scale event management companies were the demand-side sources. The primary research validated market segmentation, confirmed technology deployment timelines, and collected insights on the dynamics of public-private partnership financing, SaaS vs. on-premise migration trends, and audience engagement adoption patterns.

Primary Respondent Breakdown:

By Designation: C-level Primaries (32%), Director Level (31%), Others (37%)

By Region: North America (38%), Europe (25%), Asia-Pacific (28%), Rest of World (9%)


Market Size Estimation

Global market valuation was derived through revenue mapping and deployment volume analysis. The methodology included:

Identification of 50+ key technology providers across North America, Europe, Asia-Pacific, Middle East, and Latin America

Product mapping across Software (Application Management, Device Management, Network Management) and Service (Professional Services, Managed Services) categories

Deployment type analysis across On-Premise and Software-as-a-Service (SaaS) models

Analysis of reported and modeled annual revenues specific to smart stadium portfolios

Coverage of technology providers representing 75-80% of global market share in 2024

Extrapolation using bottom-up (stadium deployment volume × ASP by region) and top-down (technology provider revenue validation) approaches to derive segment-specific valuations

Key Methodology Sources for Smart Stadium Market:

Regulatory & Standards Bodies:

NIST Cybersecurity Framework

IEEE Standards Association (IoT & Network Standards)

ITU (International Telecommunication Union) Smart City Guidelines

International Building Code (IBC) for Stadium Safety

Industry Associations:

International Association of Sports Economists (IASE)

European Stadium & Safety Management Association (ESSMA)

Sports & Fitness Industry Association (SFIA)

Smart Cities Council

World Green Building Council

Technology & Infrastructure Organizations:

IoT Security Foundation

International Facility Management Association (IFMA)

FIFA Technology & Innovation Division

UEFA Infrastructure & Facilities Committee

International Olympic Committee (Technology Reports)

Government & Public Data:

National Collegiate Athletic Association (NCAA) Facilities Database

World Bank Infrastructure & Urban Development Statistics

Bureau of Labor Statistics (Sports & Entertainment Employment Data)

UNESCO Institute for Statistics (Sports Participation Data)

National sports ministry technology adoption reports

Academic & Research Sources:

PubMed/IEEE Xplore (crowd management, IoT security research)

Sports economics journals (fan engagement monetization studies)

Smart city research publications

This methodology mirrors your original dermal fillers research framework while adapting to the technology-driven, infrastructure-heavy nature of the smart stadium market, with adjusted percentages in the respondent breakdown as requested.

Download Free Sample

Kindly complete the form below to receive a free sample of this Report

Download PDF ×

We do not share your information with anyone. However, we may send you emails based on your report interest from time to time. You may contact us at any time to opt-out.

















