Download Free Sample
Kindly complete the form below to receive a free sample of this Report
Smart Thermostat Repair and MRO Services Market Size, Share and Trends Analysis Research Report Information By User Type (Homeowners, Property Managers, Facility Managers, Contractors), By Technology (Wi-Fi Enabled, Zigbee Technology, Bluetooth Technology, Smartphone Integration), And By Region (North America, Europe, Asia-Pacific, And Rest Of The World) – Market Forecast Till 2035.
As per MRFR analysis, the Smart Thermostat Repair and MRO Services Market was estimated at 1.5 USD Billion in 2024. The Smart Thermostat Repair and MRO Services industry is projected to grow from 1.6 in 2025 to 3.0 by 2035, exhibiting a compound annual growth rate (CAGR) of 6.5% during the forecast period 2025 - 2035.
The Smart Thermostat Repair and MRO Services Market is experiencing robust growth driven by technological advancements and increasing consumer awareness.
| 2024 Market Size | 1.5 (USD Billion) |
| 2035 Market Size | 3.0 (USD Billion) |
| CAGR (2025 - 2035) | 6.5% |
Nest Labs (US), Honeywell (US), Ecobee (CA), Emerson Electric (US), Johnson Controls (IE), Schneider Electric (FR), Lennox International (US), Carrier Global (US), Siemens (DE)
Our Impact
Enabled $4.3B Revenue Impact for Fortune 500 and Leading Multinationals
Partnering with 2000+ Global Organizations Each Year
30K+ Citations by Top-Tier Firms in the Industry
The Smart Thermostat Repair and MRO Services Market is currently experiencing a notable evolution, driven by the increasing adoption of smart home technologies and the growing emphasis on energy efficiency. As consumers become more aware of the benefits associated with smart thermostats, such as enhanced control over heating and cooling systems, the demand for repair and maintenance services is likely to rise. This trend is further supported by the need for regular servicing to ensure optimal performance and longevity of these devices. Additionally, the integration of advanced features, such as remote access and learning capabilities, necessitates specialized repair services that can address the complexities of modern smart thermostats. Moreover, the Smart Thermostat Repair and MRO Services Market appears to be influenced by the broader shift towards sustainability and environmental consciousness. As households and businesses seek to reduce their carbon footprints, the reliance on smart thermostats for efficient energy management is expected to grow. This shift may lead to an increase in the availability of MRO services tailored to the unique requirements of smart devices. Furthermore, the market could see a rise in partnerships between manufacturers and service providers, aiming to enhance customer satisfaction through comprehensive support and maintenance solutions. Overall, the landscape of the Smart Thermostat Repair and MRO Services Market is poised for growth, reflecting the evolving needs of consumers and the technological advancements in the industry.
The Smart Thermostat Repair and MRO Services Market is witnessing a surge in demand for specialized repair services. As smart thermostats become more complex, the need for technicians with specific expertise is likely to grow. This trend suggests that service providers may need to invest in training and certification programs to ensure their workforce is equipped to handle advanced technologies.
There is a growing emphasis on energy efficiency within the Smart Thermostat Repair and MRO Services Market. Consumers are increasingly motivated to optimize their energy consumption, which may lead to a higher demand for repair services that enhance the performance of smart thermostats. This focus on sustainability could drive innovation in service offerings.
The integration of Internet of Things (IoT) technologies is transforming the Smart Thermostat Repair and MRO Services Market. As smart thermostats become interconnected with other smart home devices, the complexity of repairs may increase. This trend indicates a potential need for service providers to develop comprehensive solutions that address the interconnected nature of modern home automation systems.
The increase in home renovation projects is a significant driver for the Smart Thermostat Repair and MRO Services Market. As homeowners invest in upgrading their living spaces, the installation of smart thermostats is often a key component of these renovations. This trend is supported by data indicating that home renovation spending has reached record levels, with many homeowners prioritizing energy-efficient upgrades. Consequently, the demand for repair and maintenance services is likely to rise as these new installations require ongoing support. The Smart Thermostat Repair and MRO Services Market is poised to capitalize on this trend, as more homeowners seek to ensure the reliability and efficiency of their smart home systems.
Regulatory frameworks aimed at enhancing energy efficiency are significantly influencing the Smart Thermostat Repair and MRO Services Market. Governments worldwide are implementing stringent energy efficiency standards, which often include mandates for smart thermostats in residential and commercial buildings. This regulatory push not only encourages the installation of smart thermostats but also emphasizes the need for regular maintenance and repair services to ensure compliance with energy standards. As a result, the Smart Thermostat Repair and MRO Services Market is expected to expand, driven by the necessity for ongoing support and service to meet these evolving regulations.
The increasing adoption of smart home technologies is a primary driver for the Smart Thermostat Repair and MRO Services Market. As consumers become more inclined to integrate smart devices into their homes, the demand for smart thermostats has surged. According to recent data, the smart thermostat market is projected to grow at a compound annual growth rate of approximately 25% over the next few years. This growth necessitates a corresponding increase in repair and maintenance services, as users seek to ensure optimal performance and longevity of their devices. Consequently, the Smart Thermostat Repair and MRO Services Market is likely to experience heightened activity as homeowners prioritize the upkeep of their smart systems.
Technological advancements in smart thermostats are propelling the Smart Thermostat Repair and MRO Services Market forward. Innovations such as machine learning algorithms and enhanced connectivity features are making smart thermostats more efficient and user-friendly. However, these advancements also introduce complexities that may require specialized repair services. As smart thermostats become more sophisticated, the need for skilled technicians who can address technical issues and perform maintenance is likely to increase. This trend suggests that the Smart Thermostat Repair and MRO Services Market will continue to evolve, adapting to the changing landscape of technology and consumer expectations.
The rising awareness of environmental sustainability is a crucial driver for the Smart Thermostat Repair and MRO Services Market. Consumers are increasingly recognizing the impact of energy consumption on the environment and are seeking solutions that reduce their carbon footprint. Smart thermostats, known for their energy-saving capabilities, are becoming a preferred choice among eco-conscious consumers. This trend is likely to lead to a higher demand for repair and maintenance services, as users aim to maximize the efficiency of their devices. The Smart Thermostat Repair and MRO Services Market stands to benefit from this shift towards sustainable living, as more individuals invest in the upkeep of their energy-efficient technologies.
The Smart Thermostat Repair and MRO Services Market showcases a diverse application landscape, with the residential segment dominating the share due to increased consumer awareness and adoption of smart home technologies. This segment benefits from a growing demand for energy efficiency and automation solutions in households, significantly influencing its market presence. In contrast, the commercial segment, characterized by its innovative integration of smart thermostats in office spaces and retail environments, is experiencing rapid growth. Organizations are increasingly focusing on enhancing energy savings, efficiency, and user comfort, which propels the market forward in this sector.
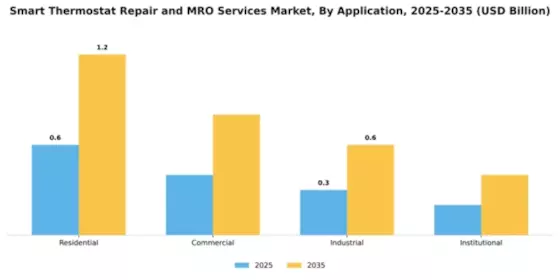
Residential (Dominant) vs. Commercial (Emerging)
The residential sector is a pivotal player in the Smart Thermostat Repair and MRO Services Market, characterized by a high adoption rate of smart home technologies. Homeowners are increasingly investing in smart thermostats due to their ability to optimize energy consumption, reduce utility costs, and enhance comfort. With a deepening emphasis on sustainability and smart home automation, this segment has carved out a substantial market position. Conversely, the commercial sector is emerging as a critical player, driven by the need for energy efficiency and smart building technologies. As businesses adapt to modern comfort and energy savings, the integration of smart thermostats in commercial spaces marks its emergence as a significant growth area.
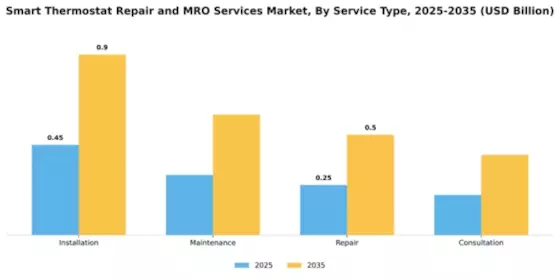
In the Smart Thermostat Repair and MRO Services Market, the service type segment reflects a diverse range of offerings, with installation services leading as the largest contributor. This segment benefits from the growing adoption of smart home technologies, where homeowners increasingly seek professional installation to ensure optimal functionality. Maintenance services are on the rise, driven by increasing consumer awareness of the need for regular servicing to enhance system longevity and efficiency. Emerging growth trends highlight maintenance services as the fastest-growing area within this segment. Factors such as advancements in smart thermostat technology and rising energy costs have prompted homeowners to prioritize maintenance. Additionally, as more consumers invest in smart thermostats, there is a growing trend towards seeking preventive services that guarantee optimal performance and cost savings over time.
Installation (Dominant) vs. Repair (Emerging)
Installation services in the Smart Thermostat Repair and MRO Services Market stand out as the dominant segment, catering to an increasing consumer demand for professional setups that leverage the full capabilities of smart thermostats. These services not only ensure correct installation but also often include initial consultations about product features and energy efficiency. On the other hand, repair services are emerging as a significant focus area as more households adopt smart thermostats. Addressing common technical issues and malfunctions becomes essential for maintaining customer satisfaction and system performance. As smart devices become more sophisticated, the demand for specialized repair services tailored to various brands and models is set to grow, complementing the installation market.
In the Smart Thermostat Repair and MRO Services Market, the distribution of technology segment values shows Wi-Fi Enabled smart thermostats as the predominant choice among consumers, thanks to their widespread availability and ease of installation. Zigbee Technology is emerging as a notable contender, appealing particularly to users seeking robust home automation solutions. Both Bluetooth and Smartphone Integration technologies play a role, though they hold a smaller share of the market, with Bluetooth often used for localized control, while Smartphone Integration enhances user experience through app connectivity.
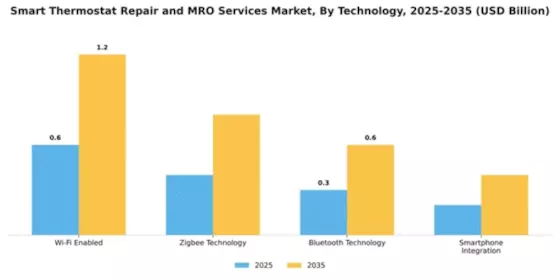
Technology: Wi-Fi Enabled (Dominant) vs. Zigbee Technology (Emerging)
Wi-Fi Enabled smart thermostats stand as the dominant technology in the market, offering versatility and extensive compatibility with existing home networks. These thermostats allow users to control their home environment remotely, contributing to convenience and energy savings. Conversely, Zigbee Technology is an emerging player, rapidly gaining popularity due to its efficiency in connecting multiple devices within smart home ecosystems. This wireless mesh network technology enhances communication between devices, making it a preferred choice for integrated smart home systems. Each technology appeals to different consumer preferences, with Wi-Fi Enabled being favored for its accessibility and Zigbee capturing the attention of tech-savvy individuals looking for advanced home automation.
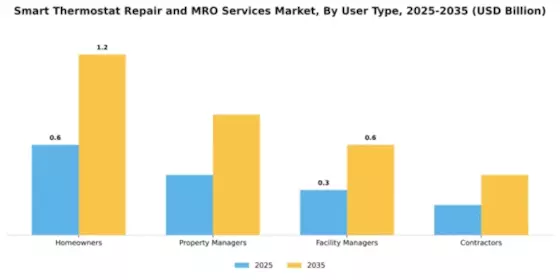
In the Smart Thermostat Repair and MRO Services Market, the ownership segment is largely dominated by homeowners. They account for a significant share due to the increasing adoption of smart technologies in residential properties. Homeowners prioritize energy efficiency and comfort, which drives their demand for repair and maintenance services as they seek to optimize their home systems. Simultaneously, contractors are witnessing rapid growth, fueled by the rising number of smart thermostat installations within both residential and commercial buildings. This trend highlights a shift in market dynamics as contractors step in to manage the installation and servicing of these systems. The growth in the contractor segment is primarily driven by the increased awareness of smart technologies and the push for energy-efficient solutions. Furthermore, government incentives, along with a growing emphasis on sustainable living, are encouraging more consumers and businesses to invest in smart thermostat technologies. As a result, contractors are emerging as a pivotal player in this market, offering MRO services that help manage both new installations and existing systems, thereby contributing to market expansion and innovation.
Homeowners (Dominant) vs. Contractors (Emerging)
Homeowners represent the dominant segment in the Smart Thermostat Repair and MRO Services Market. They are typically more invested in energy efficiency and smart home technologies, often seeking repair services to ensure their systems function optimally. This segment values convenience and energy savings, leading to frequent interactions with MRO services. On the other hand, contractors are positioned as an emerging segment, experiencing rapid growth as they play a crucial role in installing and maintaining smart thermostats. With the push for energy-efficient solutions, contractors capitalize on new business opportunities within the burgeoning market, offering services that cater to both residential and commercial needs. Their expertise and increasing importance in the smart thermostat landscape make them vital for market growth, presenting a balance between established consumer preferences and evolving service demands.
Get more detailed insights about Smart Thermostat Repair and MRO Services Market Request Free Sample
The Smart Thermostat Repair and MRO Services Market is currently characterized by a dynamic competitive landscape, driven by technological advancements and increasing consumer demand for energy efficiency. Major players such as Nest Labs (US), Honeywell (US), and Ecobee (CA) are at the forefront, each adopting distinct strategies to enhance their market positioning. Nest Labs (US) focuses on innovation through the integration of AI and machine learning into their products, which allows for more personalized user experiences. Meanwhile, Honeywell (US) emphasizes strategic partnerships with utility companies to promote energy-saving programs, thereby expanding its reach and influence in the market. Ecobee (CA) has carved a niche by prioritizing sustainability, offering products that not only optimize energy use but also appeal to environmentally conscious consumers. Collectively, these strategies contribute to a competitive environment that is increasingly centered around technological innovation and customer-centric solutions.In terms of business tactics, companies are localizing manufacturing and optimizing supply chains to enhance efficiency and reduce costs. The market structure appears moderately fragmented, with several key players holding substantial market shares while also facing competition from emerging startups. This fragmentation allows for a diverse range of products and services, catering to various consumer preferences and needs. The collective influence of these key players shapes market dynamics, as they continuously adapt to changing consumer demands and technological advancements.In November Honeywell (US) announced a strategic partnership with a leading energy provider to launch a new energy management program aimed at residential customers. This initiative is significant as it not only enhances Honeywell's service offerings but also positions the company as a leader in energy efficiency solutions. By collaborating with energy providers, Honeywell is likely to increase its market penetration and strengthen its brand reputation in the sustainability sector.In October Ecobee (CA) unveiled a new line of smart thermostats that incorporate advanced AI capabilities, allowing for predictive energy management. This launch is crucial as it reflects Ecobee's commitment to innovation and its ability to respond to consumer demands for smarter, more efficient home solutions. The integration of AI technology may provide Ecobee with a competitive edge, potentially attracting a broader customer base seeking cutting-edge home automation solutions.In September Nest Labs (US) expanded its product line to include a new range of smart home devices that integrate seamlessly with its thermostats. This move is indicative of Nest's strategy to create an ecosystem of interconnected devices, enhancing user experience and fostering customer loyalty. By broadening its product offerings, Nest Labs is likely to strengthen its market position and appeal to consumers looking for comprehensive smart home solutions.As of December current competitive trends in the Smart Thermostat Repair and MRO Services Market are heavily influenced by digitalization, sustainability, and AI integration. Strategic alliances are increasingly shaping the landscape, as companies recognize the value of collaboration in driving innovation and expanding market reach. Looking ahead, competitive differentiation is expected to evolve, with a notable shift from price-based competition to a focus on innovation, technology, and supply chain reliability. This transition suggests that companies that prioritize these aspects will likely emerge as leaders in the market.




The Smart Thermostat Repair and MRO Services Market is projected to grow at a 6.5% CAGR from 2025 to 2035, driven by technological advancements, increasing energy efficiency demands, and rising consumer awareness.
New opportunities lie in:
By 2035, the market is expected to be robust, driven by innovation and evolving consumer needs.
| MARKET SIZE 2024 | 1.5(USD Billion) |
| MARKET SIZE 2025 | 1.6(USD Billion) |
| MARKET SIZE 2035 | 3.0(USD Billion) |
| COMPOUND ANNUAL GROWTH RATE (CAGR) | 6.5% (2025 - 2035) |
| REPORT COVERAGE | Revenue Forecast, Competitive Landscape, Growth Factors, and Trends |
| BASE YEAR | 2024 |
| Market Forecast Period | 2025 - 2035 |
| Historical Data | 2019 - 2024 |
| Market Forecast Units | USD Billion |
| Key Companies Profiled | Nest Labs (US), Honeywell (US), Ecobee (CA), Emerson Electric (US), Johnson Controls (IE), Schneider Electric (FR), Lennox International (US), Carrier Global (US), Siemens (DE) |
| Segments Covered | Application, Service Type, Technology, User Type |
| Key Market Opportunities | Integration of advanced analytics and IoT for predictive maintenance in Smart Thermostat Repair and MRO Services Market. |
| Key Market Dynamics | Rising consumer demand for energy efficiency drives innovation and competition in smart thermostat repair and maintenance services. |
| Countries Covered | North America, Europe, APAC, South America, MEA |
The projected market valuation for the Smart Thermostat Repair and MRO Services Market is expected to reach 3.0 USD Billion by 2035.
The overall market valuation for the Smart Thermostat Repair and MRO Services Market was 1.5 USD Billion in 2024.
The expected CAGR for the Smart Thermostat Repair and MRO Services Market during the forecast period 2025 - 2035 is 6.5%.
Key players in the market include Nest Labs, Honeywell, Ecobee, Emerson Electric, Johnson Controls, Schneider Electric, Lennox International, Carrier Global, and Siemens.
The main application segments include Residential, Commercial, Industrial, and Institutional, with valuations ranging from 0.2 to 1.2 USD Billion.
Service types in the market include Installation, Maintenance, Repair, and Consultation, with valuations from 0.2 to 0.9 USD Billion.
Prevalent technologies include Wi-Fi Enabled, Zigbee Technology, Bluetooth Technology, and Smartphone Integration, with valuations from 0.2 to 1.2 USD Billion.
Primary users include Homeowners, Property Managers, Facility Managers, and Contractors, with valuations ranging from 0.2 to 1.2 USD Billion.
The market is expected to grow from 1.5 USD Billion in 2024 to 3.0 USD Billion by 2035, indicating robust growth.
Factors influencing growth may include technological advancements, increased adoption of smart home devices, and rising energy efficiency awareness.


Kindly complete the form below to receive a free sample of this Report

“This is really good guys. Excellent work on a tight deadline. I will continue to use you going forward and recommend you to others. Nice job”


“Thanks. It’s been a pleasure working with you, please use me as reference with any other Intel employees.”


“Thanks for sending the report it gives us a good global view of the Betaïne market.”


“Thank you, this will be very helpful for OQS.”


“We found the report very insightful! we found your research firm very helpful. I'm sending this email to secure our future business.”


“I am very pleased with how market segments have been defined in a relevant way for my purposes (such as "Portable Freezers & refrigerators" and "last-mile"). In general the report is well structured. Thanks very much for your efforts.”


“I have been reading the first document or the study, ,the Global HVAC and FP market report 2021 till 2026. Must say, good info! I have not gone in depth at all parts, but got a good indication of the data inside!”


“We got the report in time, we really thank you for your support in this process. I also thank to all of your team as they did a great job.”


“The Automotive 48V ECU Components Procurement Intelligence Study” was a complex project, but the Market Research Future (MRFR) team handled it with quality, agility, and customer-centricity. They delivered all requested data on time and within the agreed scope. The team, including Shubhendra Anand and Rahul Gotadki, was always readily available to clarify questions and swiftly implement necessary adjustments, driving the project to a successful conclusion within a very demanding timeframe.
I would also like to specifically commend Akshay Agarwal for his responsiveness and support at every stage—from our initial inquiry on May 6th through to final delivery on June 18th. His dedication made the entire process seamless.”



