Smart Toys Market (2026 - 2035)

Smart Toys Market Size, Share and Trends Analysis Research Report Information By Type (Robots, Interactive Games, Educational Robots), By Technology (Wi-Fi, Bluetooth, RFID or NFC), By Distribution Channel (Online/Ecommerce Stores, Specialty Stores, Toy Shops), By End-user (Toddlers, Pre-schoolers, School-going, Stripling), And By Region (North America, Europe, Asia-Pacific, And Rest Of The World) – Market Forecast Till 2035.
ID: MRFR/ICT/9329-HCR
100 Pages
Ankit Gupta
Last Updated: July 06, 2026
Smart Toys Market
Market Size
Forecast Period2026-2035
CAGR (2026-2035)11.10%
2025 Market SizeUSD 23.33 Billion
2035 Market SizeUSD 66.85 Billion
Key Players
Mattel, Inc.
LEGO Group
Hasbro, Inc.
Spin Master Corp.
WhalesBot
VTech Holdings
Opportunities
  • AI-Tutoring Companion Toys
  • Drone-as-a-Service and Toy-as-a-Service Subscription Platforms
  • Emerging-Market Government Procurement

Smart Toys Market Summary

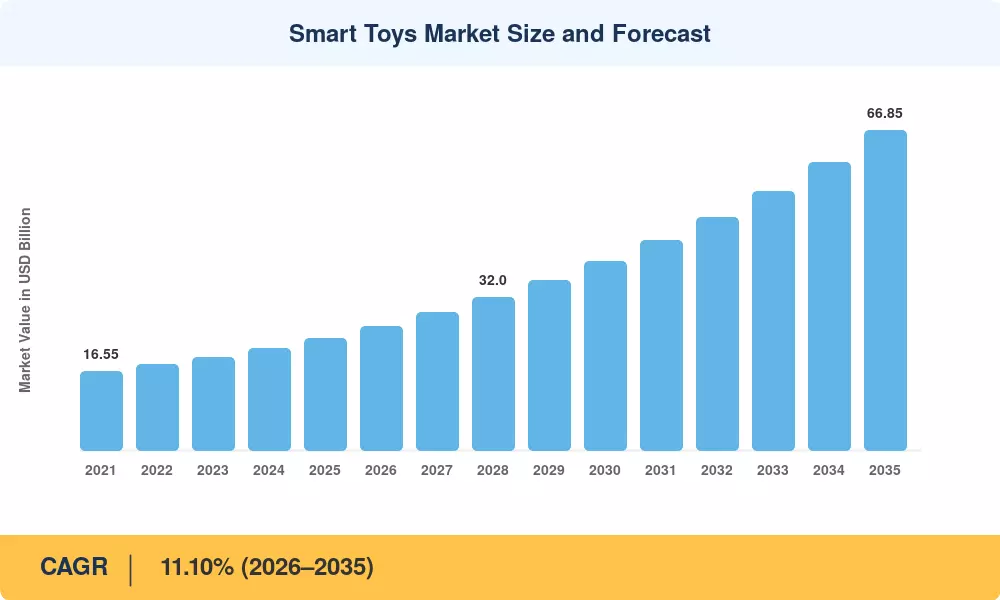
The Smart Toys Market reached a valuation of USD 23.33 Billion in 2025 and is projected to grow from USD 25.92 Billion in 2026 to USD 66.85 Billion by 2035, registering a CAGR of 11.10% over the forecast period (2026–2035). Parental appetite for play-based STEM education, coupled with strengthened children's data-privacy frameworks such as the U.S. COPPA 2.0 rulemaking and the EU's Age-Appropriate Design Code, is channeling investment into safe, scalable connected play platforms. Toy-industry venture funding surpassed USD 1.2 billion in 2024, a signal that capital markets view the Smart Toys Market as a durable growth story rather than a niche novelty [1].

Beyond these headline numbers, a technical change is changing product architectures. Old-fashioned battery-powered toys with set audio loops are being replaced by edge-AI-powered devices that change talks and difficulty levels in real time. Cloud agreements between incumbent toy makers and AI vendors have shortened development timelines from 18 months to less than nine, allowing brands to refresh content via subscription-based OTA updates rather than launching all new SKUs. Low-latency multiplayer robotics experiences are beginning to emerge in the Asia-Pacific, facilitated by 5G-enabled play venues that charge a 20–30% price premium over Wi-Fi-only equivalents [2].

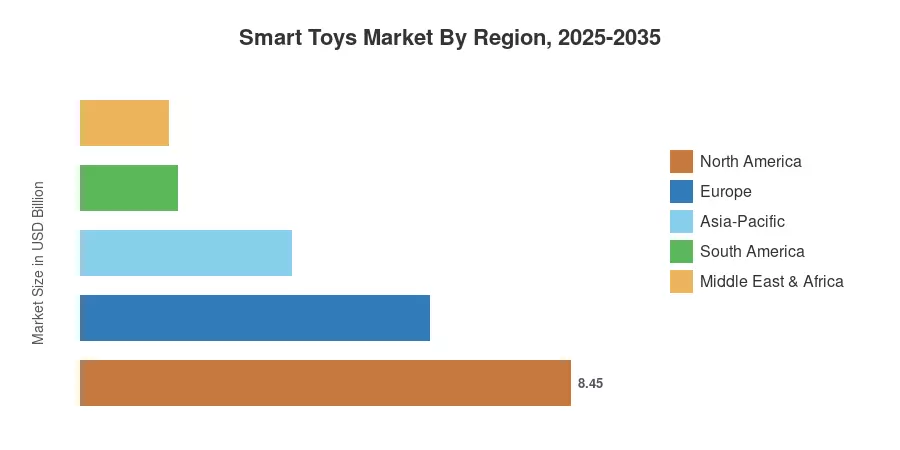
North America dominated the worldwide Smart Toys Market with a share of over 36.2% in 2025, driven by high family discretionary income and deep-rooted ed-tech adoption. Asia-Pacific is seeing the highest growth, with a projected regional CAGR of 15.60% through 2035, as hands-on robots are included in national STEM curricula in China, India, and South Korea. Europe, the second-largest region, is led by Germany and the UK, where strong product-safety regulations ironically boost consumer confidence in high-end connected toys. The Smart Toys Market is anticipated to shift from novelty gadgetry to a mainstream educational infrastructure category within the next decade.

Key Report Takeaways

• By Interfacing Device

  • Smartphone-connected toys captured 40.8% of the global Smart Toys Market revenue in 2025, driven by ubiquitous companion-app ecosystems.
  • Console-connected toys are forecast to expand at a CAGR of 23.4% through 2035 as gaming consoles integrate AR-toy peripherals.

• By Technology

  • Wi-Fi-based solutions accounted for 47.2% of the Smart Toys Market share in 2025.
  • NFC/RFID connectivity is advancing at a 21.1% CAGR, fueled by tap-and-play physical-digital convergence.

• By Distribution Channel

  • Online stores represented 56.2% of Smart Toys Market sales in 2025, reflecting the dominance of D2C and marketplace channels.
  • Specialty and convenience stores are gaining traction as experiential retail formats let children trial connected products before purchase.

• By Region

  • North America commanded 36.2% of the 2025 Smart Toys Market, supported by mature e-commerce logistics and early-adopter demographics.
  • Asia-Pacific is forecast to register the highest regional CAGR at 15.60% through 2035.


Smart Toys Market Size and Forecast (2021–2035)

Market Research Future's sizing methodology combines bottom-up revenue modeling from manufacturer sell-through data with top-down validation using import-export trade flows, retail panel audits, and publicly disclosed company revenues. Historical figures (2021–2024) are reconciled against industry association reports, while the forecast (2026–2035) applies regression-weighted demand drivers calibrated to macroeconomic and demographic indicators.
Smart Toys Market Size and Forecast
Our Impact
Enabled $4.3B Revenue Impact for Fortune 500 and Leading Multinationals
Partnering with 2000+ Global Organizations Each Year
30K+ Citations by Top-Tier Firms in the Industry

Driver Impact Analysis

Driver ~% Impact on CAGR Geographic Relevance Impact Timeline
Kid-safe large language models & generative AI +2.5% Global Short-term (≤2 yr)
Government STEM-curriculum integration +1.8% Asia-Pacific, Europe Medium-term (2–4 yr)
Subscription-based content monetization +1.5% North America, Europe Short-term (≤2 yr)
5G & edge-computing enablement +1.3% North America, APAC Medium-term (2–4 yr)
Rising parental demand for screen-free play +1.0% Global Long-term (≥4 yr)
Retailer private-label smart toy programs +0.8% North America, Europe Medium-term (2–4 yr)
Emerging-market urbanization & income growth +0.7% South America, MEA Long-term (≥4 yr)


Kid-Safe Large Language Models and Generative AI

The 2025 update to the Federal Trade Commission’s COPPA Rule, effective April 2026, mandates explicit parental consent for children’s data used to train AI models. This regulatory framework protects minors from unregulated data harvesting. While generative AI usage among children is rising, the industry is shifting toward "privacy-by-design" architectures to ensure long-term regulatory compliance

.

Government STEM-Curriculum Integration

National education policies across Asia are embedding AI and robotics into primary curricula to foster digital literacy. China’s central government continues to prioritize systemic education funding, with total public expenditure on education reaching approximately 1.74 trillion RMB in the first five months of 2026. This institutional support transforms programmable learning tools into essential classroom infrastructure.


Subscription-Based Content Monetization

Toy manufacturers are transitioning toward service-oriented models to extend product engagement beyond initial hardware purchases. As children increasingly rely on digital tools for learning, subscription-based educational content provides recurring value. By integrating proprietary software updates, companies sustain user interest over extended lifecycles, moving away from legacy one-time sales toward stable, long-term digital relationships.


5G and Edge-Computing Enablement

Edge computing enables high-performance, low-latency processing for interactive robotics and educational tools. According to recent UNICEF data, children are adopting AI technology three times faster than adults, driving demand for responsive, always-on hardware. By processing complex tasks locally on edge-AI chips, manufacturers enhance device safety and performance, meeting the needs of a digitally-native generation.


Restraints Impact Analysis

Restraint ~% Impact on CAGR Geographic Relevance Impact Timeline
Children's data-privacy compliance costs –1.2% Global Short-term (≤2 yr)
Cybersecurity vulnerabilities in connected toys –1.0% North America, Europe Medium-term (2–4 yr)
High price sensitivity in emerging markets –0.8% South America, MEA, APAC Long-term (≥4 yr)
Screen-time backlash & parental skepticism –0.6% Global Medium-term (2–4 yr)
Fragmented wireless standards & interoperability –0.5% Global Short-term (≤2 yr)


Children's Data-Privacy Compliance Costs

Compliance with the 2025 COPPA Rule amendments and the EU’s Digital Services Act mandates rigorous data protection standards for all digital toy manufacturers. These regulations require comprehensive information security programs, impacting operational budgets. While compliance is vital to protect minors, it increases the technical overhead required to manage, store, and secure children’s sensitive biometric and personal data.

Cybersecurity Vulnerabilities

The European Cyber Resilience Act, requiring full compliance by December 2027, mandates that all internet-connected toys feature "secure-by-design" architectures. Manufacturers must now implement mandatory vulnerability-disclosure protocols and provide security updates throughout a product’s lifecycle. These requirements aim to mitigate risks such as unauthorized data access, ensuring that consumer safety standards keep pace with technological advancements.

High Price Sensitivity in Emerging Markets

The global toy market, projected to reach approximately USD 128.6 billion by the end of 2026, exhibits a strong preference for mid-tier pricing. In emerging economies, purchasing power remains concentrated in lower price brackets. As advanced, AI-enabled toys often exceed these thresholds, manufacturers face challenges in scaling unit volume without localized, cost-effective digital hardware solutions[12].


Smart Toys Market Opportunities

AI-Tutoring Companion Toys

Generative AI is increasingly shaping childhood education, with UNICEF reporting that over 13 million children now utilize AI tools for schoolwork. By developing dedicated AI-tutoring companions, manufacturers can capture the growing demand for personalized learning. This segment allows brands to transition beyond traditional retail toward high-value, educational hardware that directly supports children's developing cognitive and academic skills.


Drone-as-a-Service and Toy-as-a-Service Subscription Platforms

Shifting from one-time hardware sales to service-based subscription models provides a pathway for recurring revenue in price-sensitive global markets. By decoupling software content from physical devices, companies lower initial entry barriers for consumers. This model fosters long-term relationships, allowing manufacturers to provide continuous updates and educational content that evolve alongside the child’s learning needs.


Emerging-Market Government Procurement

Institutional demand is accelerating as nations prioritize digital literacy. India’s Atal Innovation Mission has already established over 10,000 Atal Tinkering Labs, providing students with robotics and IoT kits. Similarly, Brazil has committed significant resources, including R$66 billion via BNDES and FINEP for innovation financing through 2028, creating stable B2G procurement channels for standardized, curriculum-aligned educational hardware.

Data-Driven Content Monetization

Aggregated, privacy-compliant play-pattern analytics offer insights into curriculum efficacy and child development. By leveraging these anonymized datasets, manufacturers can refine educational content and recommendation engines to support learning outcomes better. Adhering to strict data-protection frameworks ensures that these insights are used ethically, transforming hardware development into an evidence-based practice that enhances both user engagement and product value.


Sustainability-Led Product Differentiation

Global plastic production exceeds 400 million tons annually, prompting urgent calls for circularity. Under the EU’s Ecodesign for Sustainable Products Regulation (ESPR), manufacturers are now moving toward modular, repairable designs and the Digital Product Passport. Brands that integrate these sustainable, "secure-by-design" practices align with global environmental mandates, appealing to the growing demographic of environmentally conscious consumers and families.


Smart Toys Market Future Outlook

Generative AI and Autonomous Companion Intelligence

By 2030, on-device large language models will enable autonomous conversational companions that function without cloud connectivity. This technological shift directly addresses critical parental privacy concerns while expanding the market into regions with limited broadband infrastructure. As privacy-focused "edge AI" becomes a standardized industry requirement, manufacturers are pivoting toward secure, local-processing hardware to protect sensitive user data.

Platform Economics and Ecosystem Lock-In

The market is shifting toward platform-centric business models where a single companion application orchestrates a family of interoperable hardware. By creating integrated digital ecosystems, brands increase user retention and customer lifetime value. As consumers increasingly prioritize cohesive, multi-device play experiences, households with connected platforms are expected to outpace single-SKU purchasers in annual spending significantly.

Sustainability and Circular-Design Mandates

Under the EU’s Ecodesign for Sustainable Products Regulation, electronic toys are transitioning toward strict circularity requirements. Manufacturers must now incorporate modular, repairable designs and utilize digital product passports to ensure transparency. Brands that proactively adopt these sustainable frameworks will maintain market access in Europe, whereas those failing to meet repairability and recycling standards face potential exclusion.


Inclusive and Accessible Play

Accessibility-driven design represents a vital commercial and social frontier. With UNICEF reporting that nearly 240 million children globally live with disabilities, inclusive toys—such as those featuring voice-guided interfaces or adaptive controllers—are becoming essential. Brands that invest in these accessible product roadmaps tap into an underserved population, aligning with global mandates for equitable, inclusive educational opportunities.


Smart Toys Market Segmentation

By Interfacing Device

Segment Key Metric Primary Demand Driver
Smartphone-Connected 40.8% share (2025) Companion-app ecosystem maturity
Tablet-Connected USD 6.85 Billion (2025) Classroom tablet proliferation
Console/Other-Connected CAGR 23.4% (2026–2035) AR-peripheral integration with gaming consoles


Smartphone-connected toys dominate the Smart Toys Market by interfacing device because virtually every parent already owns the companion hardware. Bluetooth Low Energy pairing and lightweight companion apps reduce setup friction, allowing brands to deliver software updates and new play experiences without additional hardware investment. This segment benefits from a self-reinforcing loop: more companion apps attract more developers, which broadens content libraries, which drives further adoption.

Console-connected toys are the fastest-growing sub-segment as major gaming platforms introduce AR-toy peripherals that overlay digital characters onto physical play spaces. The convergence of console processing power with tactile toy play is creating a hybrid entertainment category that commands average selling prices 40–60% above smartphone-connected equivalents.

By Technology

Segment Key Metric Primary Demand Driver
Wi-Fi 47.2% share (2025) Always-on cloud content delivery
Bluetooth USD 7.14 Billion (2025) Low-power, low-cost pairing simplicity
NFC/RFID and Others CAGR 21.1% (2026–2035) Tap-and-play physical-digital bridging


Wi-Fi remains the backbone of the Smart Toys Market technology stack, enabling OTA firmware updates, real-time multiplayer interactions, and cloud-based AI processing. Bluetooth serves as the workhorse for battery-constrained toys where continuous cloud connectivity is unnecessary. NFC/RFID is the breakout sub-segment, driven by "tap-to-play" collectible figures that unlock digital content when placed on a reader pad — a mechanic popularized by Skylanders and now expanding into educational contexts.

By Distribution Channel

Segment Key Metric Primary Demand Driver
Online Stores 56.2% share (2025) D2C channels, marketplace algorithms
Specialty and Convenience Stores CAGR 16.80% (2026–2035) Experiential retail, in-store demo zones


Online stores control the majority of Smart Toys Market distribution because digital advertising allows precise targeting of parent demographics, and marketplace reviews reduce purchase-risk anxiety for premium-priced connected toys. Specialty retailers are counter-attacking with experiential formats — in-store coding workshops, robot battle arenas — that let children experience smart toys before purchase, driving conversion rates that pure e-commerce channels struggle to match.


Regional Market Share Analysis

Region Key Metric (2025) Primary Investment Themes
North America 36.2% revenue share Ed-tech integration, AI-companion toys
Europe 25.8% revenue share Data privacy compliance, sustainability
Asia-Pacific CAGR 15.60% (2026–2035) STEM-curriculum mandates, 5G enablement
South America USD 1.68 Billion Government procurement, localization
Middle East & Africa USD 1.52 Billion Urbanization, early-stage retail build-out
Total USD 23.33 Billion


North America

Country Key Metric Key Driver
United States 72.5% of regional share COPPA-compliant AI-toy ecosystem maturity
Canada 16.8% of regional share Bilingual (EN/FR) product demand
Mexico CAGR 12.40% Rising middle-class discretionary spend


The United States drives the Smart Toys Market in North America through a combination of high per-capita toy spending (approximately USD 340 per child annually) and a well-established direct-to-consumer digital infrastructure [1]. Amazon, Walmart, and Target have each launched curated "smart play" storefronts that give connected toys prominent merchandising. Canada's bilingual requirements create a niche for NLP-driven toys offering French-English code-switching, while Mexico's expanding middle class is adopting entry-level smart toys through Mercado Libre and convenience-store distribution.

Europe

Country Key Metric Key Driver
Germany 24.3% of regional share Engineering-toy tradition, strong R&D base
United Kingdom 21.6% of the regional share Early smart-toy adoption, BBC micro: bit legacy
France CAGR 11.80% Government coding curriculum expansion
Italy USD 0.68 Billion Growing e-commerce toy penetration
Spain CAGR 10.90% Affordable robotics-kit demand
Nordic Countries 12.4% of regional share Sustainability-first consumer preference
Russia USD 0.29 Billion Import-substitution incentives
Rest of Europe CAGR 10.50% Eastern European digital-literacy programs


Europe's Smart Toys Market benefits from stringent safety and data standards — the CE mark and GDPR — that raise the quality floor and build consumer confidence. Germany's deep engineering-toy heritage (Fischertechnik, LEGO's Billund-adjacent operations) keeps it at the forefront of STEM-toy R&D. At the same time, the UK leverages the BBC micro: bit ecosystem to bridge classroom coding with home-play experiences [16].

Asia-Pacific

Country Key Metric Key Driver
China 38.5% of regional share AI-literacy national mandate
India CAGR 17.20% Atal Innovation Mission procurement
Japan USD 1.05 Billion Character-IP-driven connected toy culture
South Korea CAGR 14.80% 5G smart-play arenas
ASEAN 11.2% of regional share Rising urbanization and smartphone penetration
Rest of Asia-Pacific CAGR 13.10% Expanding e-commerce logistics


Asia-Pacific represents the fastest-growing geography for the Smart Toys Market. China's State Council has embedded AI and robotics into primary-education benchmarks, creating an institutional demand channel that rivals consumer retail in volume [6]. India's combination of a massive under-14 population (approximately 370 million children) and rapidly expanding 4G/5G coverage positions it as the region's highest-CAGR country for connected play products.

South America

Country Key Metric Key Driver
Brazil 62.5% of regional share BNDES innovation-fund subsidies
Argentina CAGR 11.50% Ed-tech startup ecosystem
Rest of South America USD 0.35 Billion Early-stage market development


Brazil dominates the South American Smart Toys Market, supported by government innovation subsidies and a youthful demographic profile. Local-language Portuguese NLP remains a barrier, but domestic startups are partnering with global AI vendors to close the gap. Argentina's ed-tech community is piloting affordable coding kits in public schools through municipal procurement programs.

Middle East & Africa

Country Key Metric Key Driver
Saudi Arabia 28.4% of regional share Vision 2030 education modernization
UAE CAGR 13.60% Smart-city ecosystem integration
South Africa USD 0.18 Billion Private-school technology adoption
Egypt CAGR 12.30% Youth-population dividend
Rest of MEA 22.8% of regional share NGO-funded STEM initiatives


The Middle East & Africa region is an early-stage but high-potential frontier for the Smart Toys Market. Saudi Arabia's Vision 2030 framework includes explicit ed-tech procurement targets for K–12 schools, while the UAE's smart-city programs create living-lab environments where connected toys are integrated into public play spaces and libraries [17].


Smart Toys Market By Region, 2025-2035

Competitive Benchmarking

The Smart Toys Market exhibits moderate concentration, with the top five players collectively accounting for an estimated 49% of 2024 global revenue. The Herfindahl-Hirschman Index sits in the 800–1,100 range, indicating a competitive but not fragmented landscape. Incumbents leverage IP portfolios and retail shelf access, while challengers compete on AI capability and curriculum alignment.

Company Est. Revenue Share Range Key Offerings for Smart Toys Market Strategic Positioning
Mattel, Inc. ~10–14% AI-enabled Barbie, Hot Wheels ID, Fisher-Price Smart Stages Legacy-IP digitization, mass-market scale
LEGO Group ~10–13% LEGO Education SPIKE, LEGO Super Mario, LEGO Hidden Side Premium STEM ecosystem, modular play
Hasbro, Inc. ~8–11% FurReal, Transformers AR, Nerf digital integration Character-IP licensing, omnichannel reach
Spin Master Corp. ~6–9% Hatchimals, Meccano coding kits, PAW Patrol AR Innovation pipeline, rapid SKU rotation
WhalesBot ~3–5% Programmable robotics kits (K–12) STEM-curriculum partnerships, APAC strength
VTech Holdings ~5–8% KidiZoom, LeapFrog Academy, Switch & Go Dinos Early-childhood specialization, value tier
Sphero, Inc. ~2–4% BOLT, indi, SPRK+ Coding-first pedagogy, educator channel
Tangible Play (Osmo) ~2–4% Osmo Genius, Osmo Coding, Osmo Pizza Co. Physical-digital convergence, iPad anchor
Wonder Workshop ~1–3% Dash & Dot, Cue robots Block-based coding, classroom bundles
Bandai Namco Holdings ~2–4% Tamagotchi Smart, Vital Bracelet Character-IP monetization, Japan/APAC focus


Recent News & Developments

  • LEGO Group (January, 2026)—LEGO launched its "Smart Play" system featuring interactive Smart Bricks, Tags, and Minifigures that utilize custom ASIC-based motion sensing technology.
  • Mattel, Inc. (December, 2025)—Mattel officially delayed its planned consumer-facing generative AI toy product line, citing increased regulatory scrutiny regarding AI safety for minor-aged users.
  • Spin Master Corp. (February, 2026)—Spin Master unveiled its 2026 interactive portfolio, including the "Bitzee Aquarium" and "Peekimo," featuring advanced LED-responsive and child-nurturing AI hardware features.


Smart Toys Market Report Scope

Parameter Details
Market Scope Global Smart Toys Market by Interfacing Device, Technology, Distribution Channel, and Geography
Study Period 2021–2035
CAGR (Forecast) 11.10% (2026–2035)
Market Size — Base Year USD 23.33 Billion (2025)
Market Size — Forecast Endpoint USD 66.85 Billion (2035)
Fastest Growing Segment Console/Other-Connected (By Interfacing Device); NFC/RFID (By Technology)
Companies Profiled Mattel, LEGO, Hasbro, Spin Master, WhalesBot, VTech, Sphero, Tangible Play (Osmo), Wonder Workshop, Bandai Namco
Valuation Currency USD Billion


FAQs

How should institutional investors evaluate unit economics in the Smart Toys Market?
Focus on subscription-attach rate and content-renewal revenue per device. Companies sustaining renewal rates above 60% typically achieve 2–3× higher customer lifetime value than hardware-only peers [9].
What cybersecurity certifications should procurement teams require for connected toy vendors?
Require compliance with ETSI EN 303 645 for consumer IoT and UL 2900 for software cybersecurity. These two standards cover default password elimination, encrypted data transit, and vulnerability-disclosure obligations [13].
How does the EU AI Act's high-risk classification affect Smart Toys Market product launches?
AI-enabled toys targeting children require a conformity assessment, technical documentation, and post-market monitoring before EU market entry. Budget 6–12 months of additional pre-launch compliance work [21].
What distinguishes the Smart Toys Market from the broader ed-tech sector?
Smart toys combine tactile, physical play with digital interactivity, differentiating them from screen-only ed-tech. The physical component drives engagement metrics 30–40% higher than tablet-only learning apps [10].
Which emerging connectivity protocol is most likely to disrupt Bluetooth dominance in smart toys?
Ultra-wideband (UWB) offers centimeter-level spatial awareness, enabling room-scale interactive play. Adoption hinges on chipset costs dropping below USD 1.50, which analysts expect by 2029 [14].
How can toy makers protect margins against retailer private-label competition in the Smart Toys Market?
Build proprietary content ecosystems that private-label brands cannot replicate. AI-driven adaptive content and exclusive IP licensing create defensible moats beyond hardware specifications [11].
What role do emerging-market demographics play in the long-term Smart Toys Market trajectory?
India, Nigeria, and Indonesia collectively have over 500 million children under 14. Even modest penetration at low price points could add USD 3–5 billion in incremental revenue by 2033 [12].    
Author
Author
Author Profile
Ankit Gupta LinkedIn
Team Lead - Research
Ankit Gupta is a seasoned market intelligence and strategic research professional with over six plus years of experience in the ICT and Semiconductor industries. With academic roots in Telecom, Marketing, and Electronics, he blends technical insight with business strategy. Ankit has led 200+ projects, including work for Fortune 500 clients like Microsoft and Rio Tinto, covering market sizing, tech forecasting, and go-to-market strategies. Known for bridging engineering and enterprise decision-making, his insights support growth, innovation, and investment planning across diverse technology markets.

Research Approach


Secondary Research

The secondary research process involved comprehensive analysis of toy safety regulatory frameworks, IoT device standards, peer-reviewed child development journals, consumer product safety databases, and education technology publications. Key sources included the US Consumer Product Safety Commission (CPSC), Federal Trade Commission (FTC) for Children's Online Privacy Protection Rule (COPPA) compliance data, Federal Communications Commission (FCC) equipment authorization databases, US Customs and Border Protection import statistics for electronic toys, European Commission's Toy Safety Directive (2009/48/EC) and EN 71 standards documentation, International Organization for Standardization (ISO 8124 series for toy safety), National Institute of Standards and Technology (NIST) cybersecurity guidance for IoT devices, ASTM International (F963-17 toy safety standard), The Toy Association (US market data), International Council of Toy Industries (ICTI) ethical manufacturing reports, National Association for the Education of Young Children (NAEYC) technology position statements, American Academy of Pediatrics (AAP) digital media guidelines for children, NPD Group/Circana toy industry retail tracking databases, UNESCO Institute for Statistics (education technology adoption), World Bank education expenditure data, and national statistical offices (US Census Bureau, Eurostat, China's National Bureau of Statistics) for demographic and household expenditure data. These sources were utilized to collect product safety incident statistics, regulatory compliance requirements, STEM education policy trends, wireless spectrum allocation data, import/export trade flows for electronic educational toys, demographic cohort analysis for target age segments, and competitive landscape mapping for AI-enabled and connected toy technologies.


Primary Research

In order to gather qualitative and quantitative information on technology adoption, content production tactics, and parental purchase behaviors, supply-side and demand-side players were interviewed as part of the primary research process. CEOs, CTOs, VPs of Product Innovation, heads of AI/ML development, regulatory compliance officers from smart toy manufacturers, semiconductor suppliers for toy applications, developers of educational software, and IoT platform providers catering to the toy sector were among the supply-side sources. Primary school technology coordinators, procurement directors from early childhood education centers and STEM learning institutions, toy and game category buyers from major retail chains and e-commerce platforms, child development psychologists, pediatric occupational therapists, and parent focus groups representing households with children across the target age demographics (toddlers through stripling/adolescents) were all examples of demand-side sources. Technology integration roadmaps, content moderation and data privacy protocols, price sensitivity across distribution channels, and demand patterns for instructional versus entertainment-focused smart toy categories were all validated by primary research.

Primary Respondent Breakdown:

• By Designation: C-level Primaries (30%), Director Level (35%), Others (35%)

• By Region: North America (40%), Europe (25%), Asia-Pacific (28%), Rest of World (7%)


Market Size Estimation

Global market valuation was derived through revenue mapping, unit shipment analysis, and installed base calculations for connected devices. The methodology included:

• Identification of 50+ key manufacturers and technology enablers across North America, Europe, Asia-Pacific, Latin America, and Middle East & Africa, including traditional toy manufacturers, educational technology specialists, and AI/robotics startups

• Product mapping across educational robots, interactive screen-based games, app-enabled physical toys, AI voice-interactive devices, augmented reality toys, and STEM coding kits

• Technology segmentation analysis covering Wi-Fi enabled toys, Bluetooth connected devices, RFID/NFC interactive products, and standalone AI processors

• Channel analysis covering direct-to-consumer e-commerce, brick-and-mortar toy retail, educational institutional sales, and consumer electronics channels

• Analysis of reported and modeled annual revenues specific to connected toy and educational technology portfolios, average selling price (ASP) trends by connectivity type and functionality tier

• Coverage of manufacturers and platform providers representing 72-78% of global market share in 2024

• Extrapolation using bottom-up (age-cohort population × penetration rate × ASP by country) and top-down (manufacturer revenue validation and category spend analysis) approaches to derive segment-specific valuations for robots, interactive games, and educational robot sub-categories

• Validation against retail audit data for unit shipments and consumer expenditure surveys for household toy budgeting patterns

Download Free Sample

Kindly complete the form below to receive a free sample of this Report

Download PDF ×

We do not share your information with anyone. However, we may send you emails based on your report interest from time to time. You may contact us at any time to opt-out.
















