Smart Waste Management Market (2026 - 2035)

Smart Waste Management Market Size, Share and Research Report By Solution (Fleet Management, Asset Management, Analytics & Reporting, Customer Management), By End User (Municipal / Government, Industrial / Commercial, Residential), By Waste Type (Solid Waste, Hazardous Waste, E-Waste, Other (Organic, Medical)) and By Regional (North America, Europe, South America, Asia Pacific, Middle East and Africa) - Industry Forecast to 2035.
ID: MRFR/ICT/0488-CR
200 Pages
Aarti Dhapte
Last Updated: July 10, 2026
Smart Waste Management Market
Market Size
Forecast Period2026-2035
CAGR (2026-2035)16.5%
2025 Market SizeUSD 3.18 Billion
2035 Market SizeUSD 14.64 Billion
Key Players
Bigbelly
Enevo
Sensoneo
Waste Robotics
Compology
Ecube Labs
Opportunities
  • Waste-as-a-Service Business Models
  • Carbon-Credit Integration and Data Monetization
  • Emerging-Market Leapfrogging

Smart Waste Management Market Summary

The Smart Waste Management Market reached an estimated USD 3.18 billion in 2025 and is projected to grow from USD 3.70 billion in 2026 to USD 14.64 billion by 2035, registering a CAGR of 16.5% during the forecast period (2026–2035). Two forces are accelerating this trajectory: the European Union's revised Waste Framework Directive mandating 65% municipal recycling rates by 2035, and the USD 3.5 billion allocated under the U.S. Infrastructure Investment and Jobs Act for solid-waste modernization [1][2]. Cities that once relied on fixed collection schedules and manual bin checks are now under regulatory and fiscal pressure to digitize operations.

The transition in technology is essential. Sensor-enabled containers, cloud-based analytics platforms and AI-powered collection scheduling are replacing older fleet dispatch systems that rely on static routing and paper manifests. The World Bank says global yearly trash generation will approach 3.4 billion tons by 2050, yet less than 30% of cities in high-income countries have linked waste infrastructure [3]. The Smart Waste Management Market’s main value proposition is to bridge that gap, accomplishing more with less, via real-time data and predictive logistics.


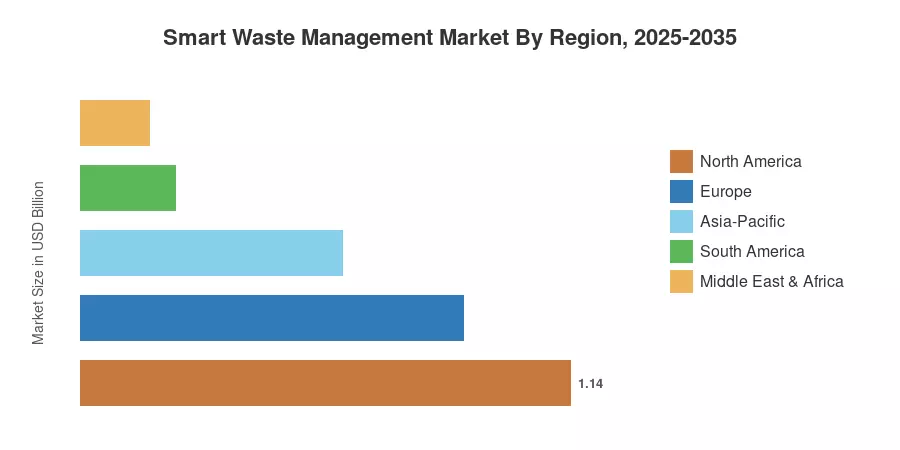
North America continues to lead the pack at about 36% market share, supported by early municipal IoT deployments in U.S. and Canadian metros. Asia Pacific is the fastest expanding area with a predicted CAGR of 19.2% fueled by rising urbanization in India, China and Southeast Asia. Europe holds the second-highest share with 28%, bolstered by tough circular economy legislation. As landfill taxes rise and ESG reporting requirements tighten, the Smart Waste Management Market is set to become an essential part of municipal infrastructure, not a discretionary update.


Key Report Takeaways

• By Solution

  • Fleet management platforms dominate with approximately 32% share of the Smart Waste Management Market, reflecting demand for dynamic routing and fuel-cost reduction across municipal fleets.
  • Analytics and reporting solutions are the fastest-growing solution segment at a 19.1% CAGR, as cities seek predictive fill-level insights and compliance dashboards.

• By End User

  • Municipal and government agencies account for the largest share of the Smart Waste Management Market at roughly 42%, driven by regulatory mandates and public sustainability targets.
  • Industrial and commercial end users are projected to reach USD 5.12 billion by 2035 as private enterprises integrate waste tracking into ESG reporting workflows.

• By Geography

  • North America leads with a 36% share, supported by federal infrastructure spending and mature municipal procurement cycles.
  • Asia-Pacific is expected to register the highest regional CAGR of 19.2% through 2035.
  • Europe contributes 28% of global revenue, propelled by the EU Circular Economy Action Plan.


Smart Waste Management Market Size and Forecast (2021–2035)

Market sizing is based on a bottom-up model of municipal budgets, enterprise waste-management contracts and technology-vendor revenues in 42 countries. Historical figures (2021-2024) are based on data from public procurement databases, firm filings and validated industry surveys. Forecast forecasts (2026–2035) are derived from macroeconomic factors, regulatory delays, and adoption-curve benchmarks of similar municipal-tech categories.
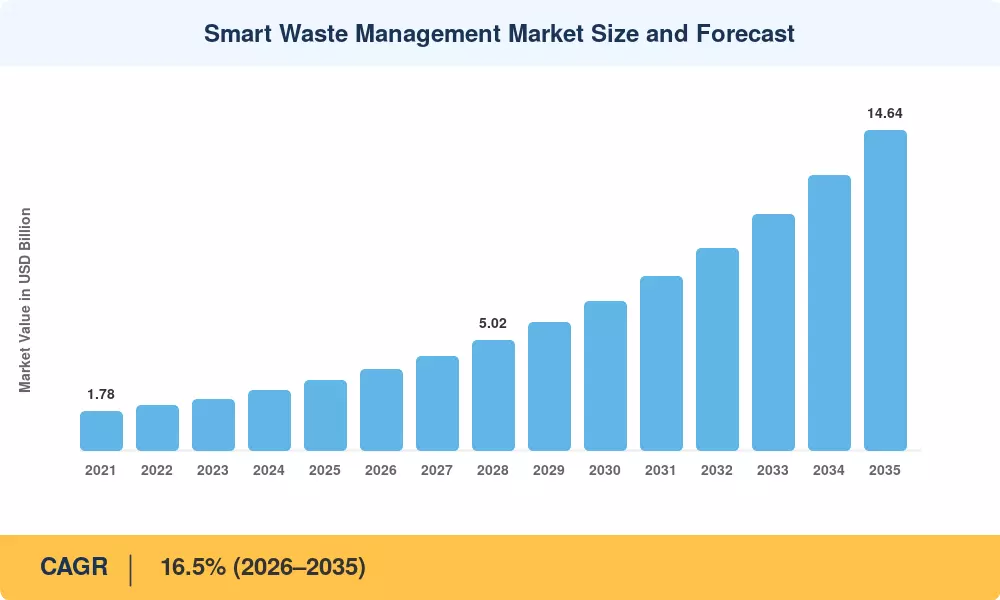
Smart Waste Management Market Size and Forecast
Our Impact
Enabled $4.3B Revenue Impact for Fortune 500 and Leading Multinationals
Partnering with 2000+ Global Organizations Each Year
30K+ Citations by Top-Tier Firms in the Industry

Driver Impact Analysis

Driver ~% Impact on CAGR Geographic Relevance Impact Timeline
Municipal digitization mandates ~22% Global Short-term (≤2 yr)
Urbanization and waste-volume growth ~20% Asia-Pacific, Africa Long-term (≥4 yr)
Landfill diversion regulations ~18% Europe, North America Medium-term (2–4 yr)
IoT and 5G infrastructure expansion ~15% Global Short-term (≤2 yr)
ESG reporting and corporate sustainability mandates ~10% North America, Europe Medium-term (2–4 yr)
AI and machine-learning analytics maturation ~9% North America, Asia-Pacific Long-term (≥4 yr)
Declining sensor and hardware costs ~6% Global Short-term (≤2 yr)


Municipal Digitization Mandates

Governments are no longer just encouraging digital waste collection — they are mandating it. The EU's revised Waste Framework Directive requires member states to implement tracking and reporting systems for municipal solid waste by 2028, while the U.S. EPA's Smart Cities Waste Initiative allocated USD 450 million in competitive grants for sensor-equipped collection infrastructure between 2024 and 2026 [1][2]. These mandates create a compliance-driven demand floor that insulates the Smart Waste Management Market from discretionary budget cuts.

Urbanization and Waste-Volume Growth

The World Bank projects that global waste generation will increase by 73% from 2020 levels by 2050, with the sharpest growth concentrated in South Asia and Sub-Saharan Africa [3]. Cities like Lagos, Dhaka, and Jakarta are already experiencing collection-capacity shortfalls that conventional systems cannot close. The Smart Waste Management Market directly addresses this gap through fill-level sensing and dynamic scheduling that can increase collection efficiency by 30–40% without proportional fleet expansion [8].

Landfill Diversion and Circular-Economy Regulation

Landfill taxes in the EU now exceed EUR 100 per tonne in several member states, and the UK's landfill tax escalator reached GBP 103.70 per tonne in 2025 [12]. These cost penalties make real-time contamination detection and sorting verification economically compelling. For municipalities, deploying connected containers with contamination alerts reduces landfill-bound volumes and avoids escalating tax liabilities — a direct financial case for the Smart Waste Management Market.

ESG Reporting and Corporate Sustainability

The SEC's climate-disclosure rule and the EU Corporate Sustainability Reporting Directive now require publicly traded firms to report Scope 3 emissions, which include waste-management activities across supply chains [10]. This regulatory shift has turned waste data from an operational metric into a boardroom concern, driving enterprise-grade demand for auditable, sensor-verified waste-stream tracking within the Smart Waste Management Market.


Restraints Impact Analysis

Restraint ~% Negative Impact on CAGR Geographic Relevance Impact Timeline
High upfront deployment costs ~–25% Emerging markets Short-term (≤2 yr)
Fragmented municipal procurement processes ~–20% Global Medium-term (2–4 yr)
Data privacy and cybersecurity concerns ~–18% Europe, North America Long-term (≥4 yr)
Legacy infrastructure integration challenges ~–22% Global Medium-term (2–4 yr)
Limited connectivity in rural areas ~–15% Africa, South Asia Long-term (≥4 yr)


High Upfront Deployment Costs

Equipping a mid-size city of 500,000 residents with sensor-enabled bins, gateway infrastructure, and a cloud analytics platform can require USD 8–15 million in initial capital expenditure [13]. For municipalities in developing economies where annual waste-management budgets may total USD 2–5 million, this cost profile creates a prohibitive barrier — even when lifecycle savings justify the investment within four to five years.

Fragmented Procurement Processes

Municipal procurement cycles in North America and Europe average 18–24 months from RFP to contract award, and interoperability standards remain inconsistent across jurisdictions [14]. Vendors in the Smart Waste Management Market frequently face different data-format requirements, API specifications, and integration mandates from neighboring cities within the same metropolitan area, fragmenting development resources and slowing regional scale-up.

Data Privacy and Cybersecurity

Connected waste infrastructure generates granular location and behavioral data that falls under GDPR and equivalent privacy frameworks. The European Data Protection Board issued guidance in 2024 clarifying that waste-bin sensor data linked to household addresses constitutes personal data [15]. Compliance adds cost and design constraints that slow deployments, particularly in privacy-sensitive markets.


Smart Waste Management Market Opportunities

Waste-as-a-Service Business Models

The shift from capital-intensive procurement to subscription-based Waste-as-a-Service (WaaS) models lowers the entry barrier for cash-constrained municipalities. Vendors that bundle sensors, software, and maintenance into per-bin monthly fees can convert the high-upfront-cost restraint into recurring-revenue contracts. Early WaaS pilots in Scandinavian cities have demonstrated 25–30% faster adoption timelines compared with traditional procurement paths [14].

Carbon-Credit Integration and Data Monetization

Waste-diversion data verified through connected sensors can generate tradeable carbon credits under voluntary and compliance carbon markets. The Smart Waste Management Market stands to benefit as municipalities and corporations seek verified emissions-reduction documentation for Scope 3 reporting. Platforms that link real-time diversion metrics to carbon registries open an entirely new revenue layer beyond operational savings.

Emerging-Market Leapfrogging

Cities in India, Nigeria, and Indonesia that lack legacy waste infrastructure can deploy smart systems as their first-generation collection platform rather than retrofitting analog operations. India's Swachh Bharat Mission 2.0 allocated INR 1.41 lakh crore (approximately USD 17 billion) for urban sanitation, with digital waste monitoring as a qualifying expenditure [8]. This leapfrog dynamic positions the Smart Waste Management Market for rapid penetration in high-growth urban corridors.

Autonomous Collection Vehicles

The convergence of autonomous driving technology with waste collection creates an opportunity for fully automated pickup operations. Volvo and several robotics startups are running pilot programs for autonomous side-loaders in controlled environments, targeting commercial deployment by 2030 [9]. Integration with IoT bin monitoring platforms would enable end-to-end autonomous waste logistics.

AI-Powered Contamination Detection

Computer-vision systems installed on collection trucks or at transfer stations can identify recycling-stream contaminants in real time, reducing contamination rates from 25% to below 5% [7]. This capability directly supports landfill-diversion mandates and positions the Smart Waste Management Market as a compliance enabler.


Smart Waste Management Market Future Outlook

AI-Driven Autonomous Waste Operations

Artificial intelligence will move from route optimization into full operational autonomy by the early 2030s. Predictive fill-level algorithms will trigger collection events without human scheduling, and computer vision will automate contamination screening at transfer points. The IEA estimates that AI-optimized municipal services could reduce urban energy consumption by 10–15% by 2035, with waste logistics as a primary beneficiary [7][21].

Platform Consolidation and Ecosystem Economics

The Smart Waste Management Market is transitioning from point-solution sales to integrated platform ecosystems. Vendors that control the data layer — from bin-level sensors to analytics dashboards to ERP integration — will capture disproportionate value. Expect top-five vendor concentration to increase from an estimated 28% in 2025 to over 40% by 2032 as smaller players are acquired or displaced.

Circular-Economy Integration

By the late 2020s, the Smart Waste Management Market will extend beyond collection logistics into material-flow tracking across entire circular-economy value chains. Digital product passports mandated under the EU Ecodesign for Sustainable Products Regulation will require end-of-life tracking that integrates with waste-management platforms [1][22]. This expansion redefines the market's addressable scope.

ESG and Carbon-Market Linkage

Corporate net-zero commitments covering Scope 3 emissions will make waste-stream data a compliance asset. The voluntary carbon market, projected to reach USD 50 billion by 2030 according to BloombergNEF, will increasingly accept verified waste-diversion credits [10][23]. The Smart Waste Management Market is positioned to serve as the data infrastructure layer for this emerging carbon-waste nexus.


Smart Waste Management Market Segmentation

By Solution

Segment Primary Metric Primary Demand Driver
Fleet Management 32% share (2025) Fuel-cost reduction and route efficiency
Asset Management USD 0.89B (2025) Container tracking and maintenance scheduling
Analytics & Reporting 19.1% CAGR Regulatory compliance dashboards
Customer Management 18% share (2025) Citizen-engagement apps and billing integration


Fleet management remains the foundation of the Smart Waste Management Market because collection logistics represent 50–70% of total municipal waste-management operating costs. Dynamic routing platforms that cut unnecessary pickups by 20–30% deliver immediate, measurable ROI — making them the entry point for most municipal buyers. Analytics and reporting are the fastest-growing solution category, fueled by regulatory requirements for auditable recycling and diversion data.

Asset management is expanding as cities scale from pilot programs of a few hundred connected containers to city-wide deployments of tens of thousands. Predictive maintenance algorithms that flag damaged or malfunctioning bins before they cause service disruptions are driving upgrade cycles within the Smart Waste Management Market.

By End User

Segment Primary Metric Primary Demand Driver
Municipal / Government 42% share (2025) Regulatory mandates and public sustainability targets
Industrial / Commercial 17.8% CAGR ESG reporting, operational cost reduction
Residential USD 0.73B (2025) Smart-city citizen-engagement programs


Municipal and government agencies constitute the largest end-user segment in the Smart Waste Management Market, driven by mandated recycling targets, public-health obligations, and political pressure to demonstrate sustainability progress. Procurement cycles are long, but contract values are substantial, typically spanning five to seven years.

Industrial and commercial end users represent the fastest-growing segment as enterprises face escalating ESG disclosure requirements. Large retailers, logistics operators, and food-service chains are deploying waste-stream analytics to quantify and reduce waste footprints — often as part of broader Scope 3 emissions-reduction strategies within the Smart Waste Management Market.

By Waste Type

Segment Primary Metric Primary Demand Driver
Solid Waste 45% share (2025) High-volume municipal collection requirements
Hazardous Waste 20.4% CAGR Regulatory tracking and compliance mandates
E-Waste USD 0.57B (2025) Extended producer responsibility legislation
Other (organic, medical) 17% share (2025) Specialized handling and diversion targets


Solid waste dominates the Smart Waste Management Market by volume and revenue, as it represents the broadest collection footprint for municipal and commercial customers. Hazardous-waste tracking is emerging as the fastest-growing waste-type segment because regulatory penalties for non-compliance are severe, and paper-based tracking creates unacceptable risk exposure.


Regional Market Share Analysis

Region Primary Metric Primary Investment Themes
North America 36% share (2025) Federal infrastructure grants, smart-city pilots
Europe USD 0.89B (2025) Circular-economy mandates, landfill taxation
Asia-Pacific 19.2% CAGR (2026–2035) Urbanization, national sanitation programs
South America 7% share (2025) Metropolitan pilots in Brazil, public health drivers
Middle East & Africa USD 0.16B (2025) Vision 2030 programs, rapid urban growth
Total USD 3.18B (2025)

The Smart Waste Management Market exhibits clear regional stratification, with North America and Europe commanding mature-market positions while Asia-Pacific drives the highest growth rates. Regulatory intensity and municipal budget structures explain much of this divergence.


North America

Country Primary Metric Key Driver
United States 78% of regional share EPA Smart Cities grants, municipal IoT mandates
Canada 15.8% CAGR Federal carbon-reduction targets
Mexico USD 0.04B (2025) CDMX smart-infrastructure plan


North America's leadership in the Smart Waste Management Market reflects both regulatory push and technology-vendor concentration. The U.S. alone accounts for over three-quarters of regional revenue, with cities including San Francisco, New York, and Chicago operating large-scale connected-container networks. Canada's Investing in Canada Infrastructure Program earmarked CAD 180 billion through 2028, with green infrastructure — including digital waste systems — as a priority stream [2][17].

Europe

Country Primary Metric Key Driver
Germany 24% of regional share Kreislaufwirtschaftsgesetz enforcement
United Kingdom 17.4% CAGR Landfill tax escalator, DEFRA digital strategy
France USD 0.11B (2025) Anti-Gaspillage legislation
Rest of Europe 38% of regional share EU Cohesion Fund digital-waste projects


Europe's Smart Waste Management Market is driven by the most aggressive regulatory framework globally. The EU Circular Economy Action Plan mandates that member states achieve 65% recycling of municipal waste by 2035, which requires granular tracking that only connected systems can provide [1]. Scandinavia leads in per-capita adoption, while Southern and Eastern European markets are scaling through EU Cohesion Fund allocations.

Asia-Pacific

Country Primary Metric Key Driver
China 35% of regional share National smart-city standards (GB/T 36333)
India 22.1% CAGR Swachh Bharat Mission 2.0
Japan USD 0.09B (2025) Resource-efficiency and aging-workforce automation
South Korea 16.8% CAGR Smart-city innovation zones
Rest of Asia-Pacific 28% of regional share ASEAN urbanization corridors


Asia-Pacific represents the highest-growth theater for the Smart Waste Management Market. China's Ministry of Housing and Urban-Rural Development designated 90 pilot cities for intelligent waste classification systems by 2025, while India's Swachh Bharat Mission 2.0 is directing billions toward digitized urban sanitation [8][18]. The region's rapid urbanization — projected to add 1.2 billion urban residents by 2050 — creates structural demand that will sustain above-average growth rates through 2035 [3].

South America

Country Primary Metric Key Driver
Brazil 62% of regional share São Paulo and Rio de Janeiro pilot deployments
Rest of South America 11.5% CAGR Inter-American Development Bank grants


Brazil dominates South America's Smart Waste Management Market, with São Paulo's AMLURB agency deploying connected-container pilots across 12 districts. The Inter-American Development Bank has provided concessional financing for digital waste infrastructure in Colombia, Chile, and Argentina, seeding adoption beyond Brazil [19].

Middle East & Africa

Country Primary Metric Key Driver
UAE 41% of regional share Abu Dhabi and Dubai smart-city strategies
Saudi Arabia 20.3% CAGR Vision 2030 NEOM and Jeddah projects
Rest of MEA USD 0.05B (2025) African Development Bank urban programs


Gulf Cooperation Council states are investing in the Smart Waste Management Market as part of broader smart-city agendas. Dubai's municipality targets zero landfill waste by 2030, creating an aggressive deployment timeline for connected waste infrastructure [20]. Sub-Saharan Africa remains nascent but represents a long-term growth frontier as urban populations double by 2050 [3].


Smart Waste Management Market By Region, 2025-2035

Competitive Benchmarking

The Smart Waste Management Market is somewhat fragmented, with an estimated HHI of approximately 650 and a top-five vendor share of approximately 28%. The market is region and municipal-contract-based and no single player has more than 8% of the worldwide revenue. The competition is about the platform’s breadth, the sensor hardware’s reliability and the analytical capacity.

Company Est. Revenue Share Range Key Offerings for Smart Waste Management Market Strategic Positioning
Bigbelly ~6–8% Solar-powered smart bins, CLEAN dashboard Pioneer in public-space connected containers
Enevo ~4–6% Fill-level sensors, collection analytics Data-first platform with strong European presence
Sensoneo ~3–5% Smart sensors, route planning, waste analytics End-to-end platform for municipalities
Waste Robotics ~2–4% AI-powered robotic sorting systems Sorting-facility automation specialist
Compology ~3–5% Camera-based container monitoring, AI analytics Contamination-detection focus for haulers
Ecube Labs ~3–5% CleanCUBE compacting bins, CleanCityNetworks Hardware-software bundle for Asian markets
Nordsense (Waste Vision) ~2–4% Ultrasonic sensors, predictive analytics Nordic-origin with expanding global footprint
SAP (Environment, Health, Safety) ~3–5% Enterprise waste-management modules ERP integration for corporate waste tracking
Rubicon Technologies ~3–5% Digital marketplace for waste services Platform connecting haulers and generators
TomTom / Bridgestone (Webfleet) ~2–3% Fleet telematics, route optimization Vehicle-centric entry into waste logistics


Recent News & Developments


  • SAP (October 2023): Released an integrated Environment, Health, and Safety module with waste-stream tracking aligned to CSRD reporting requirements, bridging the Smart Waste Management Market with enterprise compliance workflows [Ref 10].
  • Recology King County (April 2025): Recology King County deployed Glacier’s AI recycling robots at its Washington MRF, sorting 45 items per minute across 30 material types


Smart Waste Management Market Report Scope

Parameter Details
Market Scope Global Smart Waste Management Market covering solutions, end users, waste types, and regions
Study Period 2021–2035
CAGR 16.5% (2026–2035)
Market Size (2025) USD 3.18 Billion
Market Size (2035) USD 14.64 Billion
Fastest Growing Segment Analytics & Reporting (by solution); Asia-Pacific (by region)
Companies Profiled Bigbelly, Enevo, Sensoneo, Waste Robotics, Compology, Ecube Labs, Nordsense, SAP, Rubicon Technologies, TomTom/Webfleet
Valuation Currency USD (constant 2025 dollars)


FAQs

What total cost of ownership should a mid-size city budget for a smart waste deployment?
A typical city of 300,000–500,000 residents should budget USD 10–18 million over five years, covering sensors, connectivity, software licensing, and integration. Waste-as-a-Service models can convert this to monthly per-bin fees of USD 8–15 [13].
How do smart waste platforms handle interoperability across different sensor manufacturers?
Leading platforms use open APIs and standardized protocols such as MQTT and LoRaWAN to integrate sensors from multiple vendors. Cities should mandate open-architecture requirements in procurement RFPs to avoid vendor lock-in [16].
What cybersecurity risks are unique to connected waste infrastructure?
Bin-level sensor networks create attack surfaces for denial-of-service disruptions to collection schedules and potential data exfiltration of household waste patterns. Municipalities should require end-to-end encryption and SOC 2 compliance from vendors [15].
How do carbon-credit verification mechanisms apply to waste-diversion data?
Sensor-verified diversion metrics can qualify under voluntary carbon standards such as Verra's VCS program when paired with third-party audit protocols. This creates a monetizable data asset beyond operational savings [23].
What differentiates camera-based monitoring from ultrasonic fill-level sensors?
Camera systems enable contamination detection and material identification, but cost 3–4× more per unit than ultrasonic sensors, which only measure fill levels. The right choice depends on whether compliance monitoring or collection optimization is the primary objective [7].
How are waste-management contracts evolving to accommodate smart technology integration?
Municipalities are shifting from traditional five-year hauling contracts to performance-based agreements with technology clauses requiring real-time reporting dashboards and API data access. Contract lengths are extending to seven to ten years to amortize technology investments [14].
What role will digital product passports play in the future of the Smart Waste Management Market?
The EU's digital product passport mandate will require end-of-life tracking for electronics, textiles, and batteries by 2030. Smart waste platforms that integrate passport data will capture higher-value sorting and material-recovery contracts [22].    
Author
Author
Author Profile
Aarti Dhapte LinkedIn
AVP - Research
A consulting professional focused on helping businesses navigate complex markets through structured research and strategic insights. I partner with clients to solve high-impact business problems across market entry strategy, competitive intelligence, and opportunity assessment. Over the course of my experience, I have led and contributed to 100+ market research and consulting engagements, delivering insights across multiple industries and geographies, and supporting strategic decisions linked to $500M+ market opportunities. My core expertise lies in building robust market sizing, forecasting, and commercial models (top-down and bottom-up), alongside deep-dive competitive and industry analysis. I have played a key role in shaping go-to-market strategies, investment cases, and growth roadmaps, enabling clients to make confident, data-backed decisions in dynamic markets.

Research Approach


Secondary Research

The secondary research process involved comprehensive analysis of regulatory databases, municipal records, peer-reviewed environmental journals, technology publications, and authoritative environmental agencies. Key sources included the United States Environmental Protection Agency (EPA), European Environment Agency (EEA), United Nations Environment Programme (UNEP), International Solid Waste Association (ISWA), World Bank Urban Development Database, Organisation for Economic Co-operation and Development (OECD) Environmental Statistics, Eurostat Waste Statistics, National Institute of Standards and Technology (NIST) Smart City Standards, International Telecommunication Union (ITU) IoT Reports, National Waste & Recycling Association (NWRA), Chartered Institution of Wastes Management (CIWM), NSF International Standards, Underwriters Laboratories (UL) Environmental Standards, International Organization for Standardization (ISO) 14000 Series, Smart Cities Council Research, McKinsey Global Institute Urban Reports, and municipal sustainability reports from key metropolitan areas (Barcelona Smart City, Singapore Smart Nation, Amsterdam Smart City). These sources were used to collect waste generation statistics, IoT deployment data, regulatory compliance frameworks, carbon emission reduction metrics, urbanization trends, and technology adoption rates for IoT-based waste collection systems, AI-powered sorting technologies, smart sensor networks, cloud-based waste analytics platforms, and automated recycling solutions.


Primary Research

In order to gather both qualitative and quantitative insights, supply-side and demand-side stakeholders were interviewed during the primary research process. CEOs, CTOs, VPs of Sustainability Solutions, IoT product heads, and commercial directors from manufacturers of sensors, software platform developers, waste collection fleet operators, and smart waste management system providers were examples of supply-side sources. Directors of municipal waste management, corporate sustainability officers, facilities managers from commercial real estate, procurement leads from industrial manufacturing plants, and managers of smart city programs from metropolitan authorities were examples of demand-side sources. Primary research verified product development roadmaps, validated market segmentation across IoT technologies, AI/ML platforms, smart sensors, and cloud infrastructure, and collected information on public-private partnership structures, smart bin deployment densities, municipal procurement cycles, and total cost of ownership models for integrated waste management systems.

Primary Respondent Breakdown:

By Designation: C-level Primaries (28%), Director Level (35%), Others (37%)

By Region: North America (32%), Europe (29%), Asia-Pacific (33%), Rest of World (6%)


Market Size Estimation

Software subscription revenue mapping, sensor unit sales, and technology deployment analysis were used to determine the global market valuation. The methodology comprised:

Finding more than fifty major waste management service integrators and technology suppliers in North America, Europe, Asia-Pacific, and Latin America

IoT-based smart bins, AI/computer vision sorting systems, RFID waste monitoring, GPS fleet optimization, cloud-based analytics platforms, and sensor network infrastructure are all examples of technology mapping.

Examination of reported and projected yearly revenues for smart waste management system portfolios, encompassing software (SaaS platforms, analytics dashboards), hardware (sensors, smart bins, compactors), and service (installation, maintenance, data analytics) components

Coverage of system integrators and technology suppliers that account for 72–76% of the global market share in 2024

Extrapolation of segment-specific valuations across municipal, commercial, and industrial application verticals using top-down (manufacturer and service provider revenue validation) and bottom-up (smart bin deployment density × unit ASP by metropolitan area, IoT sensor installation volume × hardware/software split) methods

Download Free Sample

Kindly complete the form below to receive a free sample of this Report

Download PDF ×

We do not share your information with anyone. However, we may send you emails based on your report interest from time to time. You may contact us at any time to opt-out.

















