• Cat-intel
  • MedIntelliX
  • Resources
  • About Us
  • Hero Background
    English
    Chinese
    French
    Japanese
    Korean
    German
    Spanish

    Specialty Chemicals Market Trends

    ID: MRFR/CnM/1494-CR
    232 Pages
    Priya Nagrale
    February 2021

    Specialty Chemicals Market Research Report Information By Source (Crude Oil, Naphtha, Ethane, Propane, Butane, Wood, Others) and By Type (Agrochemicals, Flavors Ingredients, Fragrances Ingredients, Dyes & Pigments, Personal Care Active Ingredients, Water Treatment Chemicals, Construction Chemicals, Surfactants, Textile Chemicals, Polymer Additives, Bio-Based Chemicals, Others), And By Regio...

    Share:
    Download PDF ×

    We do not share your information with anyone. However, we may send you emails based on your report interest from time to time. You may contact us at any time to opt-out.

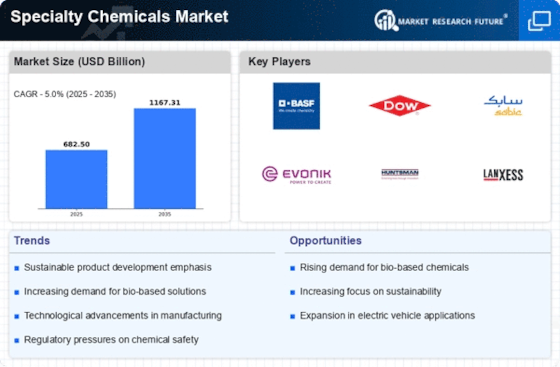
    Specialty Chemicals Market Infographic
    $ 4,950.0
    $ 5,950.0
    $ 7,250.0

    Market Trends

    Key Emerging Trends in the Specialty Chemicals Market

    Specialty chemicals include a range of chemicals such as construction chemicals, water treatment chemicals, pulp & paper chemicals, polymer additive, textile chemicals, dyes & pigments, food additive, cosmetics & personal care, and others. These chemicals are used across a broad range of applications, almost in each sector of the chemical industry. Rapid industrialization and urbanization have significantly influenced trade and economies across the globe. On the other hand, consistently growing population and subsequently increasing dependency on textile, food additive, consumer goods, and infrastructure are ensuring exponential growth of the specialty chemicals. Similarly, a wide range of chemicals are used in the production of flavors and foods, adhesives, agrochemicals, lubricants, cosmetics, textile, construction, and other material are ensuring massive revenue for specialty chemical industry. As per industry experts, construction chemicals, specialty polymers, electronic chemicals, and surfactants were the largest chemical segment as of 2017. Collectively, these chemical segments accounted for the majority of the global market share. About half of the global specialty chemical is consumed by four major industries: food & beverages, construction, electrical & electronics, and soap, cleaning & cosmetics. Additionally, automotive, oil & gas and mining, and pulp & paper are other prominent industries in the global market. Favorable policies and growing government support in China and India are likely to boost the growth of the construction industry in these economies. Commercial as well as residential construction projects in India witnessed growth of nearly 7.1% in 2018. Similarly, India has a huge agriculture base, which is a vital part of the growth. On the other hand, China is known for its industrial manufacturing linked with the largest automotive production. Taking into account, these two countries are the key revenue-centric markets for specialty chemicals. Therefore, the demand for paints and coatings is likely to grow significantly in abovementioned industries due to a surge in automotive and construction projects. Furthermore, personal care industry is dominated by North American and Europe countries such as the U.S., Germany, Belgium, and others. Taking into account the overall scenario, specialty chemicals have a diverse application range. However, construction chemicals, specialty polymers, electronic chemicals, and surfactants are the three major application areas in the market. Additionally, technological advancements in specialty chemicals, large end-use industry base, high demand from Europe and Asia Pacific, and growing demand for customized products from the automotive industry are driving the growth of the market significantly.

    Market Summary

    As per Market Research Future Analysis, the Global Specialty Chemicals Market was valued at USD 600 Billion in 2022 and is projected to grow from USD 650 Billion in 2023 to USD 900 Billion by 2030, with a CAGR of 5.00% during the forecast period. The market is driven by robust growth in construction activities, particularly in the APAC and Middle East regions. The automotive industry significantly influences market growth, with increasing demand for lightweight materials and electric vehicles (EVs) enhancing the need for specialty chemicals.

    Key Market Trends & Highlights

    Key trends driving the Specialty Chemicals Market include advancements in automotive applications and agrochemical demand.

    • Automotive industry growth is boosting demand for specialty chemicals, particularly for coatings and lightweight materials.
    • The agrochemicals segment dominated the market in 2022 and is expected to be the fastest-growing segment from 2023 to 2030.
    • Asia-Pacific is projected to dominate the market, driven by industrial growth and urbanization in countries like China and India.
    • North America is expected to grow at the fastest CAGR from 2023 to 2030, led by the U.S. market.

    Market Size & Forecast

    2022 Market Size USD 600 Billion
    2023 Market Size USD 650 Billion
    2030 Market Size USD 900 Billion
    CAGR 5.00%
    Dominant Region Asia-Pacific.

    Major Players

    Major players include Evonik Industries AG, Henkel AG & Co, ExxonMobil Corporation, Clariant AG, AkzoNobel NV, Lenzing AG, BASF SE, and DowDuPont.

    Market Trends

    Favorable Trend In The Automotive Industry to boost market growth

    The automotive industry is a major driver of the specialty chemicals market. Specialty chemicals are used in a wide range of applications in the automotive industry, including in the production of coatings, adhesives, sealants, lubricants, and plastics. As the demand for automobiles continues to increase worldwide, driven by factors such as rising population, urbanization, and growing disposable incomes, the specialty chemicals market is also expected to grow. One favorable trend in the automotive industry that is driving the specialty chemicals market is the increasing demand for lightweight materials.

    Automakers are under pressure to reduce the weight of their vehicles to improve fuel efficiency and meet regulatory requirements for lower emissions. This has led to a growing demand for specialty chemicals that can be used to produce lightweight materials, such as composites and plastics.

    Another trend that is driving the specialty chemicals market in the automotive industry is the increasing demand for electric vehicles (EVs). EVs require specialized components and materials that are different from those used in traditional gasoline-powered vehicles. This has created a growing market for specialty chemicals that can be used in the production of EV components, such as batteries and power electronics.

    Overall, the automotive industry is a key driver of the specialty chemicals market, and favorable trends in the industry, such as the demand for lightweight materials and the growth of the EV market, are expected to continue to drive demand for specialty chemicals in the coming years. Therefore, such factors related to Specialty Chemicals have enhanced the Specialty Chemicals market CAGR across the globe in recent years.

    The Global Specialty Chemicals Market is poised for robust growth, driven by increasing demand across diverse industries, including automotive, construction, and electronics, which underscores the sector's adaptability and innovation potential.

    U.S. Department of Commerce

    Specialty Chemicals Market Market Drivers

    Market Growth Projections

    The Global Specialty Chemicals Market Industry is projected to experience robust growth, with estimates indicating a market value of 675 USD Billion in 2024 and a potential increase to 1148.7 USD Billion by 2035. This growth trajectory reflects a compound annual growth rate (CAGR) of 4.95% from 2025 to 2035. The expansion is driven by various factors, including technological advancements, regulatory support, and evolving consumer preferences. As the industry adapts to these dynamics, it is likely to witness significant transformations, shaping the future landscape of specialty chemicals.

    Expansion of Emerging Markets

    Emerging markets present a substantial opportunity for the Global Specialty Chemicals Market Industry, as rapid industrialization and urbanization drive demand for specialty chemicals. Countries in Asia-Pacific, Latin America, and Africa are witnessing significant growth in sectors such as construction, automotive, and consumer goods. This expansion is fueled by increasing disposable incomes and a growing middle class, which in turn boosts demand for high-quality products. As these markets continue to develop, they are expected to contribute significantly to the overall market growth, further solidifying the industry's global presence.

    Growing Focus on Consumer Preferences

    Consumer preferences are evolving, with a marked inclination towards products that are safe, sustainable, and high-performing. This shift significantly impacts the Global Specialty Chemicals Market Industry, as manufacturers strive to meet these demands. For instance, the cosmetics and personal care sectors are increasingly utilizing specialty chemicals that are biodegradable and free from harmful substances. This trend not only aligns with consumer expectations but also drives innovation in product formulations. As companies adapt to these changing preferences, the market is likely to witness robust growth, reflecting the dynamic nature of consumer-driven trends.

    Rising Demand from End-User Industries

    The Global Specialty Chemicals Market Industry experiences heightened demand driven by various end-user sectors, including automotive, construction, and electronics. As industries evolve, the need for advanced materials and formulations increases, leading to a projected market value of 675 USD Billion in 2024. For instance, the automotive sector's shift towards lightweight materials and high-performance coatings necessitates innovative specialty chemicals, thereby propelling market growth. This trend is indicative of a broader movement towards sustainability and efficiency, suggesting that the Global Specialty Chemicals Market Industry is poised for substantial expansion.

    Regulatory Support for Sustainable Practices

    The Global Specialty Chemicals Market Industry benefits from increasing regulatory support aimed at promoting sustainable practices. Governments worldwide are implementing stringent regulations to minimize environmental impact, encouraging companies to adopt eco-friendly chemicals and processes. For example, the European Union's REACH regulation mandates the registration and evaluation of chemical substances, pushing manufacturers towards safer alternatives. This regulatory landscape not only drives innovation but also enhances market competitiveness, as companies that comply with these regulations are likely to capture a larger share of the market. Consequently, this trend supports the industry's growth trajectory.

    Technological Advancements in Chemical Production

    Innovations in chemical manufacturing processes significantly influence the Global Specialty Chemicals Market Industry. The adoption of advanced technologies, such as green chemistry and bioprocessing, enhances production efficiency and reduces environmental impact. These advancements not only improve product quality but also align with global sustainability goals. As a result, the market is expected to grow at a CAGR of 4.95% from 2025 to 2035, reaching an estimated 1148.7 USD Billion by 2035. This growth reflects the industry's commitment to integrating cutting-edge technologies, thereby fostering a more sustainable chemical landscape.

    Market Segment Insights

    Specialty Chemicals Source Insights

    The  Specialty Chemicals Market segmentation, based on source, includes Crude Oil, Naphtha, Ethane, Propane, Butane, Wood, and Others. The Crude Oil segment held the majority share in 2022 of the  Specialty Chemicals Market revenue. Crude oil is a major source of feedstock for the production of specialty chemicals. It is refined into a variety of chemicals that are used in a wide range of applications, including in the production of plastics, adhesives, coatings, and other specialty chemicals. The availability and price of crude oil can have a significant impact on the production and pricing of specialty chemicals.

    Specialty Chemicals Type Insights

    Based on type, the  Specialty Chemicals Market segmentation includes Agrochemicals, Flavors Ingredients, Fragrances Ingredients, Dyes & Pigments, Personal Care Active Ingredients, Water Treatment Chemicals, Construction Chemicals, Surfactants, Textile Chemicals, Polymer Additives, Bio-Based Chemicals, and Others. The Agrochemicals segment dominated the market in 2022 and is projected to be the faster-growing segment during the forecast period, 2023-2030. The agrochemicals segment includes specialty chemicals used in the agricultural industry, such as pesticides, herbicides, and fertilizers.

    This segment has historically been one of the largest and most important segments of the specialty chemicals market, driven by the global demand for food and increasing concerns about crop protection. These all factors for Specialty Chemicals positively impact the market growth.

    Figure 2:  Specialty Chemicals Market, by Source, 2022 & 2030 (USD Billion)

    Source: Secondary Research, Primary Research, Market Research Future Database and Analyst Review

    Get more detailed insights about Specialty Chemicals Market Research Report- Forecast to 2030

    Regional Insights

    By region, the study provides market insights into North America, Europe, Asia-Pacific, and the Rest of the World. The Asia-Pacific (APAC) region is expected to dominate the  Specialty Chemicals Market in terms of both revenue and growth rate. This is due to several factors, including the increasing demand for specialty chemicals in the region's rapidly growing industrial sectors, such as automotive, electronics, and construction.

    Additionally, the rising population and increasing urbanization in countries like China and India are driving demand for a range of products that utilize specialty chemicals, including personal care products, food and beverages, and household products. The region is also home to several large specialty chemical manufacturers, which contributes to the growth of the market.

    Further, the major countries studied in the market report are The U.S., Canada, Germany, France, the UK, Italy, Spain, China, Japan, India, Australia, South Korea, and Brazil

    Figure 3:  SPECIALTY CHEMICALS MARKET SHARE BY REGION 2022 (%)SPECIALTY CHEMICALS MARKET SHARE BY REGION 2022

    Source: Secondary Research, Primary Research, Market Research Future Database and Analyst Review

    Europe’s Specialty Chemicals market accounts for the third-largest market share. The region has a well-established chemical industry and is home to many major specialty chemical manufacturers. The demand for specialty chemicals in Europe is driven by several end-use industries, including automotive, construction, healthcare, and food and beverage. In addition, the region has strong regulatory frameworks for chemical production and usage, which has led to a high level of innovation in specialty chemical products. The European Union's REACH regulation, for example, has encouraged the development of more sustainable and environmentally-friendly specialty chemical products.

    Further, the Germany Specialty Chemicals market held the largest market share, and the UK Specialty Chemicals market was the fastest-growing market in the European region.

    North America, Specialty Chemicals market, is expected to grow at the fastest CAGR from 2023 to 2030. The United States is the largest market for specialty chemicals in North America, followed by Canada and Mexico. The demand for specialty chemicals in the region is also driven by factors such as the increasing use of high-performance materials, growing environmental awareness, and innovation in product development. Moreover, the U.S. Specialty Chemicals market held the largest market share, and the Canada Specialty Chemicals market was the fastest-growing market in the North American region.

    Key Players and Competitive Insights

    Major market players are spending a lot of money on R&D to increase their product lines, which will help the Specialty Chemicals market grow even more. Market participants are also taking a range of strategic initiatives to grow their worldwide footprint, with key market developments such as new product launches, contractual agreements, mergers and acquisitions, increased investments, and collaboration with other organizations. Competitors in the Specialty Chemicals industry must offer cost-effective items to expand and survive in an increasingly competitive and rising market environment.

    The major market players are investing a lot of money in R&D to expand their product lines, which will spur further market growth for Specialty Chemicals. With significant market development like new product releases, contractual agreements, mergers and acquisitions, increased investments, and collaboration with other organizations, market participants are also undertaking various strategic activities to expand their global presence. To grow and thrive in a market climate that is becoming more competitive and growing, competitors in the Specialty Chemicals industry must offer affordable products.

    Manufacturing locally to cut operating costs is one of the main business tactics manufacturers use in the global Specialty Chemicals industry to benefit customers and expand the market sector. Major Specialty Chemicals market players, including Evonik Industries AG, Henkel AG & Co, ExxonMobil Corporation, Clariant AG, AkzoNobel NV, Lenzing AG, BHS Specialty Chemicals, Lanxess AG, BASF SE, Ashland Inc., Solvay SA, KGaA, DowDuPont, and others, are attempting to increase market demand by funding R&D initiatives.

    Evonik Industries AG is a German specialty chemicals companies that produces a wide range of products, including specialty chemicals, animal nutrition, and performance materials. The company operates in four segments: Nutrition & Care, Resource Efficiency, Performance Materials, and Services. Some of Evonik's key products include amino acids, hydrogen peroxide, and high-performance polymers. The company has a strong focus on sustainability and has set ambitious targets to reduce its carbon emissions and improve the sustainability of its products.

    Henkel AG & Co is a German chemical and consumer goods company that operates in three business areas: Adhesive Technologies, Beauty Care, and Laundry & Home Care. The company's Adhesive Technologies segment produces a wide range of adhesive products for industrial and consumer applications, including automotive, packaging, and construction. Henkel's Beauty Care segment produces hair care, skincare, and beauty products, while its Laundry & Home Care segment produces laundry detergents, household cleaners, and other related products.

    The company has a strong focus on sustainability and has set ambitious targets to reduce its carbon emissions and improve the sustainability of its products.

    Key Companies in the Specialty Chemicals Market market include

    Industry Developments

    In April 2022, Evonik has increased production capacity of isobutene derivatives in Marl location by 50%.5 Isobutene is a part of the C4 production network and manufactures the petrochemical specialties such as Tert Butanol (TBA), Di-isobutene (DiB), and trimethylhexanal (TMH). Tertiary Butanol is a specialised solvent and tablet coating agent for the pharmaceutical industry.

    In April 2021, Evonik Industries AG took over the study of the high-performance polymer VESTAKEEP PEEK for structural prosthesis systems. In the case of prostheses made from this polymer there is an advantage of clinical experience for the latter on performance of implant polymer for medical science. In this respect, the company is making use of medical experts from the famous center for knee and hip replacements in Massachusetts General Hospital (USA). If this innovation has prospective, the joint prosthesis VESTAKEEP-based life delivery could be greatly improved, thus eliminating the need for surgery days of pain therapy.

    In January 2021, Huntsman revealed it has finalized the acquisition of Gabriel Performance Products a North American enterprise that specializes in manufacturing specialty additives and epoxy curing agents for the purpose of diversification of its product offerings.

    In January 2021, LANXESS advanced its strategies when it signed an agreement with the French biocide company INTACE SAS for the expansion of its market and to strengthen itself as one of the leading manufacturers of antimicrobial biocides and fungicides in the packaging industry.

    In May 2020, BASF, at a conference, first introduced the Melyra fungicide to its customers in China. Melyra is a product line based on BASF’s innovative fungicide Revysol. There has never been anything like it before, Making it the first of its kind to be developed. Melyra combines the latest fungicide technology from BASF with the well-known active ingredient F500 from this company. It is an exciting new solution for farmers to help them improve their commercially attractive crop output.

    Future Outlook

    Specialty Chemicals Market Future Outlook

    The Global Specialty Chemicals Market is projected to grow at a 4.95% CAGR from 2024 to 2035, driven by increasing demand for sustainable products and technological advancements.

    New opportunities lie in:

    • Invest in bio-based specialty chemicals to meet rising sustainability demands.
    • Leverage digital technologies for enhanced supply chain efficiency and customer engagement.
    • Expand into emerging markets with tailored specialty chemical solutions.

    By 2035, the market is expected to achieve robust growth, reflecting evolving industry dynamics and consumer preferences.

    Market Segmentation

    Specialty Chemicals Type Outlook

    • Agrochemicals
    • Flavors, Fragrances & Personal Care Active Ingredients,
    • Dyes & Pigments
    • Water Treatment, Bio-Based, Construction & Textile Chemicals
    • Surfactants & Polymer Additives
    • Others

    Specialty Chemicals Source Outlook

    • Crude Oil
    • Naphtha, Ethane & Propane
    • Butane & Wood
    • Others

    Specialty Chemicals Regional Outlook

    North America
    • US
    • Canada

    Report Scope

    Attribute/Metric Details
    Market Size 2022 USD 600 Billion
    Market Size 2023 USD 650 Billion
    Market Size 2030 USD 900 Billion
    Compound Annual Growth Rate (CAGR) 5.00% (2023-2030)
    Base Year 2022
    Market Forecast Period 2023-2030
    Historical Data 2018 & 2020
    Market Forecast Units Value (USD Million)
    Report Coverage Revenue Forecast, Market Competitive Landscape, Growth Factors, and Trends
    Segments Covered Source, Type, and Region
    Geographies Covered North America, Europe, Asia Pacific, and Rest of the World
    Countries Covered The U.S, Canada, Germany, France, UK, Italy, Spain, China, Japan, India, Australia, South Korea, and Brazil
    Key Companies Profiled Evonik Industries AG, Henkel AG & Co, ExxonMobil Corporation, Clariant AG, AkzoNobel NV, Lenzing AG, BHS Specialty Chemicals, Lanxess AG, BASF SE, Ashland Inc., Solvay SA, KGaA, DowDuPont
    Key Market Opportunities ·         Market Collaborations In The Cosmetic Industry
    Key Market Dynamics ·         Diverse Application Range Of Specialty Chemicals ·         Shift From Commodity Chemicals To Specialty Chemicals ·         Favorable Trend In The Automotive Industry

    Market Highlights

    Author

    Priya Nagrale
    Senior Research Analyst

    She holds an experience of about 6+ years in market research and business consulting, working under the spectrum of information communication technology, telecommunications and semiconductor domains. aarti conceptualizes and implements a scalable business strategy and provides strategic leadership to the clients. her expertise lies in market estimation, competitive intelligence, pipeline analysis, customer assessment, etc.

    Leave a Comment

    Latest Comments

    John Doe
    john@example.com

    This is a great article! Really helped me understand the topic better.

    Posted on July 23, 2025, 10:15 AM
    Jane Smith
    jane@domain.com

    Thanks for sharing this. I’ve bookmarked it for later reference.

    Posted on July 22, 2025, 7:45 PM

    FAQs

    How much is the Specialty Chemicals market?

    The Specialty Chemicals Market size was valued at USD 600 Billion in 2022.

    What is the growth rate of the Specialty Chemicals market?

    The global market is projected to grow at a CAGR of 5.00% during the forecast period, 2023-2030.

    Which region held the largest market share in the Specialty Chemicals market?

    Asia Pacific had the largest share in the Specialty Chemicals Market.

    Who are the key players in the Specialty Chemicals market?

    The key players in the market are Evonik Industries AG, Henkel AG & Co, ExxonMobil Corporation, Clariant AG, AkzoNobel NV, Lenzing AG, BHS Specialty Chemicals, Lanxess AG, BASF SE, Ashland Inc., Solvay SA, KGaA, DowDuPont.

    Which source led the Specialty Chemicals market?

    The crude oil category dominated the market in 2022.

    Which type had the largest market share in the market?

    Agrochemicals had the largest share in the global market for Specialty Chemicals.

    1. Executive Summary
    2. Market Introduction
      1. Definition 20
      2. Scope of the Study 20
      3. List of Assumptions 21
      4. Market Structure 21
    3. Research Methodology
      1. Research Process 23
      2. Primary Research 24
      3. Secondary Research 25
      4. Market Size Estimation 25
      5. Forecast Model 26
    4. Market Dynamics
      1. Introduction 28
      2. Drivers 29
        1. Diverse application range of specialty chemicals 29
        2. Shift from commodity chemicals to specialty chemicals 30
        3. Favorable trend in the automotive industry 31
      3. Restraints 32
        1. Fluctuation in raw material prices 32
      4. Opportunities 32
        1. Market collaborations in the cosmetic industry along with increasing demand 32
        2. Shifting industrial dynamics to Asia Pacific and Middle East 33
      5. Challenges 33
        1. Stringent regulatory policies 33
        2. Prices associated with biobased products 34
    5. Market Factor Analysis
      1. Supply Chain Analysis 36
        1. Raw Material Suppliers 36
        2. Specialty chemical Producers 37
        3. Distribution Channel 37
        4. Application Industry 37
      2. Porter’s Five Force Analysis 38
        1. Threat of New Entrants 38
        2. Threat of Rivalry 38
        3. Threat of Substitute 38
        4. Bargaining Power of Supplier 39
        5. Bargaining Power of Buyer 39
    6. Global Specialty Chemicals Market, By Source
      1. Introduction 41
      2. Crude Oil 43
      3. Naphtha 44
      4. Ethane 45
      5. Propane 46
      6. Wood 47
      7. Butane 48
      8. Others 49
    7. Global Specialty Chemicals Market, By Type
      1. Introduction 51
      2. Agrochemicals 54
        1. Insecticide 55
        2. Fungicides 56
        3. Herbicides 57
        4. Ammonium Sulphate Fertilizers 58
        5. Calcium Nitrate Fertilizers 59
        6. Others 60
      3. Flavors Ingredients 61
        1. Dairy 62
        2. Beverages 63
        3. Savory 64
        4. Others 65
      4. Fragrances Ingredients 66
        1. Hair Care 67
        2. Personal Care 68
        3. Fabric Care 69
        4. Others 70
      5. Dyes & Pigments 71
      6. Personal Care Active Ingredients 72
      7. Water Treatment Chemicals 73
        1. Calcium Nitrate 74
        2. Other Water Treatment Chemicals 75
      8. Construction Chemicals 76
        1. Calcium Carbonate 77
        2. Other Construction Chemicals 78
      9. Surfactants 79
        1. Anionic 80
        2. Nonionic 81
        3. Cationic 82
        4. Amphoteric 83
      10. Textile Chemicals 84
      11. Polymer Additives 85
      12. Bio-Based Chemicals 86
        1. Acetic Acid 87
        2. Furfural 88
        3. Ethanol 89
        4. Others 90
      13. Others 91
    8. Global Specialty Chemicals Market, By Region
      1. Introduction 93
      2. North America 97
        1. U.S 101
        2. Canada 103
      3. Europe 107
        1. Germany 111
        2. UK 114
        3. France 116
        4. Italy 120
        5. Poland 122
        6. Rest of Europe 126
      4. Asia-Pacific 128
        1. China 132
        2. Japan 135
        3. India 139
        4. Australia & New Zealand 141
        5. South Korea 144
        6. Rest of Asia-Pacific 148
      5. Middle East & Africa 150
        1. Turkey 154
        2. Iran 157
        3. Rest of Middle East & Africa 160
      6. Latin America 163
        1. Brazil 168
        2. Mexico 170
        3. Argentina 174
        4. Rest of Latin America 177
    9. Competitive Landscape
      1. Introduction 181
      2. Key development analysis 181
      3. Expansion 182
        1. Acquisition 184
        2. Agreement 185
        3. Product Launch 186
    10. Company Profile
      1. Solvay SA 188
        1. Company Overview 188
        2. Financial Overview 188
        3. Products Offerings 189
        4. Key Developments 189
        5. SWOT Analysis 190
        6. Key Strategy 190
      2. AkzoNobel NV 191
        1. Company Overview 191
        2. Financial Overview 191
        3. Products Offerings 192
        4. Key Developments 192
        5. SWOT Analysis 193
        6. Key Strategy 193
      3. Lenzing AG 194
        1. Company Overview 194
        2. Financial Overview 194
        3. Products Offerings 195
        4. Key Developments 195
        5. SWOT Analysis 195
        6. Key Strategy 195
      4. BHS Specialty Chemicals 196
        1. Company Overview 196
        2. Financial Overview 196
        3. Products Offerings 196
        4. Key Developments 197
        5. SWOT Analysis 197
        6. Key Strategy 197
      5. Givaudan 198
        1. Company Overview 198
        2. Financial Overview 198
        3. Products Offerings 199
        4. Key Developments 199
        5. SWOT Analysis 200
        6. Key Strategy 200
      6. Ashland Inc 201
        1. Company Overview 201
        2. Financial Overview 201
        3. Products Offerings 202
        4. Key Developments 202
        5. SWOT Analysis 203
        6. Key Strategy 203
      7. Evonik Industries AG 204
        1. Company Overview 204
        2. Financial Overview 204
        3. Products Offerings 205
        4. Key Developments Efficiency 205
        5. SWOT Analysis 206
        6. Key Strategy 206
      8. Henkel AG & Co. KGaA 207
        1. Company Overview 207
        2. Financial Overview 207
        3. Products Offerings 208
        4. Key Developments 208
        5. SWOT Analysis 209
        6. Key Strategy 209
      9. ExxonMobil Corporation 210
        1. Company Overview 210
        2. Financial Overview 210
        3. Products Offerings 211
        4. Key Developments 211
        5. SWOT Analysis 212
        6. Key Strategy 212
      10. DowDuPont, Inc 213
        1. Company Overview 213
        2. Financial Overview 213
        3. Products Offerings 214
        4. Key Developments 214
        5. SWOT Analysis 215
        6. Key Strategy 215
      11. BASF SE 216
        1. Company Overview 216
        2. Financial Overview 216
        3. Products Offerings 217
        4. Key Developments 217
        5. SWOT Analysis 218
        6. Key Strategy 218
      12. Lanxess AG 219
        1. Company Overview 219
        2. Financial Overview 219
        3. Products Offerings 220
        4. Key Developments 220
        5. SWOT Analysis 221
        6. Key Strategy 221
      13. Clariant AG 222
        1. Company Overview 222
        2. Financial Overview 222
        3. Products Offerings 223
        4. Key Developments 224
        5. SWOT Analysis 224
        6. Key Strategy 224
      14. Croda International Inc. 225
        1. Company Overview 225
        2. Financial Overview 225
        3. Products Offerings 226
        4. Key Developments 226
        5. SWOT Analysis 227
        6. Key Strategy 227
      15. H.B. Fuller 228
        1. Company Overview 228
        2. Financial Overview 228
        3. Products Offerings 229
        4. Key Developments 229
        5. SWOT Analysis 230
        6. Key Strategy 230
    11. Conclusion
    12. List of Tables and Figures
      1. 12 List of Tables
      2. TABLE 1 LIST OF ASSUMPTIONS 21
      3. TABLE 2 GLOBAL SPECIALTY CHEMICALS MARKET, BY SOURCE, 2023-2030 (USD MILLION) 41
      4. TABLE 3 GLOBAL SPECIALTY CHEMICALS MARKET, BY SOURCE, 2023-2030 (KT) 42
      5. TABLE 4 GLOBAL SPECIALTY CHEMICALS MARKET FOR CRUDE OIL, 2023-2030 (USD MILLION) 43
      6. TABLE 5 GLOBAL SPECIALTY CHEMICALS MARKET FOR CRUDE OIL, 2023-2030 (KT) 43
      7. TABLE 6 GLOBAL SPECIALTY CHEMICALS MARKET FOR NAPHTHA, 2023-2030 (USD MILLION) 44
      8. TABLE 7 GLOBAL SPECIALTY CHEMICALS MARKET FOR NAPHTHA, 2023-2030 (KT) 44
      9. TABLE 8 GLOBAL SPECIALTY CHEMICALS MARKET FOR ETHANE, 2023-2030 (USD MILLION) 45
      10. TABLE 9 GLOBAL SPECIALTY CHEMICALS MARKET FOR ETHANE, 2023-2030 (KT) 45
      11. TABLE 10 GLOBAL SPECIALTY CHEMICALS MARKET FOR PROPANE, 2023-2030 (USD MILLION) 46
      12. TABLE 11 GLOBAL SPECIALTY CHEMICALS MARKET FOR PROPANE, 2023-2030 (KT) 46
      13. TABLE 12 GLOBAL SPECIALTY CHEMICALS MARKET FOR WOOD, 2023-2030 (USD MILLION) 47
      14. TABLE 13 GLOBAL SPECIALTY CHEMICALS MARKET FOR WOOD, 2023-2030 (KT) 47
      15. TABLE 14 GLOBAL SPECIALTY CHEMICALS MARKET FOR BUTANE, 2023-2030 (USD MILLION) 48
      16. TABLE 15 GLOBAL SPECIALTY CHEMICALS MARKET FOR BUTANE, 2023-2030 (KT) 48
      17. TABLE 16 GLOBAL SPECIALTY CHEMICALS MARKET FOR OTHERS, 2023-2030 (USD MILLION) 49
      18. TABLE 17 GLOBAL SPECIALTY CHEMICALS MARKET FOR OTHERS, 2023-2030 (KT) 49
      19. TABLE 18 GLOBAL SPECIALTY CHEMICALS MARKET, BY TYPE, 2023-2030 (USD MILLION) 52
      20. TABLE 19 GLOBAL SPECIALTY CHEMICALS MARKET, BY TYPE, 2023-2030 (KT) 53
      21. TABLE 20 GLOBAL SPECIALTY CHEMICALS MARKET FOR AGROCHEMICALS, 2023-2030 (USD MILLION) 54
      22. TABLE 21 GLOBAL SPECIALTY CHEMICALS MARKET FOR AGROCHEMICALS, 2023-2030 (KT) 54
      23. TABLE 22 GLOBAL SPECIALTY CHEMICALS MARKET FOR INSECTICIDE, 2023-2030 (USD MILLION) 55
      24. TABLE 23 GLOBAL SPECIALTY CHEMICALS MARKET FOR INSECTICIDE, 2023-2030 (KT) 55
      25. TABLE 24 GLOBAL SPECIALTY CHEMICALS MARKET FOR FUNGICIDES, 2023-2030 (USD MILLION) 56
      26. TABLE 25 GLOBAL SPECIALTY CHEMICALS MARKET FOR FUNGICIDES, 2023-2030 (KT) 56
      27. TABLE 26 GLOBAL SPECIALTY CHEMICALS MARKET FOR HERBICIDES, 2023-2030 (USD MILLION) 57
      28. TABLE 27 GLOBAL SPECIALTY CHEMICALS MARKET FOR HERBICIDES, 2023-2030 (KT) 57
      29. TABLE 28 GLOBAL SPECIALTY CHEMICALS MARKET FOR AMMONIUM SULPHATE FERTILIZERS, 2023-2030 (USD MILLION) 58
      30. TABLE 29 GLOBAL SPECIALTY CHEMICALS MARKET FOR AMMONIUM SULPHATE FERTILIZERS, 2023-2030 (KT) 58
      31. TABLE 30 GLOBAL SPECIALTY CHEMICALS MARKET FOR CALCIUM NITRATE FERTILIZERS, 2023-2030 (USD MILLION) 59
      32. TABLE 31 GLOBAL SPECIALTY CHEMICALS MARKET FOR CALCIUM NITRATE FERTILIZERS, 2023-2030 (KT) 59
      33. TABLE 32 GLOBAL SPECIALTY CHEMICALS MARKET FOR OTHERS, 2023-2030 (USD MILLION) 60
      34. TABLE 33 GLOBAL SPECIALTY CHEMICALS MARKET FOR OTHERS, 2023-2030 (KT) 60
      35. TABLE 34 GLOBAL SPECIALTY CHEMICALS MARKET FOR FLAVOURS INGREDIENTS, 2023-2030 (USD MILLION) 61
      36. TABLE 35 GLOBAL SPECIALTY CHEMICALS MARKET FOR FLAVOURS INGREDIENTS, 2023-2030 (KT) 61
      37. TABLE 36 GLOBAL SPECIALTY CHEMICALS MARKET FOR DAIRY, 2023-2030 (USD MILLION) 62
      38. TABLE 37 GLOBAL SPECIALTY CHEMICALS MARKET FOR DAIRY, 2023-2030 (KT) 62
      39. TABLE 38 GLOBAL SPECIALTY CHEMICALS MARKET FOR BEVERAGES, 2023-2030 (USD MILLION) 63
      40. TABLE 39 GLOBAL SPECIALTY CHEMICALS MARKET FOR BEVERAGES, 2023-2030 (KT) 63
      41. TABLE 40 GLOBAL SPECIALTY CHEMICALS MARKET FOR SAVORY, 2023-2030 (USD MILLION) 64
      42. TABLE 41 GLOBAL SPECIALTY CHEMICALS MARKET FOR SAVORY, 2023-2030 (KT) 64
      43. TABLE 42 GLOBAL SPECIALTY CHEMICALS MARKET FOR OTHERS, 2023-2030 (USD MILLION) 65
      44. TABLE 43 GLOBAL SPECIALTY CHEMICALS MARKET FOR OTHERS, 2023-2030 (KT) 65
      45. TABLE 44 GLOBAL SPECIALTY CHEMICALS MARKET FOR FRAGRANCES INGREDIENTS, 2023-2030 (USD MILLION) 66
      46. TABLE 45 GLOBAL SPECIALTY CHEMICALS MARKET FOR FRAGRANCES INGREDIENTS, 2023-2030 (KT) 66
      47. TABLE 46 GLOBAL SPECIALTY CHEMICALS MARKET FOR HAIR CARE, 2023-2030 (USD MILLION) 67
      48. TABLE 47 GLOBAL SPECIALTY CHEMICALS MARKET FOR HAIR CARE, 2023-2030 (KT) 67
      49. TABLE 48 GLOBAL SPECIALTY CHEMICALS MARKET FOR PERSONAL CARE, 2023-2030 (USD MILLION) 68
      50. TABLE 49 GLOBAL SPECIALTY CHEMICALS MARKET FOR PERSONAL CARE, 2023-2030 (KT) 68
      51. TABLE 50 GLOBAL SPECIALTY CHEMICALS MARKET FOR FABRIC CARE, 2023-2030 (USD MILLION) 69
      52. TABLE 51 GLOBAL SPECIALTY CHEMICALS MARKET FOR FABRIC CARE, 2023-2030 (KT) 69
      53. TABLE 52 GLOBAL SPECIALTY CHEMICALS MARKET FOR OTHERS, 2023-2030 (USD MILLION) 70
      54. TABLE 53 GLOBAL SPECIALTY CHEMICALS MARKET FOR OTHERS, 2023-2030 (KT) 70
      55. TABLE 54 GLOBAL SPECIALTY CHEMICALS MARKET FOR DYES & PIGMENTS, 2023-2030 (USD MILLION) 71
      56. TABLE 55 GLOBAL SPECIALTY CHEMICALS MARKET FOR DYES & PIGMENTS, 2023-2030 (KT) 71
      57. TABLE 56 GLOBAL SPECIALTY CHEMICALS MARKET FOR PERSONAL CARE ACTIVE INGREDIENTS, 2023-2030 (USD MILLION) 72
      58. TABLE 57 GLOBAL SPECIALTY CHEMICALS MARKET FOR PERSONAL CARE ACTIVE INGREDIENTS, 2023-2030 (KT) 72
      59. TABLE 58 GLOBAL SPECIALTY CHEMICALS MARKET FOR WATER TREATMENT CHEMICALS, 2023-2030 (USD MILLION) 73
      60. TABLE 59 GLOBAL SPECIALTY CHEMICALS MARKET FOR WATER TREATMENT CHEMICALS, 2023-2030 (KT) 73
      61. TABLE 60 GLOBAL SPECIALTY CHEMICALS MARKET FOR CALCIUM NITRATE, 2023-2030 (USD MILLION) 74
      62. TABLE 61 GLOBAL SPECIALTY CHEMICALS MARKET FOR CALCIUM NITRATE, 2023-2030 (KT) 74
      63. TABLE 62 GLOBAL SPECIALTY CHEMICALS MARKET FOR OTHER WATER TREATMENT CHEMICALS, 2023-2030 (USD MILLION) 75
      64. TABLE 63 GLOBAL SPECIALTY CHEMICALS MARKET FOR OTHER WATER TREATMENT CHEMICALS, 2023-2030 (KT) 75
      65. TABLE 64 GLOBAL SPECIALTY CHEMICALS MARKET FOR CONSTRUCTION CHEMICALS, 2023-2030 (USD MILLION) 76
      66. TABLE 65 GLOBAL SPECIALTY CHEMICALS MARKET FOR CONSTRUCTION CHEMICALS, 2023-2030 (KT) 76
      67. TABLE 66 GLOBAL SPECIALTY CHEMICALS MARKET FOR CALCIUM CARBONATE, 2023-2030 (USD MILLION) 77
      68. TABLE 67 GLOBAL SPECIALTY CHEMICALS MARKET FOR CALCIUM CARBONATE, 2023-2030 (KT) 77
      69. TABLE 68 GLOBAL SPECIALTY CHEMICALS MARKET FOR OTHER CONSTRUCTION CHEMICALS, 2023-2030 (USD MILLION) 78
      70. TABLE 69 GLOBAL SPECIALTY CHEMICALS MARKET FOR OTHER CONSTRUCTION CHEMICALS, 2023-2030 (KT) 78
      71. TABLE 70 GLOBAL SPECIALTY CHEMICALS MARKET FOR SURFACTANTS, 2023-2030 (USD MILLION) 79
      72. TABLE 71 GLOBAL SPECIALTY CHEMICALS MARKET FOR SURFACTANTS, 2023-2030 (KT) 79
      73. TABLE 72 GLOBAL SPECIALTY CHEMICALS MARKET FOR ANIONIC, 2023-2030 (USD MILLION) 80
      74. TABLE 73 GLOBAL SPECIALTY CHEMICALS MARKET FOR ANIONIC, 2023-2030 (KT) 80
      75. TABLE 74 GLOBAL SPECIALTY CHEMICALS MARKET FOR NONIONIC, 2023-2030 (USD MILLION) 81
      76. TABLE 75 GLOBAL SPECIALTY CHEMICALS MARKET FOR NONIONIC, 2023-2030 (KT) 81
      77. TABLE 76 GLOBAL SPECIALTY CHEMICALS MARKET FOR CATIONIC, 2023-2030 (USD MILLION) 82
      78. TABLE 77 GLOBAL SPECIALTY CHEMICALS MARKET FOR CATIONIC, 2023-2030 (KT) 82
      79. TABLE 78 GLOBAL SPECIALTY CHEMICALS MARKET FOR AMPHOTERIC, 2023-2030 (USD MILLION) 83
      80. TABLE 79 GLOBAL SPECIALTY CHEMICALS MARKET FOR AMPHOTERIC, 2023-2030 (KT) 83
      81. TABLE 80 GLOBAL SPECIALTY CHEMICALS MARKET FOR TEXTILE CHEMICALS, 2023-2030 (USD MILLION) 84
      82. TABLE 81 GLOBAL SPECIALTY CHEMICALS MARKET FOR TEXTILE CHEMICALS, 2023-2030 (KT) 84
      83. TABLE 82 GLOBAL SPECIALTY CHEMICALS MARKET FOR POLYMER ADDITIVES, 2023-2030 (USD MILLION) 85
      84. TABLE 83 GLOBAL SPECIALTY CHEMICALS MARKET FOR POLYMER ADDITIVES, 2023-2030 (KT) 85
      85. TABLE 84 GLOBAL SPECIALTY CHEMICALS MARKET FOR BIO-BASED CHEMICALS, 2023-2030 (USD MILLION) 86
      86. TABLE 85 GLOBAL SPECIALTY CHEMICALS MARKET FOR BIO-BASED CHEMICALS, 2023-2030 (KT) 86
      87. TABLE 86 GLOBAL SPECIALTY CHEMICALS MARKET FOR ACETIC ACID, 2023-2030 (USD MILLION) 87
      88. TABLE 87 GLOBAL SPECIALTY CHEMICALS MARKET FOR ACETIC ACID, 2023-2030 (KT) 87
      89. TABLE 88 GLOBAL SPECIALTY CHEMICALS MARKET FOR FURFURAL, 2023-2030 (USD MILLION) 88
      90. TABLE 89 GLOBAL SPECIALTY CHEMICALS MARKET FOR FURFURAL, 2023-2030 (KT) 88
      91. TABLE 90 GLOBAL SPECIALTY CHEMICALS MARKET FOR ETHANOL, 2023-2030 (USD MILLION) 89
      92. TABLE 91 GLOBAL SPECIALTY CHEMICALS MARKET FOR ETHANOL, 2023-2030 (KT) 89
      93. TABLE 92 GLOBAL SPECIALTY CHEMICALS MARKET FOR OTHERS, 2023-2030 (USD MILLION) 90
      94. TABLE 93 GLOBAL SPECIALTY CHEMICALS MARKET FOR OTHERS, 2023-2030 (KT) 90
      95. TABLE 94 GLOBAL SPECIALTY CHEMICALS MARKET FOR OTHERS, 2023-2030 (USD MILLION) 91
      96. TABLE 95 GLOBAL SPECIALTY CHEMICALS MARKET FOR OTHERS, 2023-2030 (KT) 91
      97. TABLE 96 GLOBAL SPECIALTY CHEMICALS MARKET, BY REGION, 2023-2030 (USD MILLION) 93
      98. TABLE 97 GLOBAL SPECIALTY CHEMICALS MARKET, BY REGION, 2023-2030 (KILOTONS) 94
      99. TABLE 98 GLOBAL SPECIALTY CHEMICALS MARKET, BY SOURCE, 2023-2030 (USD MILLION) 95
      100. TABLE 99 GLOBAL SPECIALTY CHEMICALS MARKET, BY SOURCE, 2023-2030 (KILOTONS) 95
      101. TABLE 100 GLOBAL SPECIALTY CHEMICALS MARKET, BY TYPE, 2023-2030 (USD MILLION) 96
      102. TABLE 101 GLOBAL SPECIALTY CHEMICALS MARKET, BY TYPE, 2023-2030 (KILOTONS) 97
      103. TABLE 102 NORTH AMERICA SPECIALTY CHEMICALS MARKET, BY COUNTRY, 2023-2030 (USD MILLION) 98
      104. TABLE 103 NORTH AMERICA SPECIALTY CHEMICALS MARKET, BY COUNTRY, 2023-2030 (KILOTONS) 98
      105. TABLE 104 NORTH AMERICA SPECIALTY CHEMICALS MARKET, BY SOURCE, 2023-2030 (USD MILLION) 98
      106. TABLE 105 NORTH AMERICA SPECIALTY CHEMICALS MARKET, BY SOURCE, 2023-2030 (KILOTONS) 99
      107. TABLE 106 NORTH AMERICA SPECIALTY CHEMICALS MARKET, BY TYPE, 2023-2030 (USD MILLION) 99
      108. TABLE 107 NORTH AMERICA SPECIALTY CHEMICALS MARKET, BY TYPE, 2023-2030 (KILOTONS) 100
      109. TABLE 108 U.S SPECIALTY CHEMICALS MARKET, BY SOURCE, 2023-2030 (USD MILLION) 101
      110. TABLE 109 U.S SPECIALTY CHEMICALS MARKET, BY SOURCE, 2023-2030 (KILOTONS) 101
      111. TABLE 110 U.S SPECIALTY CHEMICALS MARKET, BY TYPE, 2023-2030 (USD MILLION) 102
      112. TABLE 111 U.S SPECIALTY CHEMICALS MARKET, BY TYPE, 2023-2030 (KILOTONS) 103
      113. TABLE 112 CANADA SPECIALTY CHEMICALS MARKET, BY SOURCE, 2023-2030 (USD MILLION) 103
      114. TABLE 113 CANADA SPECIALTY CHEMICALS MARKET, BY SOURCE, 2023-2030 (KILOTONS) 104
      115. TABLE 114 CANADA SPECIALTY CHEMICALS MARKET, BY TYPE, 2023-2030 (USD MILLION) 105
      116. TABLE 115 CANADA SPECIALTY CHEMICALS MARKET, BY TYPE, 2023-2030 (KILOTONS) 106
      117. TABLE 116 EUROPE SPECIALTY CHEMICALS MARKET, BY COUNTRY, 2023-2030 (USD MILLION) 107
      118. TABLE 117 EUROPE SPECIALTY CHEMICALS MARKET, BY COUNTRY, 2023-2030 (KILOTONS) 108
      119. TABLE 118 EUROPE SPECIALTY CHEMICALS MARKET, BY SOURCE, 2023-2030 (USD MILLION) 108
      120. TABLE 119 EUROPE SPECIALTY CHEMICALS MARKET, BY SOURCE, 2023-2030 (KILOTONS) 109
      121. TABLE 120 EUROPE SPECIALTY CHEMICALS MARKET, BY TYPE, 2023-2030 (USD MILLION) 109
      122. TABLE 121 EUROPE SPECIALTY CHEMICALS MARKET, BY TYPE, 2023-2030 (KILOTONS) 110
      123. TABLE 122 GERMANY SPECIALTY CHEMICALS MARKET, BY SOURCE, 2023-2030 (USD MILLION) 111
      124. TABLE 123 GERMANY SPECIALTY CHEMICALS MARKET, BY SOURCE, 2023-2030 (KILOTONS) 111
      125. TABLE 124 GERMANY SPECIALTY CHEMICALS MARKET, BY TYPE, 2023-2030 (USD MILLION) 112
      126. TABLE 125 GERMANY SPECIALTY CHEMICALS MARKET, BY TYPE, 2023-2030 (KILOTONS) 113
      127. TABLE 126 UK SPECIALTY CHEMICALS MARKET, BY SOURCE, 2023-2030 (USD MILLION) 114
      128. TABLE 127 UK SPECIALTY CHEMICALS MARKET, BY SOURCE, 2023-2030 (KILOTONS) 114
      129. TABLE 128 UK SPECIALTY CHEMICALS MARKET, BY TYPE, 2023-2030 (USD MILLION) 115
      130. TABLE 129 UK SPECIALTY CHEMICALS MARKET, BY TYPE, 2023-2030 (KILOTONS) 116
      131. TABLE 130 FRANCE SPECIALTY CHEMICALS MARKET, BY SOURCE, 2023-2030 (USD MILLION) 116
      132. TABLE 131 FRANCE SPECIALTY CHEMICALS MARKET, BY SOURCE, 2023-2030 (KILOTONS) 117
      133. TABLE 132 FRANCE SPECIALTY CHEMICALS MARKET, BY TYPE, 2023-2030 (USD MILLION) 118
      134. TABLE 133 FRANCE SPECIALTY CHEMICALS MARKET, BY TYPE, 2023-2030 (KILOTONS) 119
      135. TABLE 134 ITALY SPECIALTY CHEMICALS MARKET, BY SOURCE, 2023-2030 (USD MILLION) 120
      136. TABLE 135 ITALY SPECIALTY CHEMICALS MARKET, BY SOURCE, 2023-2030 (KILOTONS) 120
      137. TABLE 136 ITALY SPECIALTY CHEMICALS MARKET, BY TYPE, 2023-2030 (USD MILLION) 121
      138. TABLE 137 ITALY SPECIALTY CHEMICALS MARKET, BY TYPE, 2023-2030 (KILOTONS) 122
      139. TABLE 138 POLAND SPECIALTY CHEMICALS MARKET, BY SOURCE, 2023-2030 (USD MILLION) 122
      140. TABLE 139 POLAND SPECIALTY CHEMICALS MARKET, BY SOURCE, 2023-2030 (KILOTONS) 123
      141. TABLE 140 POLAND SPECIALTY CHEMICALS MARKET, BY TYPE, 2023-2030 (USD MILLION) 124
      142. TABLE 141 POLAND SPECIALTY CHEMICALS MARKET, BY TYPE, 2023-2030 (KILOTONS) 125
      143. TABLE 142 REST OF EUROPE SPECIALTY CHEMICALS MARKET, BY SOURCE, 2023-2030 (USD MILLION) 126
      144. TABLE 143 REST OF EUROPE SPECIALTY CHEMICALS MARKET, BY SOURCE, 2023-2030 (KILOTONS) 126
      145. TABLE 144 REST OF EUROPE SPECIALTY CHEMICALS MARKET, BY TYPE, 2023-2030 (USD MILLION) 127
      146. TABLE 145 REST OF EUROPE SPECIALTY CHEMICALS MARKET, BY TYPE, 2023-2030 (KILOTONS) 128
      147. TABLE 146 ASIA-PACIFIC SPECIALTY CHEMICALS MARKET, BY COUNTRY, 2023-2030 (USD MILLION) 129
      148. TABLE 147 ASIA-PACIFIC SPECIALTY CHEMICALS MARKET, BY COUNTRY, 2023-2030 (KILOTONS) 129
      149. TABLE 148 ASIA-PACIFIC SPECIALTY CHEMICALS MARKET, BY SOURCE, 2023-2030 (USD MILLION) 130
      150. TABLE 149 ASIA-PACIFIC SPECIALTY CHEMICALS MARKET, BY SOURCE, 2023-2030 (KILOTONS) 130
      151. TABLE 150 ASIA-PACIFIC SPECIALTY CHEMICALS MARKET, BY TYPE, 2023-2030 (USD MILLION) 131
      152. TABLE 151 ASIA-PACIFIC SPECIALTY CHEMICALS MARKET, BY TYPE, 2023-2030 (KILOTONS) 132
      153. TABLE 152 CHINA SPECIALTY CHEMICALS MARKET, BY SOURCE, 2023-2030 (USD MILLION) 132
      154. TABLE 153 CHINA SPECIALTY CHEMICALS MARKET, BY SOURCE, 2023-2030 (KILOTONS) 133
      155. TABLE 154 CHINA SPECIALTY CHEMICALS MARKET, BY TYPE, 2023-2030 (USD MILLION) 134
      156. TABLE 155 CHINA SPECIALTY CHEMICALS MARKET, BY TYPE, 2023-2030 (KILOTONS) 135
      157. TABLE 156 JAPAN SPECIALTY CHEMICALS MARKET, BY SOURCE, 2023-2030 (USD MILLION) 135
      158. TABLE 157 JAPAN SPECIALTY CHEMICALS MARKET, BY SOURCE, 2023-2030 (KILOTONS) 136
      159. TABLE 158 JAPAN SPECIALTY CHEMICALS MARKET, BY TYPE, 2023-2030 (USD MILLION) 137
      160. TABLE 159 JAPAN SPECIALTY CHEMICALS MARKET, BY TYPE, 2023-2030 (KILOTONS) 138
      161. TABLE 160 INDIA SPECIALTY CHEMICALS MARKET, BY SOURCE, 2023-2030 (USD MILLION) 139
      162. TABLE 161 INDIA SPECIALTY CHEMICALS MARKET, BY SOURCE, 2023-2030 (KILOTONS) 139
      163. TABLE 162 INDIA SPECIALTY CHEMICALS MARKET, BY TYPE, 2023-2030 (USD MILLION) 140
      164. TABLE 163 INDIA SPECIALTY CHEMICALS MARKET, BY TYPE, 2023-2030 (KILOTONS) 141
      165. TABLE 164 AUSTRALIA & NEW ZEALAND SPECIALTY CHEMICALS MARKET, BY SOURCE, 2023-2030 (USD MILLION) 141
      166. TABLE 165 AUSTRALIA & NEW ZEALAND SPECIALTY CHEMICALS MARKET, BY SOURCE, 2023-2030 (KILOTONS) 142
      167. TABLE 166 AUSTRALIA & NEW ZEALAND SPECIALTY CHEMICALS MARKET, BY TYPE, 2023-2030 (USD MILLION) 143
      168. TABLE 167 AUSTRALIA & NEW ZEALAND SPECIALTY CHEMICALS MARKET, BY TYPE, 2023-2030 (KILOTONS) 144
      169. TABLE 168 SOUTH KOREA SPECIALTY CHEMICALS MARKET, BY SOURCE, 2023-2030 (USD MILLION) 144
      170. TABLE 169 SOUTH KOREA SPECIALTY CHEMICALS MARKET, BY SOURCE, 2023-2030 (KILOTONS) 145
      171. TABLE 170 SOUTH KOREA SPECIALTY CHEMICALS MARKET, BY TYPE, 2023-2030 (USD MILLION) 146
      172. TABLE 171 SOUTH KOREA SPECIALTY CHEMICALS MARKET, BY TYPE, 2023-2030 (KILOTONS) 147
      173. TABLE 172 REST OF ASIA-PACIFIC SPECIALTY CHEMICALS MARKET, BY SOURCE, 2023-2030 (USD MILLION) 148
      174. TABLE 173 REST OF ASIA-PACIFIC SPECIALTY CHEMICALS MARKET, BY SOURCE, 2023-2030 (KILOTONS) 148
      175. TABLE 174 REST OF ASIA-PACIFIC SPECIALTY CHEMICALS MARKET, BY TYPE, 2023-2030 (USD MILLION) 149
      176. TABLE 175 REST OF ASIA-PACIFIC SPECIALTY CHEMICALS MARKET, BY TYPE, 2023-2030 (KILOTONS) 150
      177. TABLE 176 MIDDLE EAST & AFRICA SPECIALTY CHEMICALS MARKET, BY SOURCE, 2023-2030 (USD MILLION) 151
      178. TABLE 177 MIDDLE EAST & AFRICA SPECIALTY CHEMICALS MARKET, BY SOURCE, 2023-2030 (KILOTONS) 151
      179. TABLE 178 MIDDLE EAST & AFRICA SPECIALTY CHEMICALS MARKET, BY TYPE, 2023-2030 (USD MILLION) 152
      180. TABLE 179 MIDDLE EAST & AFRICA SPECIALTY CHEMICALS MARKET, BY TYPE, 2023-2030 (KILOTONS) 153
      181. TABLE 180 TURKEY SPECIALTY CHEMICALS MARKET, BY SOURCE, 2023-2030 (USD MILLION) 154
      182. TABLE 181 TURKEY SPECIALTY CHEMICALS MARKET, BY SOURCE, 2023-2030 (KILOTONS) 154
      183. TABLE 182 TURKEY SPECIALTY CHEMICALS MARKET, BY TYPE, 2023-2030 (USD MILLION) 155
      184. TABLE 183 TURKEY SPECIALTY CHEMICALS MARKET, BY TYPE, 2023-2030 (KILOTONS) 156
      185. TABLE 184 IRAN SPECIALTY CHEMICALS MARKET, BY SOURCE, 2023-2030 (USD MILLION) 157
      186. TABLE 185 IRAN SPECIALTY CHEMICALS MARKET, BY SOURCE, 2023-2030 (KILOTONS) 157
      187. TABLE 186 IRAN SPECIALTY CHEMICALS MARKET, BY TYPE, 2023-2030 (USD MILLION) 158
      188. TABLE 187 IRAN SPECIALTY CHEMICALS MARKET, BY TYPE, 2023-2030 (KILOTONS) 159
      189. TABLE 188 REST OF MIDDLE EAST & AFRICA SPECIALTY CHEMICALS MARKET, BY SOURCE, 2023-2030 (USD MILLION) 160
      190. TABLE 189 REST OF MIDDLE EAST & AFRICA SPECIALTY CHEMICALS MARKET, BY SOURCE, 2023-2030 (KILOTONS) 160
      191. TABLE 190 REST OF MIDDLE EAST & AFRICA SPECIALTY CHEMICALS MARKET, BY TYPE, 2023-2030 (USD MILLION) 161
      192. TABLE 191 REST OF MIDDLE EAST & AFRICA SPECIALTY CHEMICALS MARKET, BY TYPE, 2023-2030 (KILOTONS) 162
      193. TABLE 192 LATIN AMERICA SPECIALTY CHEMICALS MARKET, BY COUNTRY , 2023-2030 (USD MILLION) 163
      194. TABLE 193 LATIN AMERICA SPECIALTY CHEMICALS MARKET, BY COUNTRY , 2023-2030 (KILOTONS) 163
      195. TABLE 194 LATIN AMERICA SPECIALTY CHEMICALS MARKET, BY SOURCE, 2023-2030 (USD MILLION) 164
      196. TABLE 195 LATIN AMERICA SPECIALTY CHEMICALS MARKET, BY SOURCE, 2023-2030 (KILOTONS) 164
      197. TABLE 196 LATIN AMERICA SPECIALTY CHEMICALS MARKET, BY TYPE, 2023-2030 (USD MILLION) 166
      198. TABLE 197 LATIN AMERICA SPECIALTY CHEMICALS MARKET, BY TYPE, 2023-2030 (KILOTONS) 167
      199. TABLE 198 BRAZIL SPECIALTY CHEMICALS MARKET, BY SOURCE, 2023-2030 (USD MILLION) 168
      200. TABLE 199 BRAZIL SPECIALTY CHEMICALS MARKET, BY SOURCE, 2023-2030 (KILOTONS) 168
      201. TABLE 200 BRAZIL SPECIALTY CHEMICALS MARKET, BY TYPE, 2023-2030 (USD MILLION) 169
      202. TABLE 201 BRAZIL SPECIALTY CHEMICALS MARKET, BY TYPE, 2023-2030 (KILOTONS) 170
      203. TABLE 202 MEXICO SPECIALTY CHEMICALS MARKET, BY SOURCE, 2023-2030 (USD MILLION) 170
      204. TABLE 203 MEXICO SPECIALTY CHEMICALS MARKET, BY SOURCE, 2023-2030 (KILOTONS) 171
      205. TABLE 204 MEXICO SPECIALTY CHEMICALS MARKET, BY TYPE, 2023-2030 (USD MILLION) 172
      206. TABLE 205 MEXICO SPECIALTY CHEMICALS MARKET, BY TYPE, 2023-2030 (KILOTONS) 173
      207. TABLE 206 ARGENTINA SPECIALTY CHEMICALS MARKET, BY SOURCE, 2023-2030 (USD MILLION) 174
      208. TABLE 207 ARGENTINA SPECIALTY CHEMICALS MARKET, BY SOURCE, 2023-2030 (KILOTONS) 174
      209. TABLE 208 ARGENTINA SPECIALTY CHEMICALS MARKET, BY TYPE, 2023-2030 (USD MILLION) 175
      210. TABLE 209 ARGENTINA SPECIALTY CHEMICALS MARKET, BY TYPE, 2023-2030 (KILOTONS) 176
      211. TABLE 210 REST OF LATIN AMERICA SPECIALTY CHEMICALS MARKET, BY SOURCE, 2023-2030 (USD MILLION) 177
      212. TABLE 211 REST OF LATIN AMERICA SPECIALTY CHEMICALS MARKET, BY SOURCE, 2023-2030 (KILOTONS) 177
      213. TABLE 212 REST OF LATIN AMERICA SPECIALTY CHEMICALS MARKET, BY TYPE, 2023-2030 (USD MILLION) 178
      214. TABLE 213 REST OF LATIN AMERICA SPECIALTY CHEMICALS MARKET, BY TYPE, 2023-2030 (KILOTONS) 179
      215. TABLE 214 KEY DEVELOPMENT ANALYSIS 182 13 List of Figures
      216. FIGURE 1 GLOBAL SPECIALTY CHEMICALS MARKET: MARKET STRUCTURE 21
      217. FIGURE 2 RESEARCH PROCESS OF MRFR 23
      218. FIGURE 3 TOP DOWN & BOTTOM UP APPROACH 26
      219. FIGURE 4 MARKET DYNAMICS OVERVIEW 28
      220. FIGURE 5 REVENUE GENERATION GROM BUILDING & CONSTRUCTION INDUSTRY IN INDIA 30
      221. FIGURE 6 GLOBAL LIGHTWEIGHT VEHICLE FORECAST 31
      222. FIGURE 7 REGIONAL PERSONAL CARE INDUSTRY SHARE IN 2023 33
      223. FIGURE 8 SUPPLY CHAIN ANALYSIS 36
      224. FIGURE 9 PORTER’S FIVE FORCES ANALYSIS OF GLOBAL SPECIALTY CHEMICALS MARKET 38
      225. FIGURE 10 GLOBAL SPECIALTY CHEMICALS MARKET, BY SOURCE, 2023-2030 (USD BIILLION) 41
      226. FIGURE 11 GLOBAL SPECIALTY CHEMICALS MARKET, BY SOURCE, 2023-2030 (KT) 42
      227. FIGURE 12 GLOBAL SPECIALTY CHEMICALS MARKET, BY TYPE, 2023-2030 (USD BIILLION) 51
      228. FIGURE 13 GLOBAL SPECIALTY CHEMICALS MARKET, BY TYPE, 2023-2030 (KT) 53
      229. FIGURE 14 GLOBAL SPECIALTY CHEMICALS MARKET, BY REGION, 2023-2030 (USD MILLION) 93
      230. FIGURE 15 GLOBAL SPECIALTY CHEMICALS MARKET, BY REGION, 2023-2030 (KILOTONS) 94
      231. FIGURE 16 NORTH AMERICA SPECIALTY CHEMICALS MARKET, BY COUNTRY (2023) 97
      232. FIGURE 17 EUROPE SPECIALTY CHEMICALS MARKET, BY COUNTRY (2023) 107
      233. FIGURE 18 ASIA-PACIFIC SPECIALTY CHEMICALS MARKET, BY COUNTRY (2023) 128
      234. FIGURE 19 MIDDLE EAST & AFRICA SPECIALTY CHEMICALS MARKET, BY COUNTRY (2023) 150
      235. FIGURE 20 LATIN AMERICA SPECIALTY CHEMICALS MARKET, BY COUNTRY (2023) 163

    Specialty Chemicals Market Segmentation

    Market Segmentation Overview

    • Detailed segmentation data will be available in the full report
    • Comprehensive analysis by multiple parameters
    • Regional and country-level breakdowns
    • Market size forecasts by segment
    Infographic

    Free Sample Request

    Kindly complete the form below to receive a free sample of this Report

    Get Free Sample

    Customer Strories

    “I am very pleased with how market segments have been defined in a relevant way for my purposes (such as "Portable Freezers & refrigerators" and "last-mile"). In general the report is well structured. Thanks very much for your efforts.”

    Victoria Milne

    Founder
    Case Study
    Chemicals and Materials