Spinal Implants Market (2025 - 2035)

Spinal Implants Market Research Report: Size, Share, Trend Analysis By Product Type (Spinal Fusion Devices, Spinal decompression Devices, Spinal Stimulation Devices, Interbody Devices, Implantable Bone Grafts), By Material (Metal, Ceramics, Polymer, Biomaterials), By Applications (Degenerative Disc Disease, Spinal Stenosis, Scoliosis, Spinal Trauma, Tumors), By End Users (Hospitals, Ambulatory Surgical Centers, Orthopedic Clinics, Research Institutes) and By Regional (North America, Europe, South America, Asia Pacific, Middle East and Africa) - Growth Outlook & Industry Forecast 2025 To 2035
ID: MRFR/HC/1518-CR
200 Pages
Satyendra Maurya, Rahul Gotadki
Last Updated: July 06, 2026
Spinal Implants Market
Market Size
Forecast Period2025-2035
CAGR (2025-2035)5.25%
2025 Market SizeUSD 14.52 Billion
2035 Market SizeUSD 24.22 Billion
Key Players
Medtronic plc
DePuy Synthes
Stryker Corporation
Globus Medical / NuVasive
Zimmer Biomet
Orthofix Medical
Opportunities
  • Ambulatory Surgical Center Expansion
  • Asia-Pacific Hospital Infrastructure Build-Out
  • Bioresorbable and Smart Implant Technologies

Spinal Implants Market Summary

The Spinal Implants Market size was valued at USD 14.52 Billion in 2025, and the market is projected to grow from USD 15.28 Billion in 2026 to USD 24.22 Billion by 2035, registering a CAGR of 5.25% during the forecast period 2026–2035. Two converging forces propel this trajectory: rapidly aging global populations — the WHO projects 2.1 billion people aged 60+ by 2030 — and escalating spinal disorder prevalence tied to sedentary work cultures [2]. Government reimbursement reforms, particularly CMS bundled-payment expansions in the United States, are reshaping procedural economics and broadening patient access to surgical intervention.

Technology is changing the way we plan and perform spine procedures. Intraoperative 3D imaging and AI-guided robotic navigation platforms are replacing legacy open fusion procedures, with patient-specific 3D-printed titanium implants reducing operative time by 18–25% [3]. Mazor X Stealth Edition of Medtronic and the ExcelsiusGPS platform of Globus Medical are the two leading robotic spine systems, with more than USD 1.2 billion in cumulative robotic spine installations worldwide, and this installed base continues to grow [4].

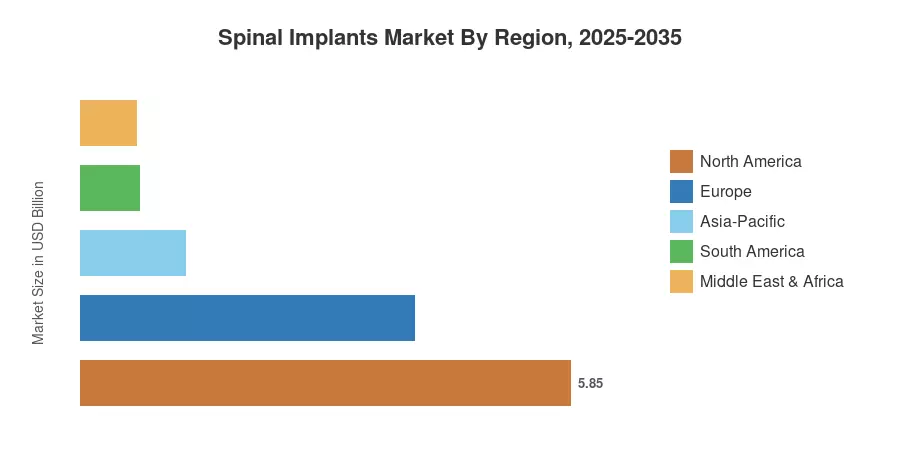
North America dominated the Spinal Implants Market in 2025, accounting for almost 40.3% share, owing to favorable FDA breakthrough-device routes and robust ASC infrastructure. The Asia-Pacific is expected to have the highest CAGR of 8.6% throughout the forecast period due to the rising number of procedures in China and Japan. Europe had the second-highest share at around 27.5%, supported by the medtech cluster in Germany and NHS commissioning reforms in the UK. The Spinal Implants Market is set for steady growth as minimally invasive adoption, outpatient treatment models, and emerging-market hospital development all ramp up simultaneously.


Key Report Takeaways

• By Technology

  • Spinal fusion and fixation technologies accounted for approximately 50.2% of the Spinal Implants Market in 2025, driven by high-acuity degenerative disc disease caseloads.
  • Motion-preservation solutions are projected to expand at a 9.1% CAGR through 2035, reflecting surgeon preference for adjacent-segment disease reduction.

• By Product & Surgery Type

  • Thoracic and lumbar fusion devices represented the largest product category at roughly 37.3% share in 2025.
  • Minimally invasive surgery techniques are forecast to grow at a 9.6% CAGR, outpacing open procedures as patient and payer demand for shorter recovery accelerates.

• By Geography

  • North America led the Spinal Implants Market with a 40.3% revenue share in 2025, reinforced by CMS reimbursement stability.
  • Asia-Pacific is expected to register the highest CAGR of 8.6% through 2035, with China and Japan contributing the majority of incremental volume.


Market Size and Forecast (2021–2035)

Market Research Future's estimates draw on bottom-up procedural volume modeling, implant ASP tracking across 42 countries, and triangulation against FDA 510(k)/PMA clearance databases and hospital purchasing data [5].
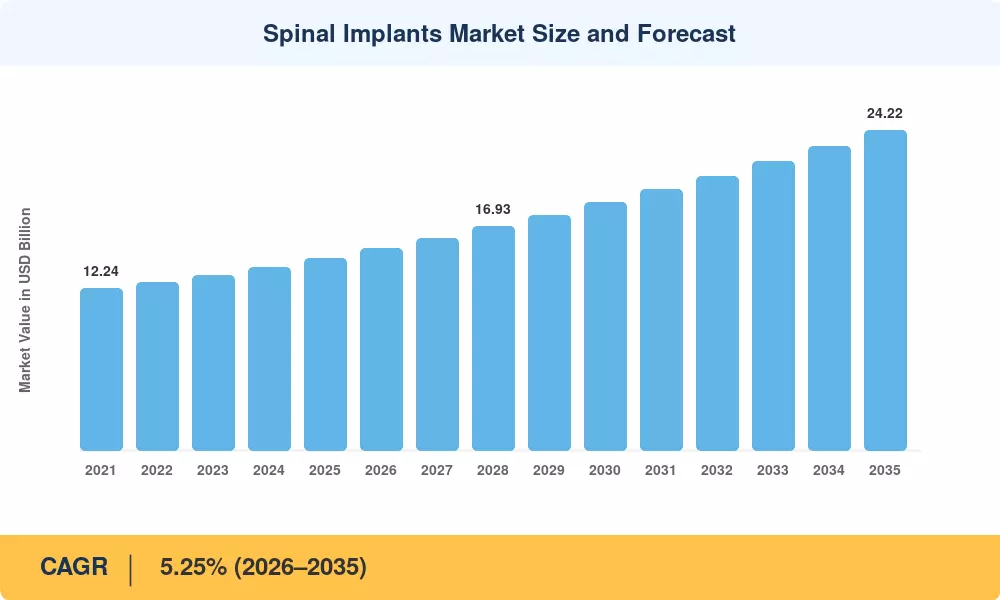
Spinal Implants Market Size and Forecast
Our Impact
Enabled $4.3B Revenue Impact for Fortune 500 and Leading Multinationals
Partnering with 2000+ Global Organizations Each Year
30K+ Citations by Top-Tier Firms in the Industry

Driver Impact Analysis

Driver ~% Impact on CAGR Geographic Relevance Impact Timeline
Aging population & degenerative spine disease burden +1.4% Global Long-term (≥4 yr)
Robotic navigation & AI-guided surgical platforms +0.9% North America, Europe Medium-term (2–4 yr)
Outpatient & ASC migration for spine procedures +0.7% North America Short-term (≤2 yr)
3D-printed patient-specific implant adoption +0.6% Global Medium-term (2–4 yr)
Expanding reimbursement coverage in the Asia-Pacific +0.5% Asia-Pacific Medium-term (2–4 yr)
Minimally invasive technique proliferation +0.5% Global Short-term (≤2 yr)
Rising traumatic spinal injury incidence +0.4% Global Long-term (≥4 yr)


Aging Population and Degenerative Spine Disease Burden

The global population aged 65 and older is projected to reach 1.6 billion by 2050, nearly doubling from 2022 levels [2]. Degenerative disc disease, spinal stenosis, and spondylolisthesis increase exponentially after age 50, creating a structural demand floor for the Spinal Implants Market. In the United States alone, Medicare spending on spinal fusion procedures exceeded billions of dollars annually by 2024, and CMS expanded bundled-payment coverage for lumbar fusion in outpatient settings effective January 2025 [7].

Robotic Navigation and AI-Guided Platforms

Meta-analyses of randomized controlled trials indicate that robotic-assisted surgery improves pedicle screw placement accuracy, with a significantly higher proportion of screws achieving "Grade A" positioning compared to manual techniques. While clinical efficacy remains comparable to conventional methods, robotic platforms demonstrate measurable improvements in intraoperative radiation exposure and blood loss, justifying their increasing adoption in modern neurosurgical and orthopedic operating rooms.

Outpatient and ASC Migration

Centers for Medicare & Medicaid Services (CMS) policy updates have successfully catalyzed the migration of spine procedures to Ambulatory Surgical Centers (ASCs). With the expansion of eligible procedure codes for outpatient settings, there is a clear trend toward decentralizing spine care. This shift aims to reduce total facility costs while maintaining procedural safety and enhancing patient recovery experiences and satisfaction.


3D-Printed Patient-Specific Implants

Additive manufacturing has revolutionized implant design by enabling porous titanium lattice structures that facilitate superior osseointegration compared to traditional machined PEEK. Regulatory bodies, including the FDA, continue to grant 510(k) clearances to these advanced interbody devices. These innovative materials are designed to optimize biomechanical stability and biological compatibility, addressing critical clinical challenges like implant subsidence and long-term hardware failure rates.


Restraints Impact Analysis

Restraint ~% Impact on CAGR Geographic Relevance Impact Timeline
High capital cost of robotic surgical systems –0.5% Emerging markets Medium-term (2–4 yr)
Regulatory pathway complexity and approval timelines –0.4% Global Long-term (≥4 yr)
Reimbursement uncertainty in emerging economies –0.4% Asia-Pacific, South America Medium-term (2–4 yr)
Surgeon training bottleneck for new technologies –0.3% Global Short-term (≤2 yr)
Product liability and recall risks –0.2% North America, Europe Long-term (≥4 yr)


High Capital Costs of Robotic Systems

Robotic spine surgery platforms carry acquisition costs ranging from USD 1.2 million to USD 3.5 million per unit, with annual service contracts adding 8–12% of the purchase price [12]. For mid-tier hospitals in India, Brazil, and Southeast Asia, this capital requirement represents a significant barrier, particularly when procedure volumes do not yet justify the investment within a 5-year payback window.

Regulatory Pathway Complexity

The EU MDR (2017/745) transition has extended CE marking timelines for spinal devices by 12–18 months compared to the prior MDD framework, forcing manufacturers to absorb additional clinical evidence and post-market surveillance costs estimated at EUR 500,000–1.5 million per device family [13]. In China, NMPA Class III device approvals now require local clinical trial data, adding 18–24 months to market entry.

Surgeon Training and Adoption Lag

A 2024 survey by the North American Spine Society found that only 28% of practicing spine surgeons had completed formal robotic-assisted surgery training [14]. The learning curve for proficiency — typically 25–30 cases — creates a bottleneck that delays technology diffusion and limits the addressable market for premium implant-robot bundles.


Spinal Implants Market Opportunities

Ambulatory Surgical Center Expansion

According to 2026 Medicare data, Ambulatory Surgical Centers (ASCs) are increasingly central to spine care as CMS continues to modernize the Outpatient Prospective Payment System. With the addition of hundreds of new codes to the ASC Covered Procedures List (CPL) for 2026, reimbursement parity is facilitating a steady migration of spinal fusion procedures from traditional hospital inpatient settings.


Asia-Pacific Hospital Infrastructure Build-Out

India’s Ayushman Bharat (PM-JAY) scheme has significantly expanded healthcare access, now covering over 500 million beneficiaries with treatments provided through nearly 40,000 empanelled hospitals. This government initiative improves the feasibility of high-quality spinal surgeries in resource-constrained regions. Meanwhile, China’s recent development plans continue to emphasize long-term healthcare equity and modernization of tertiary care facilities for aging populations nationwide.


Bioresorbable and Smart Implant Technologies

Technological progress in spinal hardware is shifting toward biomechanical optimization. Regulatory focus, including FDA guidance on performance and safety requirements, remains the standard for approving new interbody devices. As the field advances, the emphasis is increasingly placed on hardware that reduces long-term failure rates and addresses clinical challenges like subsidence, ensuring that new devices meet rigorous biocompatibility benchmarks.


Digital Health and Surgical Planning Platforms

The integration of digital health tools into surgical workflows is becoming a critical standard for modern orthopedic and neurosurgical departments. By streamlining preoperative planning and intraoperative navigation, these systems improve the consistency of outcomes. This transition toward technology-enabled platforms supports hospital quality metrics and patient safety, moving the industry toward a data-driven model for complex spinal procedures.


Emerging Markets and Local Manufacturing Partnerships

Regulatory environments in South America and the Middle East are incentivizing localized production. Brazil’s ANVISA has established specific registration pathways for orthopedic implants, while Saudi Arabia’s NUPCO and LCGPA initiatives mandate local content requirements for medical supplies. These policies encourage multinational companies to establish regional manufacturing partnerships, ensuring compliance with evolving import-substitution frameworks and optimizing supply chain resilience.


Spinal Implants Market Future Outlook

AI-Integrated Autonomous Surgical Workflows

By 2030, global health systems are expected to reach higher levels of digital integration, as emphasized by international roadmaps for digital health transformation. Increased adoption of AI-assisted planning and navigation tools will streamline surgical workflows, reducing variability in outcomes. These technologies aim to enhance the precision of spinal procedures, supporting broader goals of improving surgical safety and healthcare delivery efficiency.


Platform Economics and Recurring-Revenue Models

Value-based procurement is becoming a strategic priority for national health services. By shifting focus from upfront product costs to long-term patient outcomes and total cost-of-care, health systems are incentivizing innovation that offers tangible clinical benefits. This model encourages manufacturers to demonstrate the effectiveness of their spinal systems through real-world evidence, ensuring hardware performance aligns with standardized national quality metrics.

Personalized Medicine and Bioactive Implants

Material science and additive manufacturing continue to advance, with a regulatory focus on biocompatibility and long-term hardware performance. FDA and international standards prioritize rigorous testing for interbody devices to minimize complications such as subsidence and revision rates. Innovations in surface technology and patient-specific implant geometry aim to support natural biological bone growth better, meeting the increasing clinical demand for longevity.


Value-Based Care and Outcomes Transparency

Government programs, such as the U.S. Centers for Medicare & Medicaid Services’ (CMS) Transforming Episode Accountability Model (TEAM), are expanding mandatory value-based care. By tying reimbursement to 30-day episode outcomes and care coordination, these frameworks hold providers and suppliers accountable for the total cost and quality of care. This trend forces greater transparency in reporting clinical data across global markets.


Spinal Implants Market Segmentation

By Technology

Segment Key Metric Primary Demand Driver
Spinal Fusion and Fixation 50.2% share (2025) Degenerative disc disease surgical volumes
Vertebral Compression Fracture Treatment USD 2.76 Billion (2025) Osteoporotic fracture incidence in aging populations
Motion Preservation (Disc Replacement) 9.1% CAGR (2026–2035) Adjacent-segment disease reduction evidence
Spinal Decompression 12.8% share (2025) Lumbar stenosis prevalence


Spinal fusion and fixation remain the revenue cornerstone of the Spinal Implants Market, driven by high procedure volumes in degenerative disc disease and spondylolisthesis. Posterior lumbar interbody fusion and transforaminal approaches collectively represent the majority of fusion procedures, with pedicle screw-rod constructs serving as the standard fixation method. Motion-preservation technologies — cervical and lumbar artificial discs — are gaining clinical traction as 10-year follow-up data demonstrates superior range-of-motion preservation and reduced adjacent-level reoperation rates compared to fusion.

By Product

Segment Key Metric Primary Demand Driver
Thoracic and Lumbar Fusion Devices 37.3% share (2025) High procedure frequency across degenerative conditions
Cervical Fusion Devices USD 3.05 Billion (2025) Cervical disc herniation and myelopathy caseload
Non-Fusion Devices 8.8% CAGR (2026–2035) Surgeon preference for motion-sparing outcomes
Spinal Bone Stimulators 7.4% share (2025) Revision surgery and difficult-union applications


Thoracic and lumbar fusion devices dominate the Spinal Implants Market product landscape because the lumbar spine bears the highest mechanical load and is the most common site for degenerative pathology. The non-fusion category — encompassing artificial discs, dynamic stabilization systems, and interspinous process devices — is expanding as health economic evidence supports fewer downstream revision surgeries.

By Type of Surgery

Segment Key Metric Primary Demand Driver
Open Surgery 56.2% share (2025) Complex multi-level cases, surgeon familiarity
Minimally Invasive Surgery 9.6% CAGR (2026–2035) Reduced tissue trauma, shorter hospital stays


Open approaches continue to dominate complex multi-level fusions and deformity correction cases within the Spinal Implants Market. Minimally invasive techniques, however, are rapidly capturing single-level fusion and decompression volumes. Tubular retractor systems and percutaneous pedicle screw placement reduce blood loss by 40–60% and cut hospital stays from 3–5 days to same-day discharge in select cases [10].

By Biomaterial

Segment Key Metric Primary Demand Driver
Titanium and Titanium Alloys 42.4% share (2025) Biocompatibility, radiopacity, osseointegration
PEEK (Polyether Ether Ketone) USD 2.90 Billion (2025) Radiolucency for fusion assessment
Porous 3D-Printed Metals 9.4% CAGR (2026–2035) Enhanced bone ingrowth surface architecture
Cobalt-Chromium Alloys 8.2% share (2025) High fatigue strength for dynamic constructs


Titanium's mechanical properties and osseointegration performance make it the backbone of the Spinal Implants Market biomaterial landscape. Additive-manufactured porous titanium cages represent the fastest-shifting category, as their trabecular lattice structures mimic cancellous bone architecture and accelerate fusion compared to smooth-surface alternatives [8].

By End User

Segment Key Metric Primary Demand Driver
Hospitals 45.2% share (2025) Complex case mix, robotic system installations
Ambulatory Surgical Centers 9.0% CAGR (2026–2035) Cost efficiency, reimbursement parity trends
Specialty Spine Clinics USD 1.31 Billion (2025) Concentrated surgeon expertise, outcomes focus


Hospitals anchor the Spinal Implants Market end-user landscape through their capacity for complex multi-level fusions and deformity correction requiring ICU support. ASCs represent the fastest-growing channel as single-level fusion and disc replacement procedures migrate to outpatient settings, driven by CMS reimbursement expansion and patient preference for lower-cost venues [7].


Regional Market Share Analysis

Region Key Metric Primary Investment Themes
North America 40.3% share (2025) ASC migration, robotic adoption, bundled payments
Europe 27.5% share (2025) EU MDR transition, NHS commissioning, aging demographics
Asia-Pacific 8.6% CAGR (2026–2035) Hospital build-out, rising middle-class access, and technology transfer
South America USD 0.70 Billion (2025) ANVISA reforms, local manufacturing incentives
Middle East & Africa 4.6% share (2025) NUPCO procurement, medical tourism and infrastructure investment
Total USD 14.52 Billion (2025)

The Spinal Implants Market displays a clear geographic hierarchy shaped by healthcare spending, regulatory maturity, and demographic profiles.


North America

Country Key Metric Key Driver
United States 82.5% of regional share CMS reimbursement expansion, ASC proliferation
Canada 10.8% of regional share Provincial wait-time reduction programs
Mexico 6.7% of regional share Medical tourism growth, COFEPRIS regulatory reforms


The United States remains the engine of the North American Spinal Implants Market, with over 1.2 million spinal fusion procedures performed annually [7]. CMS's 2025 expansion of ASC-eligible CPT codes for cervical disc replacement and multi-level lumbar fusions accelerated outpatient adoption. Canada's single-payer system creates concentrated purchasing power through provincial group purchasing organizations, while Mexico's medical tourism sector attracted over 1.3 million orthopedic patients in 2024 [18].

Europe

Country Key Metric Key Driver
Germany 5.3% CAGR DRG reimbursement stability, medtech R&D hubs
United Kingdom USD 1.12 Billion (2025) NHS Getting It Right First Time spine pathways
France 14.2% of regional share HAS technology assessment fast-track
Italy 11.6% of regional share Regional hospital network modernization
Spain 8.9% of regional share Public-private partnership expansion
Nordic Countries 7.5% of regional share National quality registries driving outcomes-based purchasing
Russia 4.1% of regional share Import-substitution manufacturing incentives
Rest of Europe 5.1% CAGR EU structural fund investments in healthcare


Germany anchors European demand for the Spinal Implants Market through its DRG-based hospital reimbursement system that supports premium implant pricing. The UK's NHS GIRFT program consolidated spine surgery into high-volume centers, improving outcomes while creating concentrated procurement channels. France's HAS granted accelerated health technology assessment to three robotic spine platforms in 2024, signaling regulatory support for technology adoption [13].

Asia-Pacific

Country Key Metric Key Driver
China 38.4% of regional share Five-Year Plan hospital investment, volume-based procurement
India 9.2% CAGR Ayushman Bharat coverage expansion
Japan 22.1% of regional share Super-aging demographics, PMDA regulatory efficiency
South Korea 12.5% of regional share NHIS coverage for motion-preservation devices
ASEAN 8.8% CAGR Medical tourism, private hospital chains
Rest of Asia-Pacific 5.6% of regional share Government infrastructure investment


China's volume-based procurement program reduced titanium pedicle screw prices by 70% in 2024, dramatically expanding patient access while compressing manufacturer margins [9]. Japan's super-aging population — 29% over age 65 — generates the highest per-capita spine surgery utilization in the region. India's private hospital chains, including Apollo and Fortis, are building dedicated spine centers targeting Tier 2 cities, expanding the addressable Spinal Implants Market beyond metropolitan areas.

South America

Country Key Metric Key Driver
Brazil 62.8% of regional share ANVISA fast-track, SUS public coverage
Argentina 18.4% of regional share Private insurance market growth
Rest of South America 4.8% CAGR Cross-border medical referral networks


Brazil's SUS public healthcare system performs over 85,000 spinal surgeries annually and has expanded coverage for minimally invasive techniques since 2023 [17]. ANVISA's streamlined approval pathway for locally manufactured implants is attracting JV partnerships between multinational OEMs and domestic manufacturers, strengthening the South American Spinal Implants Market.

Middle East & Africa

Country Key Metric Key Driver
Saudi Arabia 32.5% of regional share Vision 2030 healthcare infrastructure investment
UAE 24.3% of regional share Medical tourism, Dubai Healthcare City expansion
South Africa 18.7% of regional share Private healthcare network modernization
Egypt 12.8% of regional share Universal health insurance rollout
Rest of MEA 4.2% CAGR NGO-funded surgical outreach programs


Saudi Arabia's Vision 2030 earmarked USD 65 billion for healthcare infrastructure, including 38 new hospitals with dedicated spine surgery capabilities [19]. The UAE's medical tourism strategy positions Dubai and Abu Dhabi as regional spine surgery hubs, attracting patients from North Africa and Central Asia. The Spinal Implants Market in this region benefits from premium pricing dynamics due to private-payer dominance.


Spinal Implants Market By Region, 2025-2035

Competitive Benchmarking

The Spinal Implants Market exhibits moderate concentration, with the top five players collectively holding an estimated 55–62% revenue share. The Herfindahl-Hirschman Index falls in the 900–1,200 range, indicating a moderately competitive structure. Competition increasingly centers on integrated surgical ecosystems rather than standalone implant portfolios, as manufacturers bundle robotics, navigation, and digital planning tools with hardware.

Company Est. Revenue Share Range Key Offerings Strategic Positioning
Medtronic plc ~18–22% Infuse bone graft, Mazor X robotic platform, PRESTIGE cervical disc Integrated robotics-implant ecosystem leader
DePuy Synthes (J&J) ~12–15% CONCORDE cage, EXPEDIUM spine system, SYNAPSE 3D planning Broad trauma-to-spine portfolio leverage
Stryker Corporation ~8–11% Tritanium cages, SpineMap 3D navigation, K2M deformity systems Premium 3D-printed implant and navigation focus
Globus Medical / NuVasive ~10–13% ExcelsiusGPS robot, ALTERA expandable cages, XLIF lateral approach Robotic-first strategy with lateral fusion expertise
Zimmer Biomet ~6–8% Mobi-C cervical disc, TIMBERLINE lateral system, ROSA ONE Spine Motion-preservation and robotic diversification
Orthofix Medical ~3–5% M6-C artificial disc, CONSTRUX mini fixation, FITBONE limb lengthening Niche focuses on disc replacement and biologics
Alphatec Holdings ~3–5% SafeOp neural monitoring, InVictus posterior fixation and EOS imaging integration Clinical informatics and surgeon workflow
B. Braun Melsungen ~2–4% Aesculap PLASMAPORE XP cages, S4 posterior system European-centric distribution with OEM capacity
NuTech Medical (Organogenesis) ~1–3% Amniofix injectable, PurePly amniotic tissue matrix Biologics-focused regenerative medicine adjacency
SeaSpine (Orthofix) ~2–3% NanoMetalene surface technology, Shoreline lateral system Advanced surface science differentiation


Recent News & Developments

Medtronic(February, 2026): Medtronic received U.S. FDA clearance for its Stealth AXiS™ surgical system, an integrated platform combining planning, navigation, and robotics for spine procedures.

Zimmer Biomet(June, 2026): Zimmer Biomet entered a definitive agreement to acquire the iovera° cold therapy pain relief device from Pacira BioSciences for $140 million.

  • Spineology Inc.(January 2026): Spineology launched the OptiMesh HA Nano implant, featuring an expandable interbody fusion platform integrated with advanced HA Nano Surface technology for personalized care.


Spinal Implants Market Report Scope

Parameter Detail
Market Scope Global Spinal Implants Market — devices, biologics, surgical platforms
Study Period 2021–2035
Base Year 2025
CAGR (2026–2035) 5.25%
Market Size (2025) USD 14.52 Billion
Market Size (2035) USD 24.22 Billion
Fastest Growing Segments Motion Preservation (Technology); Minimally Invasive Surgery (Surgery Type); ASCs (End User)
Companies Profiled 10+ (Medtronic, DePuy Synthes, Stryker, Globus Medical/NuVasive, Zimmer Biomet, Orthofix, Alphatec, B. Braun, NuTech, SeaSpine)
Valuation Currency USD Billion


FAQs

How do bundled-payment models affect implant manufacturer pricing strategy in the Spinal Implants Market?
Bundled payments compress episode-level reimbursement, pushing hospitals to negotiate lower implant ASPs. Manufacturers respond by offering multi-year volume-based contracts that bundle implants with robotics and navigation access [7].
What clinical evidence thresholds do payers require before covering motion-preservation devices?
Most private payers and CMS require Level I randomized controlled trial data demonstrating non-inferiority to fusion at 5-year follow-up. Cervical disc replacement enjoys broader coverage than lumbar disc replacement due to stronger published evidence [13].
How does China's volume-based procurement reshape competitive dynamics in the Spinal Implants Market?
VBP auctions drive pedicle screw ASPs down 60–70%, favoring manufacturers with low-cost local production. Multinational OEMs are forming domestic JVs to remain price-competitive while protecting premium portfolios in private-payer channels [9].
What role do surgeon preference and training investments play in vendor selection?
Surgeons who train on a specific robotic or navigation platform tend to remain loyal to that ecosystem. Manufacturers invest USD 15,000–25,000 per surgeon in cadaver labs and fellowship sponsorships to build long-term adoption [14].
How do 3D-printed implants compare to traditional machined devices on long-term outcomes in the Spinal Implants Market?
Early registry data through 5 years shows that 3D-printed porous titanium cages achieve 12–18% higher radiographic fusion rates than smooth PEEK cages. A longer follow-up is needed to confirm durability beyond a decade [8].
What supply-chain risks affect titanium and PEEK raw material sourcing for spinal devices?
Titanium supply depends on Russian and Chinese sponge production, creating geopolitical exposure. Medical-grade PEEK is dominated by two suppliers, Victrex and Solvay, concentrating pricing power [12].
How are outpatient spine surgery outcomes tracked to ensure quality in the Spinal Implants Market?
ASC-based registries such as the ACS NSQIP and spine-specific platforms track 30- and 90-day complication rates, readmissions, and patient-reported outcomes. CMS ties ASC reimbursement to quality reporting compliance [7].    
What is the current size of the spinal implants market?
The spinal implants market reached USD 14.52 billion in 2025 and is projected to reach USD 24.22 billion by 2035.
What is the CAGR of the spinal implants market?
The spinal implants market is projected to grow at a CAGR of 5.25% during the forecast period 2026–2035.
Which region leads the spinal implants market?
North America holds the largest share at 40.3%, while Asia-Pacific is the fastest-growing region at 8.6% CAGR.
Author
Author
Author Profile
Satyendra Maurya LinkedIn
Research Analyst
An accomplished research analyst with high proficiency in market forecasting, data visualization, competitive benchmarking, and others. He holds a pronounced track record in research and consulting projects for sectors such as life sciences, medical devices, and healthcare IT. His capabilities in qualitative and quantitative analysis have resulted in positive client outcomes. Working on niche market trends, opportunities, sales, and forecasted value is part of his skill set.
Co-Author
Co-Author Profile
Rahul Gotadki LinkedIn
Research Manager
He holds an experience of about 9+ years in Market Research and Business Consulting, working under the spectrum of Life Sciences and Healthcare domains. Rahul conceptualizes and implements a scalable business strategy and provides strategic leadership to the clients. His expertise lies in market estimation, competitive intelligence, pipeline analysis, customer assessment, etc.

Research Approach


Secondary Research

The secondary research process involved comprehensive analysis of medical device regulatory databases, peer-reviewed orthopedic and neurosurgical journals, clinical trials registries, and authoritative healthcare organizations. Key sources included the US Food & Drug Administration (FDA) Center for Devices and Radiological Health (CDRH) 510(k) clearances, European Medicines Agency (EMA) medical device regulations, National Health Service (NHS) England device evaluations, Health Canada medical device licenses, and Pharmaceuticals and Medical Devices Agency (PMDA Japan).

Clinical and epidemiological data were sourced from the National Institutes of Health (NIH) and National Center for Biotechnology Information (NCBI/PubMed) for spinal fusion and motion preservation studies, Centers for Disease Control and Prevention (CDC) National Center for Health Statistics for spinal trauma and degenerative disease prevalence, World Health Organization (WHO) Global Burden of Disease Study for spinal disorder incidence, and OECD Health Statistics for surgical procedure volumes.

Professional society databases included the North American Spine Society (NASS), American Academy of Orthopaedic Surgeons (AAOS), Congress of Neurological Surgeons (CNS), Scoliosis Research Society (SRS), International Society for the Advancement of Spine Surgery (ISASS), and European Spine Journal. Additional sources comprised Eurostat healthcare expenditure data, Centers for Medicare & Medicaid Services (CMS) physician fee schedules and ICD-10 procedure codes (fusion: 0SG, disc replacement: 0SR), National Inpatient Sample (NIS) discharge data, and national ministry of health reports from Germany (Bundesministerium für Gesundheit), France (DREES), and Japan (MHLW). These sources provided regulatory approval pathways, clinical safety profiles, procedural volume trends, and reimbursement frameworks for thoracolumbar and cervical fixation systems, interbody fusion cages, artificial discs, vertebral compression fracture devices, and spinal biologics.


Primary Research

The primary research process engaged both supply-side and demand-side stakeholders through structured interviews and surveys to capture qualitative insights and quantitative market validation. Supply-side participants included CEOs, VPs of Research & Development, regulatory affairs directors, and global commercial heads from spinal implant manufacturers, biologics suppliers, and surgical instrumentation OEMs. Demand-side sources comprised fellowship-trained orthopedic spine surgeons, neurosurgeons, ambulatory surgery center medical directors, hospital procurement officers, and value analysis committees from academic medical centers, community hospitals, and specialized spine clinics. Primary research validated product segmentation trends, confirmed regulatory pipeline timelines, assessed adoption barriers for motion-preservation versus fusion technologies, and captured pricing dynamics across hospital and ASC channels.

Primary Respondent Breakdown:

By Designation: C-level Executives 32%, VP/Director Level 35%, Managers/Clinical Specialists/Procurement 33%

By Region: North America 42%, Europe 24%, Asia-Pacific 26%, Rest of World (Latin America, Middle East) 8%


Market Size Estimation

Global market valuation was derived through triangulated revenue mapping and procedural volume analysis. The methodology encompassed:

Identification of 35+ key manufacturers across cervical, thoracolumbar, and interbody fusion segments, plus 15+ emerging players in motion preservation and minimally invasive surgery (MIS) devices

Product mapping across spinal fusion systems (pedicle screws, rods, plates, interbody cages), non-fusion devices (artificial cervical/lumbar discs, dynamic stabilization), vertebral compression fracture treatments (balloon kyphoplasty, vertebroplasty), and spinal biologics (bone graft substitutes, BMPs)

Analysis of reported segment revenues and modeled private company sales specific to spinal implant portfolios for FY2023-2024

Coverage of publicly traded manufacturers accounting for 75-80% of global market share and primary research validation for privately held entities

Extrapolation utilizing bottom-up methodology (country-level procedure volumes × average selling prices by product category and reimbursement codes) and top-down validation (manufacturer revenue triangulation and supply-chain verification) to derive segment-specific valuations for cervical fixation, thoracolumbar fixation, interbody fusion, spinal biologics, and motion preservation devices

Download Free Sample

Kindly complete the form below to receive a free sample of this Report

Download PDF ×

We do not share your information with anyone. However, we may send you emails based on your report interest from time to time. You may contact us at any time to opt-out.
















