• Cat-intel
  • MedIntelliX
  • Resources
  • About Us
  • Hero Background
    English
    Chinese
    French
    Japanese
    Korean
    German
    Spanish

    Stainless Steel Cable Ties Market Share

    ID: MRFR/CnM/5543-CR
    154 Pages
    Anshula Mandaokar
    December 2018

    Stainless-Steel Cable Ties Market by Type (uncoated stainless-steel cable ties and coated stainless-steel cable ties), By Application (transportation, oil & gas exploration, marine, chemicals, mining, construction, electronics, others) and Region (North America, Europe, Asia Pacific, The Middle East & Africa (MEA), Latin America) - Forecast till 2035

    Share:
    Download PDF ×

    We do not share your information with anyone. However, we may send you emails based on your report interest from time to time. You may contact us at any time to opt-out.

    Stainless Steel Cable Ties Market Infographic
    $ 4,950.0
    $ 5,950.0
    $ 7,250.0

    Market Share

    Stainless Steel Cable Ties Market Share Analysis

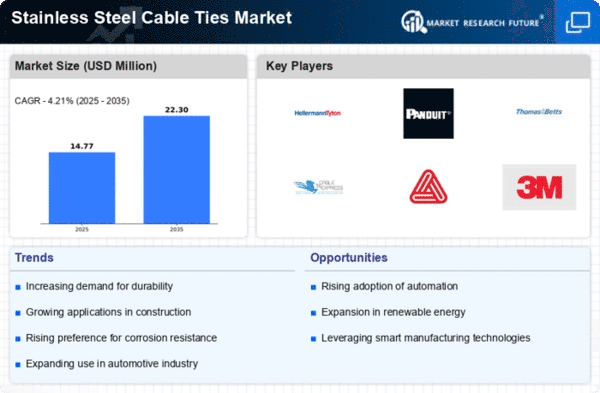
    The global market for stainless-steel cable ties reached a value of USD 184,736.6 thousand in 2017, and it's anticipated to grow to USD 220,990.5 thousand by 2023, with a yearly growth rate of 3.12%. In terms of volume, the market was 124,157 thousand tons in 2017, and it's estimated to have a 2.18% yearly growth during the forecast period. This growth is driven by increased use in transportation, securing exhaust heat wrap in vehicles, and applications in the oil & gas industry. Uncoated stainless-steel ties held the larger market share in 2017, while coated ties are expected to register a higher growth rate due to increased demand for corrosion protection. In applications, transportation had the largest share in 2017 and is predicted to grow steadily, fueled by its use in various automotive components. Asia-Pacific dominated the market in 2017 and is expected to continue leading, driven by rapid industrialization. The stainless-steel cable ties market, valued at USD 184,736.6 thousand in 2017, is poised to expand to USD 220,990.5 thousand by 2023, demonstrating a 3.12% annual growth rate. The forecasted increase is underpinned by growing utilization in transportation, including the securing of exhaust heat wrap in vehicles and applications within the oil & gas sector. Uncoated stainless-steel ties, commanding a significant market share in 2017, are expected to maintain their dominance, while coated ties show promise with a higher projected growth rate due to increased demand for corrosion protection. With transportation as the leading application in 2017, the market's steady rise is further propelled by the ongoing rapid industrialization in the Asia-Pacific region. The stainless-steel cable ties market's growth trajectory is reinforced by the dominance of uncoated stainless-steel ties, which, due to their cost-effectiveness, are anticipated to maintain a significant share. In contrast, coated stainless-steel cable ties, benefiting from a higher protection level against corrosion, exhibit potential for increased demand, projecting a 3.26% CAGR during the forecast period. The transportation sector, spearheading the market in 2017, is anticipated to continue this trend, driven by the ties' role in fastening and securing vital components in automobiles. Asia-Pacific, with its ongoing rapid industrialization, remains a crucial driver, poised to retain its market dominance.

    Market Summary

    The Global Stainless Steel Cable Ties Market is projected to grow from 1250 USD Million in 2024 to 2750 USD Million by 2035.

    Key Market Trends & Highlights

    Stainless Steel Cable Ties Key Trends and Highlights

    • The market is expected to witness a compound annual growth rate (CAGR) of 7.43% from 2025 to 2035.
    • By 2035, the market valuation is anticipated to reach 2750 USD Million, indicating robust growth.
    • In 2024, the market is valued at 1250 USD Million, reflecting a strong demand for stainless steel cable ties.
    • Growing adoption of stainless steel cable ties due to their durability and resistance to corrosion is a major market driver.

    Market Size & Forecast

    2024 Market Size 1250 (USD Million)
    2035 Market Size 2750 (USD Million)
    CAGR (2025 - 2035) 7.43%
    Largest Regional Market Share in 2024 -)

    Major Players

    Apple Inc (US), Microsoft Corp (US), Amazon.com Inc (US), Alphabet Inc (US), Berkshire Hathaway Inc (US), Tesla Inc (US), Meta Platforms Inc (US), Johnson & Johnson (US), Visa Inc (US), Procter & Gamble Co (US)

    Market Trends

    The increasing demand for durable and corrosion-resistant fastening solutions across various industries appears to be driving the growth of the stainless steel cable ties market.

    U.S. Department of Commerce

    Stainless Steel Cable Ties Market Market Drivers

    Market Growth Projections

    The Global Stainless Steel Cable Ties Market Industry is projected to experience robust growth over the next decade. With an anticipated market value of 1250 USD Million in 2024, the industry is set to expand significantly, reaching approximately 2750 USD Million by 2035. This growth trajectory suggests a compound annual growth rate of 7.43% from 2025 to 2035, indicating a strong demand for stainless steel cable ties across various sectors. Factors such as increased industrialization, technological advancements, and a focus on sustainability are likely to drive this growth, positioning the market for continued success.

    Increased Focus on Sustainability

    The Global Stainless Steel Cable Ties Market Industry is witnessing a shift towards sustainable practices, prompting manufacturers to adopt eco-friendly materials. Stainless steel, known for its recyclability and longevity, aligns with the growing emphasis on reducing environmental impact. Companies are increasingly prioritizing sustainable sourcing and production methods, which could attract environmentally conscious consumers. This trend may contribute to the market's expansion, as the demand for sustainable products continues to rise. The industry's commitment to sustainability is likely to enhance its reputation and foster long-term growth.

    Expansion of Renewable Energy Sector

    The Global Stainless Steel Cable Ties Market Industry is benefiting from the expansion of the renewable energy sector. As the world shifts towards sustainable energy sources, the need for reliable fastening solutions in solar and wind energy installations increases. Stainless steel cable ties are essential for securing cables and components in these systems, ensuring durability and safety. The growth of renewable energy projects globally is likely to drive demand for stainless steel cable ties, contributing to the market's projected value of 2750 USD Million by 2035. This trend underscores the ties' versatility and importance in modern energy solutions.

    Rising Demand in Construction Sector

    The Global Stainless Steel Cable Ties Market Industry experiences a notable surge in demand driven by the construction sector. As urbanization accelerates, the need for durable and corrosion-resistant materials becomes paramount. Stainless steel cable ties are increasingly utilized in various applications, including securing electrical wiring and plumbing systems. This trend is reflected in the projected market value, which is expected to reach 1250 USD Million in 2024. The construction industry's growth, particularly in emerging economies, is likely to bolster the demand for stainless steel cable ties, thereby enhancing their market presence.

    Growing Demand in Automotive Applications

    The Global Stainless Steel Cable Ties Market Industry is experiencing increased demand from the automotive sector, where these ties are utilized for securing components and wiring. The automotive industry's shift towards lightweight materials and enhanced safety features drives the need for reliable fastening solutions. Stainless steel cable ties offer superior strength and resistance to environmental factors, making them ideal for automotive applications. As the automotive market continues to expand, the demand for stainless steel cable ties is expected to rise, further solidifying their role in this critical industry.

    Technological Advancements in Manufacturing

    Technological innovations in manufacturing processes are significantly impacting the Global Stainless Steel Cable Ties Market Industry. Advanced production techniques, such as automated machinery and precision engineering, enhance the quality and efficiency of stainless steel cable ties. These advancements allow for the creation of ties with improved tensile strength and durability, catering to diverse applications across various sectors. As manufacturers invest in technology, the market is poised for growth, with projections indicating a compound annual growth rate of 7.43% from 2025 to 2035. This technological evolution is likely to redefine industry standards.

    Market Segment Insights

    Other Description

    These market figures are then used for providing consistent analysis along with mission-critical insights.

    For the scope of the research, MRFR’s stainless-steel cable ties market report offers a comprehensive segmental analysis of the global market for stainless-steel cable ties

    Bharti Airtel has joined the SEA-ME-WE-6 undersea cable consortium in an effort to expand its high-speed global network capacity in order to service India's rapidly rising digital economy. Airtel has announced that it will be a "significant investor" in the SEA-ME-WE-6 cable system, anchoring 20% of the total investment in the line, which will go live in 2025. The SEA-ME-WE-6 consortium's other 12 members will connect Singapore and France, making it one of the world's largest undersea cable systems.

    The BestNet Cable Cubby from Eurotech Technologies combines AV control, communication, and AC power. The table-top flush mount Cable Cubby enclosures provide continuous network, phone, VGA, microphone, HDMI output, USB, and 3.5 audio access. Where many, distributed table-top cable connections are required, the BestNet Cable Cubby enclosures are suitable for boardrooms, educational institutions, the hospitality industry, and big training facilities.

    Get more detailed insights about Stainless-Steel Cable Ties Market Research Report - Global Forecast to 2030

    Regional Insights

    Key Companies in the Stainless Steel Cable Ties Market market include

    Industry Developments

    Bharti Airtel has joined the SEA-ME-WE-6 undersea cable consortium in an effort to expand its high-speed global network capacity in order to service India's rapidly rising digital economy. Airtel has announced that it will be a "significant investor" in the SEA-ME-WE-6 cable system, anchoring 20% of the total investment in the line, which will go live in 2025. The SEA-ME-WE-6 consortium's other 12 members will connect Singapore and France, making it one of the world's largest undersea cable systems.

    The BestNet Cable Cubby from Eurotech Technologies combines AV control, communication, and AC power. The table-top flush mount Cable Cubby enclosures provide continuous network, phone, VGA, microphone, HDMI output, USB, and 3.5 audio access. Where many, distributed table-top cable connections are required, the BestNet Cable Cubby enclosures are suitable for boardrooms, educational institutions, the hospitality industry, and big training facilities.

    Intended Audience:

      • Manufactures
      • Aftermarket suppliers
      • Potential Investors
      • Regional Manufacturers’ Associations
      • Plastics Scraps Suppliers
      • Traders, Distributors, and Suppliers of Stainless-Steel Cable Ties
      • Government & Regional Agencies and Research Organizations

    Future Outlook

    Stainless Steel Cable Ties Market Future Outlook

    The Global Stainless Steel Cable Ties Market is projected to grow at a 7.43% CAGR from 2024 to 2035, driven by rising demand in construction, automotive, and electronics sectors.

    New opportunities lie in:

    • Develop eco-friendly stainless steel cable ties to capture environmentally conscious consumers.
    • Leverage advanced manufacturing technologies to enhance product durability and reduce costs.
    • Expand distribution channels in emerging markets to increase market penetration and accessibility.

    By 2035, the market is expected to exhibit robust growth, reflecting increased industrial applications and innovation.

    Market Segmentation

    Report Scope

    Report Attribute/Metric Details
      Market Size   2030 : USD 220,900 million
      CAGR   CAGR 3.12%
      Base Year   2020
      Forecast Period   2022-2030
      Historical Data   2019
      Forecast Units   Value (USD Million)
      Report Coverage   Revenue Forecast, Competitive Landscape, Growth Factors, and Trends
      Segments Covered   Application, end use and region
      Geographies Covered   Asia-Pacific, North America, Europe, Latin America, and the Middle East & Africa
      Key Vendors   ABB, Tridon Australia, Dot Group International, Essentra PLC, Advanced Cable Ties Inc., HellermannTyton, NSi Industries, LLC, Norma Group, Panduit, and Heyco.
      Key Market Opportunities   Demand for stainless-steel cable ties has also increasing due to their growing application prospects.
      Key Market Drivers   Furthermore, it sheds light on the comprehensive competitive landscape of the global market.

    Market Highlights

    Author

    Anshula Mandaokar
    Team Lead - Research

    She holds an experience of about 6+ years in market research and business consulting, working under the spectrum of information communication technology, telecommunications and semiconductor domains. aarti conceptualizes and implements a scalable business strategy and provides strategic leadership to the clients. her expertise lies in market estimation, competitive intelligence, pipeline analysis, customer assessment, etc.

    Leave a Comment

    Latest Comments

    John Doe
    john@example.com

    This is a great article! Really helped me understand the topic better.

    Posted on July 23, 2025, 10:15 AM
    Jane Smith
    jane@domain.com

    Thanks for sharing this. I’ve bookmarked it for later reference.

    Posted on July 22, 2025, 7:45 PM

    FAQs

    At what CAGR is the Stainless-Steel Cable Ties Market predicted to grow during the forecast period?

    Stainless-Steel Cable Ties Market is predicted to grow at 3.12% through forecast period of 2021-2030.

    What is the forecast period of Stainless-Steel Cable Ties Market research report?

    The forecast period for Stainless-Steel Cable Ties Market research report is 2021-2030.

    Which region will lead the global Stainless-Steel Cable Ties Market?

    Global Stainless-Steel Cable Ties Market is dominated by APAC region.

    1. Executive Summary
    2. Market Introduction
      1. Definition 17
      2. Scope of the Study 17
      3. List Of Assumptions 18
      4. Market Structure 19
    3. Market Insights
      1. Global Market Share, By Region (%) 21
    4. Research Methodology
      1. Research Process 26
      2. Primary Research 27
      3. Secondary Research 28
      4. Market Size Estimation 29
      5. Forecast Model 29
    5. Market Dynamics
      1. Introduction 31
      2. Drivers 32
        1. Increasing Demand In Various End-Use Industries 32
        2. Rapid Industrialization In Asia-Pacific 32
        3. Drivers Impact Analysis 33
      3. Restraint 34
        1. Availability Of Alternatives 34
        2. Restraint Impact Analysis 34
      4. Opportunities 34
        1. Integration Of RFID Technology 34
      5. Challenge 35
        1. Fluctuating Stainless-Steel Prices 35
    6. Market Factor Analysis
      1. Supply Chain Analysis 37
        1. Raw Material Suppliers 37
        2. Stainless-Steel Cable Ties Producers 37
        3. Distribution Channel 38
        4. Application 38
      2. Porter’s Five Forces Analysis 38
        1. Threat Of New Entrants 38
        2. Threat Of Rivalry 39
        3. Threat Of Substitutes 39
        4. Bargaining Power Of Suppliers 39
        5. Bargaining Power Of Buyers 39
    7. Global Stainless-Steel Cable Ties Market, By Type
      1. Introduction 41
      2. Coated Stainless-Steel Cable Ties 43
      3. Uncoated Stainless-Steel Cable Ties 44
    8. Global Stainless-Steel Cable Ties Market, By Application
      1. Introduction 47
      2. Transportation 49
      3. Oil & Gas Exploration 50
      4. Marine 51
      5. Mining 52
      6. Electronics 53
      7. Chemicals 54
      8. Construction 55
      9. Others 56
    9. Global Stainless-Steel Cable Ties Market, By Region
      1. Introduction 58
      2. North America 62
        1. US 64
        2. Canada 66
      3. Europe 68
        1. Germany 71
        2. UK 73
        3. France 75
        4. Spain 77
        5. Italy 79
        6. Russia 81
        7. Poland 83
        8. Rest Of Europe 85
      4. Asia Pacific 87
        1. China 90
        2. Japan 92
        3. India 94
        4. South Korea 96
        5. Indonesia 98
        6. Taiwan 100
        7. Australia & New Zealand 102
        8. Rest Of Asia Pacific 104
      5. Latin America 106
        1. Mexico 109
        2. Argentina 111
        3. Brazil 113
        4. Rest Of Latin America 115
      6. Middle East And Africa 117
        1. Turkey 119
        2. Saudi Arabia 121
        3. UAE 123
        4. Rest Of Middle East And Africa 125
    10. Competitive Landscape
      1. Introduction 129
      2. Key Developments Analysis 129
    11. Company Profiles
      1. HellermannTyton 131
        1. Company Overview 131
        2. Financial Overview 131
        3. Products Offered 131
        4. Key Development 132
        5. SWOT Analysis 132
        6. Key Strategies 132
      2. Panduit 133
        1. Company Overview 133
        2. Financial Overview 133
        3. Products Offered 133
        4. Key Developments 134
        5. SWOT Analysis 134
        6. Key Strategies 134
      3. ABB 135
        1. Company Overview 135
        2. Financial Overview 135
        3. Products Offered 136
        4. Key Developments 137
        5. SWOT Analysis 137
        6. Key Strategies 137
      4. Norma Group 138
        1. Company Overview 138
        2. Financial Overview 138
        3. Products Offered 139
        4. Key Developments 139
        5. SWOT Analysis 139
        6. Key Strategies 139
      5. Essentra PLC 140
        1. Company Overview 140
        2. Financial Overview 140
        3. Products Offered 140
        4. Key Developments 141
        5. SWOT Analysis 141
        6. Key Strategies 141
      6. Heyco 142
        1. Company Overview 142
        2. Financial Overview 142
        3. Products Offered 142
        4. Key Developments 142
        5. SWOT Analysis 142
        6. Key Strategies 142
      7. Tridon Australia 143
        1. Company Overview 143
        2. Financial Overview 143
        3. Products Offered 143
        4. Key Developments 143
        5. SWOT Analysis 144
        6. Key Strategies 144
      8. NSi Industries, LLC 145
        1. Company Overview 145
        2. Financial Overview 145
        3. Products Offered 145
        4. Key Developments 145
        5. SWOT Analysis 146
        6. Key Strategies 146
      9. Dot Group International 147
        1. Company Overview 147
        2. Financial Overview 147
        3. Products Offered 147
        4. Key Developments 147
        5. SWOT Analysis 148
        6. Key Strategies 148
      10. Advanced Cable Ties Inc. 149
        1. Company Overview 149
        2. Financial Overview 149
        3. Key Developments 150
        4. SWOT Analysis 150
        5. Key Strategies 150
    12. Conclusion
    13. List of Tables and Figures
      1. 13 List Of Tables
      2. TABLE 1 LIST OF ASSUMPTIONS 18
      3. TABLE 2 GLOBAL STAINLESS-STEEL CABLE TIES, BY TYPE, 2020-2027 (USD THOUSAND) 41
      4. TABLE 3 GLOBAL STAINLESS-STEEL CABLE TIES MARKET, BY TYPE, 2020-2027 (THOUSAND UNITS) 42
      5. TABLE 4 GLOBAL STAINLESS-STEEL CABLE TIES MARKET FOR COATED STAINLESS-STEEL CABLE TIES, BY REGION, 2020-2027 (USD THOUSAND) 43
      6. TABLE 5 GLOBAL STAINLESS-STEEL CABLE TIES MARKET FOR COATED STAINLESS-STEEL CABLE TIES, BY REGION, 2020-2027 (THOUSAND UNITS) 44
      7. TABLE 6 GLOBAL STAINLESS-STEEL CABLE TIES MARKET FOR UNCOATED STAINLESS-STEEL CABLE TIES, BY REGION, 2020-2027 (USD THOUSAND) 44
      8. TABLE 7 GLOBAL STAINLESS-STEEL CABLE TIES MARKET FOR UNCOATED STAINLESS-STEEL CABLE TIES, BY REGION, 2020-2027 (THOUSAND UNITS) 45
      9. TABLE 8 GLOBAL STAINLESS-STEEL CABLE TIES, BY APPLICATION, 2020-2027 (USD THOUSAND) 47
      10. TABLE 9 GLOBAL STAINLESS-STEEL CABLE TIES MARKET, BY APPLICATION, 2020-2027 (THOUSAND UNITS) 48
      11. TABLE 10 GLOBAL STAINLESS-STEEL CABLE TIES MARKET FOR TRANSPORTATION, BY REGION, 2020-2027 (USD THOUSAND) 49
      12. TABLE 11 GLOBAL STAINLESS-STEEL CABLE TIES MARKET FOR TRANSPORTATION, BY REGION, 2020-2027 (THOUSAND UNITS) 49
      13. TABLE 12 GLOBAL STAINLESS-STEEL CABLE TIESMARKET FOR OIL & GAS EXPLORATION, BY REGION, 2020-2027 (USD THOUSAND) 50
      14. TABLE 13 GLOBAL STAINLESS-STEEL CABLE TIES MARKET FOR OIL & GAS EXPLORATION, BY REGION, 2020-2027 (THOUSAND UNITS) 50
      15. TABLE 14 GLOBAL STAINLESS-STEEL CABLE TIES MARKET FOR MARINE, BY REGION, 2020-2027 (USD THOUSAND) 51
      16. TABLE 15 GLOBAL STAINLESS-STEEL CABLE TIESMARKET FOR MARINE, BY REGION, 2020-2027 (THOUSAND UNITS) 51
      17. TABLE 16 GLOBAL STAINLESS-STEEL CABLE TIES MARKET FOR MINING, BY REGION, 2020-2027 (USD THOUSAND) 52
      18. TABLE 17 GLOBAL STAINLESS-STEEL CABLE TIESMARKET FOR MINING, BY REGION, 2020-2027 (THOUSAND UNITS) 52
      19. TABLE 18 GLOBAL STAINLESS-STEEL CABLE TIES MARKET FOR ELECTRONICS, BY REGION, 2020-2027 (USD THOUSAND) 53
      20. TABLE 19 GLOBAL STAINLESS-STEEL CABLE TIES MARKET FOR ELECTRONICS, BY REGION, 2020-2027 (THOUSAND UNITS) 53
      21. TABLE 20 GLOBAL STAINLESS-STEEL CABLE TIES MARKET FOR CHEMICALS, BY REGION, 2020-2027 (USD THOUSAND) 54
      22. TABLE 21 GLOBAL STAINLESS-STEEL CABLE TIES MARKET FOR CHEMICALS, BY REGION, 2020-2027 (THOUSAND UNITS) 54
      23. TABLE 22 GLOBAL STAINLESS-STEEL CABLE TIES MARKET FOR CONSTRUCTION, BY REGION, 2020-2027 (USD THOUSAND) 55
      24. TABLE 23 GLOBAL STAINLESS-STEEL CABLE TIES MARKET FOR CONSTRUCTION, BY REGION, 2020-2027 (THOUSAND UNITS) 55
      25. TABLE 24 GLOBAL STAINLESS-STEEL CABLE TIES MARKET FOR OTHERS, BY REGION, 2020-2027 (USD THOUSAND) 56
      26. TABLE 25 GLOBAL STAINLESS-STEEL CABLE TIES MARKET FOR OTHERS, BY REGION, 2020-2027 (THOUSAND UNITS) 56
      27. TABLE 26 GLOBAL STAINLESS-STEEL CABLE TIES MARKET, BY REGION, 2020-2027 (USD THOUSAND) 58
      28. TABLE 27 GLOBAL STAINLESS-STEEL CABLE TIES MARKET, BY REGION, 2020-2027 (THOUSAND UNITS) 59
      29. TABLE 28 GLOBAL STAINLESS-STEEL CABLE TIES MARKET, BY TYPE, 2020-2027 (USD THOUSAND) 60
      30. TABLE 29 GLOBAL STAINLESS-STEEL CABLE TIES MARKET, BY TYPE, 2020-2027 (THOUSAND UNITS) 60
      31. TABLE 30 GLOBAL STAINLESS-STEEL CABLE TIES MARKET, BY APPLICATION, 2020-2027 (USD THOUSAND) 61
      32. TABLE 31 GLOBAL STAINLESS-STEEL CABLE TIES MARKET, BY APPLICATION, 2020-2027 (THOUSAND UNITS) 61
      33. TABLE 32 NORTH AMERICA STAINLESS-STEEL CABLE TIES MARKET, BY COUNTRY, 2020-2027 (USD THOUSAND) 62
      34. TABLE 33 NORTH AMERICA STAINLESS-STEEL CABLE TIESMARKET, BY COUNTRY, 2020-2027 (THOUSAND UNITS) 62
      35. TABLE 34 NORTH AMERICA STAINLESS-STEEL CABLE TIES MARKET, BY TYPE, 2020-2027 (USD THOUSAND) 62
      36. TABLE 35 NORTH AMERICA STAINLESS-STEEL CABLE TIES MARKET, BY TYPE, 2020-2027 (THOUSAND UNITS) 63
      37. TABLE 36 NORTH AMERICA STAINLESS-STEEL CABLE TIES MARKET, BY APPLICATION, 2020-2027 (USD THOUSAND) 63
      38. TABLE 37 NORTH AMERICA STAINLESS-STEEL CABLE TIES MARKET, BY APPLICATION, 2020-2027 (THOUSAND UNITS) 64
      39. TABLE 38 US STAINLESS-STEEL CABLE TIES MARKET, BY TYPE, 2020-2027 (USD THOUSAND) 64
      40. TABLE 39 US STAINLESS-STEEL CABLE TIES MARKET, BY TYPE, 2020-2027 (THOUSAND UNITS) 65
      41. TABLE 40 US STAINLESS-STEEL CABLE TIES MARKET, BY APPLICATION, 2020-2027 (USD THOUSAND) 65
      42. TABLE 41 US STAINLESS-STEEL CABLE TIESMARKET, BY APPLICATION, 2020-2027 (THOUSAND UNITS) 66
      43. TABLE 42 CANADA STAINLESS-STEEL CABLE TIES MARKET, BY TYPE, 2020-2027 (USD THOUSAND) 66
      44. TABLE 43 CANADA STAINLESS-STEEL CABLE TIES MARKET, BY TYPE, 2020-2027 (THOUSAND UNITS) 67
      45. TABLE 44 CANADA STAINLESS-STEEL CABLE TIES MARKET, BY APPLICATION, 2020-2027 (USD THOUSAND) 67
      46. TABLE 45 CANADA STAINLESS-STEEL CABLE TIES MARKET, BY APPLICATION, 2020-2027 (THOUSAND UNITS) 68
      47. TABLE 46 EUROPE STAINLESS-STEEL CABLE TIES MARKET, BY COUNTRY, 2020-2027 (USD THOUSAND) 68
      48. TABLE 47 EUROPE STAINLESS-STEEL CABLE TIES MARKET, BY COUNTRY, 2020-2027 (THOUSAND UNITS) 69
      49. TABLE 48 EUROPE STAINLESS-STEEL CABLE TIES MARKET, BY TYPE, 2020-2027 (USD THOUSAND) 69
      50. TABLE 49 EUROPE STAINLESS-STEEL CABLE TIES MARKET, BY TYPE, 2020-2027 (THOUSAND UNITS) 70
      51. TABLE 50 EUROPE STAINLESS-STEEL CABLE TIES MARKET, BY APPLICATION, 2020-2027 (USD THOUSAND) 70
      52. TABLE 51 EUROPE STAINLESS-STEEL CABLE TIES MARKET, BY APPLICATION, 2020-2027 (THOUSAND UNITS) 71
      53. TABLE 52 GERMANY STAINLESS-STEEL CABLE TIES MARKET, BY TYPE, 2020-2027 (USD THOUSAND) 71
      54. TABLE 53 GERMANY STAINLESS-STEEL CABLE TIES MARKET, BY TYPE, 2020-2027 (THOUSAND UNITS) 72
      55. TABLE 54 GERMANY STAINLESS-STEEL CABLE TIES MARKET, BY APPLICATION, 2020-2027 (USD THOUSAND) 72
      56. TABLE 55 GERMANY STAINLESS-STEEL CABLE TIES MARKET, BY APPLICATION, 2020-2027 (THOUSAND UNITS) 73
      57. TABLE 56 UK STAINLESS-STEEL CABLE TIES MARKET, BY TYPE, 2020-2027 (USD THOUSAND) 73
      58. TABLE 57 UK STAINLESS-STEEL CABLE TIES MARKET, BY TYPE, 2020-2027 (THOUSAND UNITS) 74
      59. TABLE 58 UK STAINLESS-STEEL CABLE TIESMARKET, BY APPLICATION, 2020-2027 (USD THOUSAND) 74
      60. TABLE 59 UK STAINLESS-STEEL CABLE TIESMARKET, BY APPLICATION, 2020-2027 (THOUSAND UNITS) 75
      61. TABLE 60 FRANCE STAINLESS-STEEL CABLE TIES MARKET, BY TYPE, 2020-2027 (USD THOUSAND) 75
      62. TABLE 61 FRANCE STAINLESS-STEEL CABLE TIES MARKET, BY TYPE, 2020-2027 (THOUSAND UNITS) 76
      63. TABLE 62 FRANCE STAINLESS-STEEL CABLE TIES MARKET, BY APPLICATION, 2020-2027 (USD THOUSAND) 76
      64. TABLE 63 FRANCE STAINLESS-STEEL CABLE TIES MARKET, BY APPLICATION, 2020-2027 (THOUSAND UNITS) 77
      65. TABLE 64 SPAIN STAINLESS-STEEL CABLE TIES MARKET, BY TYPE, 2020-2027 (USD THOUSAND) 77
      66. TABLE 65 SPAIN STAINLESS-STEEL CABLE TIES MARKET, BY TYPE, 2020-2027 (THOUSAND UNITS) 78
      67. TABLE 66 SPAIN STAINLESS-STEEL CABLE TIES MARKET, BY APPLICATION, 2020-2027 (USD THOUSAND) 78
      68. TABLE 67 SPAIN STAINLESS-STEEL CABLE TIES MARKET, BY APPLICATION, 2020-2027 (THOUSAND UNITS) 79
      69. TABLE 68 ITALY STAINLESS-STEEL CABLE TIES MARKET, BY TYPE, 2020-2027 (USD THOUSAND) 79
      70. TABLE 69 ITALY STAINLESS-STEEL CABLE TIES MARKET, BY TYPE, 2020-2027 (THOUSAND UNITS) 80
      71. TABLE 70 ITALY STAINLESS-STEEL CABLE TIES MARKET, BY APPLICATION, 2020-2027 (USD THOUSAND) 80
      72. TABLE 71 ITALY STAINLESS-STEEL CABLE TIES MARKET, BY APPLICATION, 2020-2027 (THOUSAND UNITS) 81
      73. TABLE 72 RUSSIA STAINLESS-STEEL CABLE TIES MARKET, BY TYPE, 2020-2027 (USD THOUSAND) 81
      74. TABLE 73 RUSSIA STAINLESS-STEEL CABLE TIES MARKET, BY TYPE, 2020-2027 (THOUSAND UNITS) 82
      75. TABLE 74 RUSSIA STAINLESS-STEEL CABLE TIES MARKET, BY APPLICATION, 2020-2027 (USD THOUSAND) 82
      76. TABLE 75 RUSSIA STAINLESS-STEEL CABLE TIES MARKET, BY APPLICATION, 2020-2027 (THOUSAND UNITS) 83
      77. TABLE 76 POLAND STAINLESS-STEEL CABLE TIES MARKET, BY TYPE, 2020-2027 (USD THOUSAND) 83
      78. TABLE 77 POLAND STAINLESS-STEEL CABLE TIES MARKET, BY TYPE, 2020-2027 (THOUSAND UNITS) 84
      79. TABLE 78 POLAND STAINLESS-STEEL CABLE TIES MARKET, BY APPLICATION, 2020-2027 (USD THOUSAND) 84
      80. TABLE 79 POLAND STAINLESS-STEEL CABLE TIES MARKET, BY APPLICATION, 2020-2027 (THOUSAND UNITS) 85
      81. TABLE 80 REST OF EUROPE STAINLESS-STEEL CABLE TIES MARKET, BY TYPE, 2020-2027 (USD THOUSAND) 85
      82. TABLE 81 REST OF EUROPE STAINLESS-STEEL CABLE TIES MARKET, BY TYPE, 2020-2027 (THOUSAND UNITS) 86
      83. TABLE 82 REST OF EUROPE STAINLESS-STEEL CABLE TIES MARKET, BY APPLICATION, 2020-2027 (USD THOUSAND) 86
      84. TABLE 83 REST OF EUROPE STAINLESS-STEEL CABLE TIES MARKET, BY APPLICATION, 2020-2027 (THOUSAND UNITS) 87
      85. TABLE 84 ASIA PACIFIC STAINLESS-STEEL CABLE TIES MARKET, BY COUNTRY, 2020-2027 (USD THOUSAND) 87
      86. TABLE 85 ASIA PACIFIC STAINLESS-STEEL CABLE TIES MARKET, BY COUNTRY, 2020-2027 (THOUSAND UNITS) 88
      87. TABLE 86 ASIA PACIFIC STAINLESS-STEEL CABLE TIES MARKET, BY TYPE, 2020-2027 (USD THOUSAND) 88
      88. TABLE 87 ASIA PACIFIC STAINLESS-STEEL CABLE TIES MARKET, BY TYPE, 2020-2027 (THOUSAND UNITS) 89
      89. TABLE 88 ASIA PACIFIC STAINLESS-STEEL CABLE TIES MARKET, BY APPLICATION, 2020-2027 (USD THOUSAND) 89
      90. TABLE 89 ASIA PACIFIC STAINLESS-STEEL CABLE TIES MARKET, BY APPLICATION, 2020-2027 (THOUSAND UNITS) 90
      91. TABLE 90 CHINA STAINLESS-STEEL CABLE TIES MARKET, BY TYPE, 2020-2027 (USD THOUSAND) 90
      92. TABLE 91 CHINA STAINLESS-STEEL CABLE TIES MARKET, BY TYPE, 2020-2027 (THOUSAND UNITS) 91
      93. TABLE 92 CHINA STAINLESS-STEEL CABLE TIES MARKET, BY APPLICATION, 2020-2027 (USD THOUSAND) 91
      94. TABLE 93 CHINA STAINLESS-STEEL CABLE TIESMARKET, BY APPLICATION, 2020-2027 (THOUSAND UNITS) 92
      95. TABLE 94 JAPAN STAINLESS-STEEL CABLE TIES MARKET, BY TYPE, 2020-2027 (USD THOUSAND) 92
      96. TABLE 95 JAPAN STAINLESS-STEEL CABLE TIES MARKET, BY TYPE, 2020-2027 (THOUSAND UNITS) 93
      97. TABLE 96 JAPAN STAINLESS-STEEL CABLE TIES MARKET, BY APPLICATION, 2020-2027 (USD THOUSAND) 93
      98. TABLE 97 JAPAN STAINLESS-STEEL CABLE TIESMARKET, BY APPLICATION, 2020-2027 (THOUSAND UNITS) 94
      99. TABLE 98 INDIA STAINLESS-STEEL CABLE TIES MARKET, BY TYPE, 2020-2027 (USD THOUSAND) 94
      100. TABLE 99 INDIA STAINLESS-STEEL CABLE TIES MARKET, BY TYPE, 2020-2027 (THOUSAND UNITS) 95
      101. TABLE 100 INDIA STAINLESS-STEEL CABLE TIES MARKET, BY APPLICATION, 2020-2027 (USD THOUSAND) 95
      102. TABLE 101 INDIA STAINLESS-STEEL CABLE TIES MARKET, BY APPLICATION, 2020-2027 (THOUSAND UNITS) 96
      103. TABLE 102 SOUTH KOREA STAINLESS-STEEL CABLE TIES MARKET, BY TYPE, 2020-2027 (USD THOUSAND) 96
      104. TABLE 103 SOUTH KOREA STAINLESS-STEEL CABLE TIES MARKET, BY TYPE, 2020-2027 (THOUSAND UNITS) 97
      105. TABLE 104 SOUTH KOREA STAINLESS-STEEL CABLE TIES MARKET, BY APPLICATION, 2020-2027 (USD THOUSAND) 97
      106. TABLE 105 SOUTH KOREA STAINLESS-STEEL CABLE TIES MARKET, BY APPLICATION, 2020-2027 (THOUSAND UNITS) 98
      107. TABLE 106 INDONESIA STAINLESS-STEEL CABLE TIES MARKET, BY TYPE, 2020-2027 (USD THOUSAND) 98
      108. TABLE 107 INDONESIA STAINLESS-STEEL CABLE TIES MARKET, BY TYPE, 2020-2027 (THOUSAND UNITS) 99
      109. TABLE 108 INDONESIA STAINLESS-STEEL CABLE TIES MARKET, BY APPLICATION, 2020-2027 (USD THOUSAND) 99
      110. TABLE 109 INDONESIA STAINLESS-STEEL CABLE TIES MARKET, BY APPLICATION, 2020-2027 (THOUSAND UNITS) 100
      111. TABLE 110 TAIWAN STAINLESS-STEEL CABLE TIES MARKET, BY TYPE, 2020-2027 (USD THOUSAND) 100
      112. TABLE 111 TAIWAN STAINLESS-STEEL CABLE TIES MARKET, BY TYPE, 2020-2027 (THOUSAND UNITS) 101
      113. TABLE 112 TAIWAN STAINLESS-STEEL CABLE TIES MARKET, BY APPLICATION, 2020-2027 (USD THOUSAND) 101
      114. TABLE 113 TAIWAN STAINLESS-STEEL CABLE TIES MARKET, BY APPLICATION, 2020-2027 (THOUSAND UNITS) 102
      115. TABLE 114 AUSTRALIA & NEW ZEALAND STAINLESS-STEEL CABLE TIES MARKET, BY TYPE, 2020-2027 (USD THOUSAND) 102
      116. TABLE 115 AUSTRALIA & NEW ZEALAND STAINLESS-STEEL CABLE TIES MARKET, BY TYPE, 2020-2027 (THOUSAND UNITS) 103
      117. TABLE 116 AUSTRALIA & NEW ZEALAND STAINLESS-STEEL CABLE TIES MARKET, BY APPLICATION, 2020-2027 (USD THOUSAND) 103
      118. TABLE 117 AUSTRALIA & NEW ZEALAND STAINLESS-STEEL CABLE TIES MARKET, BY APPLICATION, 2020-2027 (THOUSAND UNITS) 104
      119. TABLE 118 REST OF ASIA PACIFIC STAINLESS-STEEL CABLE TIES MARKET, BY TYPE, 2020-2027 (USD THOUSAND) 104
      120. TABLE 119 REST OF ASIA PACIFIC STAINLESS-STEEL CABLE TIES MARKET, BY TYPE, 2020-2027 (THOUSAND UNITS) 105
      121. TABLE 120 REST OF ASIA PACIFIC STAINLESS-STEEL CABLE TIES MARKET, BY APPLICATION, 2020-2027 (USD THOUSAND) 105
      122. TABLE 121 REST OF ASIA PACIFIC STAINLESS-STEEL CABLE TIES MARKET, BY APPLICATION, 2020-2027 (THOUSAND UNITS) 106
      123. TABLE 122 LATIN AMERICA STAINLESS-STEEL CABLE TIES MARKET, BY COUNTRY, 2020-2027 (USD THOUSAND) 106
      124. TABLE 123 LATIN AMERICA STAINLESS-STEEL CABLE TIES MARKET, BY COUNTRY, 2020-2027 (THOUSAND UNITS) 107
      125. TABLE 124 LATIN AMERICA STAINLESS-STEEL CABLE TIES MARKET, BY TYPE, 2020-2027 (USD THOUSAND) 107
      126. TABLE 125 LATIN AMERICA STAINLESS-STEEL CABLE TIES MARKET, BY TYPE, 2020-2027 (THOUSAND UNITS) 107
      127. TABLE 126 LATIN AMERICA STAINLESS-STEEL CABLE TIES MARKET, BY APPLICATION, 2020-2027 (USD THOUSAND) 108
      128. TABLE 127 LATIN AMERICA STAINLESS-STEEL CABLE TIES MARKET, BY APPLICATION, 2020-2027 (THOUSAND UNITS) 108
      129. TABLE 128 MEXICO STAINLESS-STEEL CABLE TIES MARKET, BY TYPE, 2020-2027 (USD THOUSAND) 109
      130. TABLE 129 MEXICO STAINLESS-STEEL CABLE TIES MARKET, BY TYPE, 2020-2027 (THOUSAND UNITS) 109
      131. TABLE 130 MEXICO STAINLESS-STEEL CABLE TIES MARKET, BY APPLICATION, 2020-2027 (USD THOUSAND) 110
      132. TABLE 131 MEXICO STAINLESS-STEEL CABLE TIES MARKET, BY APPLICATION, 2020-2027 (THOUSAND UNITS) 110
      133. TABLE 132 ARGENTINA STAINLESS-STEEL CABLE TIES MARKET, BY TYPE, 2020-2027 (USD THOUSAND) 111
      134. TABLE 133 ARGENTINA STAINLESS-STEEL CABLE TIES MARKET, BY TYPE, 2020-2027 (THOUSAND UNITS) 111
      135. TABLE 134 ARGENTINA STAINLESS-STEEL CABLE TIES MARKET, BY APPLICATION, 2020-2027 (USD THOUSAND) 112
      136. TABLE 135 ARGENTINA STAINLESS-STEEL CABLE TIES MARKET, BY APPLICATION, 2020-2027 (THOUSAND UNITS) 112
      137. TABLE 136 BRAZIL STAINLESS-STEEL CABLE TIES MARKET, BY TYPE, 2020-2027 (USD THOUSAND) 113
      138. TABLE 137 BRAZIL STAINLESS-STEEL CABLE TIES MARKET, BY TYPE, 2020-2027 (THOUSAND UNITS) 113
      139. TABLE 138 BRAZIL STAINLESS-STEEL CABLE TIES MARKET, BY APPLICATION, 2020-2027 (USD THOUSAND) 114
      140. TABLE 139 BRAZIL STAINLESS-STEEL CABLE TIES MARKET, BY APPLICATION, 2020-2027 (THOUSAND UNITS) 114
      141. TABLE 140 REST OF LATIN AMERICA STAINLESS-STEEL CABLE TIES MARKET, BY TYPE, 2020-2027 (USD THOUSAND) 115
      142. TABLE 141 REST OF LATIN AMERICA STAINLESS-STEEL CABLE TIES MARKET, BY TYPE, 2020-2027 (THOUSAND UNITS) 115
      143. TABLE 142 REST OF LATIN AMERICA STAINLESS-STEEL CABLE TIES MARKET, BY APPLICATION, 2020-2027 (USD THOUSAND) 116
      144. TABLE 143 REST OF LATIN AMERICA STAINLESS-STEEL CABLE TIES MARKET, BY APPLICATION, 2020-2027 (THOUSAND UNITS) 116
      145. TABLE 144 MIDDLE EAST AND AFRICA STAINLESS-STEEL CABLE TIES MARKET, BY COUNTRY, 2020-2027 (USD THOUSAND) 117
      146. TABLE 145 MIDDLE EAST AND AFRICA STAINLESS-STEEL CABLE TIES MARKET, BY COUNTRY, 2020-2027 (THOUSAND UNITS) 117
      147. TABLE 146 MIDDLE EAST AND AFRICA STAINLESS-STEEL CABLE TIES MARKET, BY TYPE, 2020-2027 (USD THOUSAND) 117
      148. TABLE 147 MIDDLE EAST AND AFRICA STAINLESS-STEEL CABLE TIES MARKET, BY TYPE, 2020-2027 (THOUSAND UNITS) 118
      149. TABLE 148 MIDDLE EAST AND AFRICA STAINLESS-STEEL CABLE TIES MARKET, BY APPLICATION, 2020-2027 (USD THOUSAND) 118
      150. TABLE 149 MIDDLE EAST AND AFRICA STAINLESS-STEEL CABLE TIESMARKET, BY APPLICATION, 2020-2027 (THOUSAND UNITS) 119
      151. TABLE 150 TURKEY STAINLESS-STEEL CABLE TIES MARKET, BY TYPE, 2020-2027 (USD THOUSAND) 119
      152. TABLE 151 TURKEY STAINLESS-STEEL CABLE TIES MARKET, BY TYPE, 2020-2027 (THOUSAND UNITS) 120
      153. TABLE 152 TURKEY STAINLESS-STEEL CABLE TIES MARKET, BY APPLICATION, 2020-2027 (USD THOUSAND) 120
      154. TABLE 153 TURKEY STAINLESS-STEEL CABLE TIES MARKET, BY APPLICATION, 2020-2027 (THOUSAND UNITS) 121
      155. TABLE 154 SAUDI ARABIA STAINLESS-STEEL CABLE TIES MARKET, BY TYPE, 2020-2027 (USD THOUSAND) 121
      156. TABLE 155 SAUDI ARABIA STAINLESS-STEEL CABLE TIES MARKET, BY TYPE, 2020-2027 (THOUSAND UNITS) 122
      157. TABLE 156 SAUDI ARABIA STAINLESS-STEEL CABLE TIESMARKET, BY APPLICATION, 2020-2027 (USD THOUSAND) 122
      158. TABLE 157 SAUDI ARABIA STAINLESS-STEEL CABLE TIESMARKET, BY APPLICATION, 2020-2027 (THOUSAND UNITS) 123
      159. TABLE 158 UAE STAINLESS-STEEL CABLE TIES MARKET, BY TYPE, 2020-2027 (USD THOUSAND) 123
      160. TABLE 159 UAE STAINLESS-STEEL CABLE TIES MARKET, BY TYPE, 2020-2027 (THOUSAND UNITS) 124
      161. TABLE 160 UAE STAINLESS-STEEL CABLE TIES MARKET, BY APPLICATION, 2020-2027 (USD THOUSAND) 124
      162. TABLE 161 UAE STAINLESS-STEEL CABLE TIES MARKET, BY APPLICATION, 2020-2027 (THOUSAND UNITS) 125
      163. TABLE 162 REST OF MIDDLE EAST AND AFRICA STAINLESS-STEEL CABLE TIES MARKET, BY TYPE, 2020-2027 (USD THOUSAND) 125
      164. TABLE 163 REST OF MIDDLE EAST AND AFRICA STAINLESS-STEEL CABLE TIES MARKET, BY TYPE, 2020-2027 (THOUSAND UNITS) 126
      165. TABLE 164 REST OF MIDDLE EAST AND AFRICA STAINLESS-STEEL CABLE TIES MARKET, BY APPLICATION, 2020-2027 (USD THOUSAND) 126
      166. TABLE 165 REST OF MIDDLE EAST AND AFRICA STAINLESS-STEEL CABLE TIES MARKET, BY APPLICATION, 2020-2027 (THOUSAND UNITS) 127
      167. TABLE 166 KEY DEVELOPMENTS 129 14 List Of Figures
      168. FIGURE 1 GLOBAL STAINLESS-STEEL CABLE TIES MARKET: MARKET STRUCTURE 19
      169. FIGURE 2 GLOBAL STAINLESS-STEEL CABLE TIES MARKET SHARE, BY REGION (2020 VS 2027) 21
      170. FIGURE 3 NORTH AMERICA MARKET SIZE & MARKET SHARE, BY COUNTRY (2020 VS 2027) 22
      171. FIGURE 4 EUROPE MARKET SIZE & MARKET SHARE, BY COUNTRY (2020 VS 2027) 22
      172. FIGURE 5 ASIA-PACIFIC MARKET SIZE & MARKET SHARE, BY COUNTRY (2020 VS 2027) 23
      173. FIGURE 6 LATIN AMERICA MARKET SIZE & MARKET SHARE, BY COUNTRY (2020 VS 2027) 23
      174. FIGURE 7 MIDDLE EAST & AFRICA MARKET SIZE & MARKET SHARE, BY COUNTRY (2020 VS 2027) 24
      175. FIGURE 8 RESEARCH PROCESS OF MRFR 26
      176. FIGURE 9 TOP-DOWN & Bottom-up ApproachES 29
      177. FIGURE 10 MARKET DYNAMICS OVERVIEW 31
      178. FIGURE 11 GLOBAL AUTOMOBILE PRODUCTION, BY REGION, 2020 33
      179. FIGURE 12 DRIVERS IMPACT ANALYSIS 33
      180. FIGURE 13 RESTRAINT IMPACT ANALYSIS 34
      181. FIGURE 14 SUPPLY CHAIN ANALYSIS OF THE GLOBAL STAINLESS-STEEL CABLE TIES MARKET 37
      182. FIGURE 15 PORTER’S FIVE FORCES ANALYSIS OF THE GLOBAL STAINLESS-STEEL CABLE TIES MARKET 38
      183. FIGURE 16 GLOBAL STAINLESS-STEEL CABLE TIES MARKET, BY TYPE, 2020-2027 (USD THOUSAND) 41
      184. FIGURE 17 GLOBAL STAINLESS-STEEL CABLE TIES MARKET, BY TYPE, 2020-2027 (THOUSAND UNITS) 42
      185. FIGURE 18 GLOBAL STAINLESS-STEEL CABLE TIES MARKET, BY APPLICATION, 2020-2027 (USD THOUSAND) 47
      186. FIGURE 19 GLOBAL STAINLESS-STEEL CABLE TIES MARKET, BY APPLICATION, 2020-2027 (THOUSAND UNITS) 48
      187. FIGURE 20 GLOBAL STAINLESS-STEEL CABLE TIES MARKET BY REGION, 2020-2027 (USD THOUSAND) 58
      188. FIGURE 21 GLOBAL STAINLESS-STEEL CABLE TIES MARKET BY REGION, 2020-2027 (THOUSAND UNITS) 59
      189. FIGURE 22 GLOBAL STAINLESS-STEEL CABLE TIES MARKET, BY REGION: IMPACT ANALYSIS OF MARKET TRENDS 152
      190. FIGURE 23 GLOBAL STAINLESS-STEEL CABLE TIES MARKET, BY REGION, 2020 (% SHARE) 153

    Stainless-Steel Cable Ties Market Segmentation

    Market Segmentation Overview

    • Detailed segmentation data will be available in the full report
    • Comprehensive analysis by multiple parameters
    • Regional and country-level breakdowns
    • Market size forecasts by segment
    Infographic

    Free Sample Request

    Kindly complete the form below to receive a free sample of this Report

    Get Free Sample

    Customer Strories

    “I am very pleased with how market segments have been defined in a relevant way for my purposes (such as "Portable Freezers & refrigerators" and "last-mile"). In general the report is well structured. Thanks very much for your efforts.”

    Victoria Milne

    Founder
    Case Study
    Chemicals and Materials