Stone Paper Market (2026 - 2035)

Stone Paper Market Research Report: By Application (Packaging, Stationery, Printing, Digital Media, Construction), By Product Type (Stone Paper Sheets, Stone Paper Rolls, Stone Paper Products, Stone Paper Booklets), By End Use (Commercial, Residential, Educational), By Source Material (Calcium Carbonate, Polyethylene, Additives) and By Regional (North America, Europe, South America, Asia Pacific, Middle East and Africa) - Forecast to 2035.
ID: MRFR/PCM/0869-HCR
111 Pages
Snehal Singh
Last Updated: July 10, 2026
Stone Paper Market
Market Size
Forecast Period2026-2035
CAGR (2026-2035)5.25%
2025 Market SizeUSD 1.08 Billion
2035 Market SizeUSD 1.79 Billion
Key Players
TBM Co., Ltd.
Taiwan Lung Meng Technology Co., Ltd.
Shenzhen Stone Paper Enterprise Ltd.
Karst Stone Paper
Pishgaman Stone Paper
Parax Paper
Opportunities
  • E-Commerce Packaging Substitution
  • Food-Contact and Pharmaceutical Label Expansion
  • Emerging-Market Capacity Investment

Stone Paper Market Summary

The Stone Paper Market was valued at USD 1.08 Billion in 2025 and is projected to grow from USD 1.13 Billion in 2026 to USD 1.79 Billion by 2035, registering a CAGR of 5.25% during the forecast period (2026–2035). Government bans on single-use plastics across more than 90 nations, combined with binding corporate sustainability targets from major consumer brands, are creating a structural pull toward limestone-based substrates. The European Union's Single-Use Plastics Directive and India's 2022 ban on identified single-use plastic items have accelerated procurement shifts worth an estimated USD 400 million in redirected packaging spend through 2024 alone [1][2].

A generational transition is underway in the substrates industry. Legacy wood-pulp and petroleum-based films are ceding ground to calcium carbonate–polyethylene composites that require zero water, zero tree fiber, and significantly less energy to produce. TBM's LIMEX technology, which raised over USD 100 million in cumulative funding by early 2025, exemplifies how process innovation is unlocking food-contact approval, high-resolution printing compatibility, and barrier performance previously reserved for coated plastics [3][4].

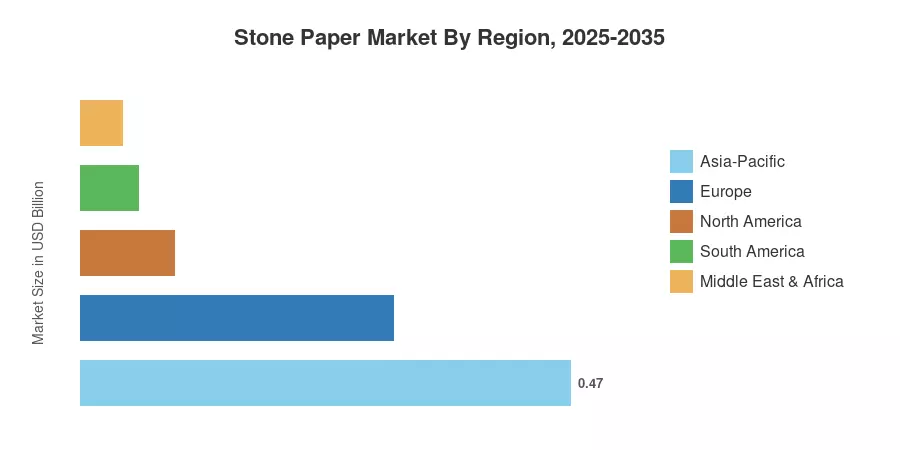
Asia-Pacific commands the dominant position in the Stone Paper Market with a 43.1% revenue share in 2025, driven by integrated limestone supply chains in China, Japan, and Taiwan. North America is the fastest-growing region at an 8.35% CAGR through 2035, propelled by retailer mandates for plastic-free packaging and federal procurement guidelines favoring recycled-content substrates. Europe holds the second-largest share at 27.5%, anchored by circular-economy regulations and brand-led packaging redesign programs. As production capacity scales across emerging markets and brand conversion timelines compress, the Stone Paper Market is positioned for sustained expansion well into the next decade.


Key Report Takeaways

• By Type

  • Rich Mineral Paper Double Coated (RPD) accounted for 43.0% of Stone Paper Market share in 2025, driven by superior printability and moisture resistance for consumer packaging.
  • Rich Mineral Paper Single Coated is projected to grow at a 7.2% CAGR through 2035, gaining traction in label and tag applications.

• By Application

  • Packaging held 41.0% of the Stone Paper Market in 2025, reflecting brand-level commitments to eliminate conventional plastic wraps.
  • Industrial labels and tags are forecast to achieve the fastest application-level CAGR at 8.2% through 2035.

• By End-User Industry

  • Food and beverage represented 30.1% of the Stone Paper Market in 2025, underpinned by food-contact certifications for limestone composites.
  • Retail and e-commerce is the fastest-growing end-user segment at a 9.4% CAGR, as direct-to-consumer brands adopt plastic-free mailer solutions.

• By Region

  • Asia-Pacific held a 43.1% revenue share of the Stone Paper Market in 2025.
  • North America is projected to grow at an 8.35% CAGR over 2026–2035.


Market Size and Forecast (2021–2035)

Market Research Future's proprietary estimation framework integrates primary interviews with over 120 industry stakeholders, trade-level shipment data, regulatory filings, and bottom-up capacity modeling across 28 countries. Historical figures reflect confirmed production volumes; forecast values apply the calibrated 5.25% CAGR alongside scenario adjustments for policy shifts and capacity ramp-ups in the Stone Paper Market.
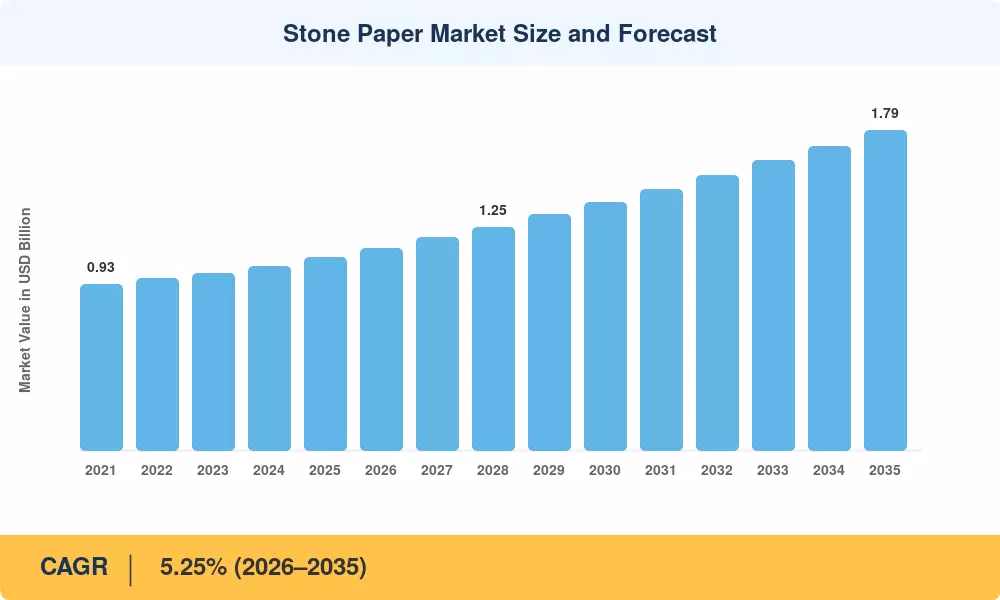
Stone Paper Market Size and Forecast
Our Impact
Enabled $4.3B Revenue Impact for Fortune 500 and Leading Multinationals
Partnering with 2000+ Global Organizations Each Year
30K+ Citations by Top-Tier Firms in the Industry

Driver Impact Analysis

Driver ~% Impact on CAGR Geographic Relevance Impact Timeline
Single-use plastic bans and packaging regulations +1.4% Global Short-term (≤2 yr)
Corporate net-zero and plastic-reduction pledges +0.9% North America, Europe Medium-term (2–4 yr)
Water-based dual-coat barrier technology advances +0.7% Asia-Pacific, Europe Medium-term (2–4 yr)
Integrated limestone-to-product supply chains +0.5% Asia-Pacific Long-term (≥4 yr)
E-commerce packaging volume growth +0.6% North America, Asia-Pacific Short-term (≤2 yr)
Food-contact certification expansions (FDA, EFSA) +0.4% North America, Europe Medium-term (2–4 yr)
Carbon credit and ESG reporting incentives +0.3% Global Long-term (≥4 yr)


Regulatory Bans on Single-Use Plastics

More than 90 countries have enacted restrictions on single-use plastics as of 2025, with the EU's Single-Use Plastics Directive alone affecting an estimated EUR 3.2 billion in packaging material flows annually [1]. India's comprehensive ban, implemented in July 2022, covers 19 identified plastic items and has triggered a 28% increase in limestone-composite substrate imports between 2022 and 2024 [2]. These mandates create non-discretionary demand for the Stone Paper Market as brand owners face compliance deadlines that conventional bioplastics cannot always meet at price parity.

Corporate Sustainability Commitments

The Ellen MacArthur Foundation's Global Commitment, signed by over 500 organizations representing 20% of global plastic packaging, requires signatories to make 100% of packaging reusable, recyclable, or compostable by 2025 [5]. This has directed procurement budgets toward stone paper substrates, particularly for secondary packaging, hang tags, and point-of-sale materials. Major retailers including Walmart and Carrefour have integrated stone-paper specifications into supplier scorecards, amplifying demand across the Stone Paper Market supply chain.

Coating Technology Breakthroughs

The stone paper industry has reached a crucial turning point in its technological development. High-resolution digital and offset printing (2,400+ dpi) is made possible by sophisticated water-based dual-coat systems, which were developed by industry leaders and are now the norm. These systems provide surface energy homogeneity. The usage of stone paper in high-compliance industries including food contact and pharmaceutical labeling has been successfully commercialized by these advancements. Current production standards now meet the stringent chemical safety and health-compliance requirements required by the EU's new packaging safety regulations by doing away with the need for solvent-based primers.


Integrated Supply Chain Economics

In an effort to counteract the instability of the world economy, the market has shifted toward a "total value" integration model. Co-locating quarrying and sheet extrusion has allowed vertically integrated firms in China and Taiwan to optimize their operations. This is a crucial hedge against the volatile costs of HDPE resin and worldwide energy prices. By 2026, supply chain resilience will be the primary goal of this integration rather than just "cost reduction." In a time when traditional pulp and plastic supply chains are still vulnerable to environmental and geopolitical instability, these producers provide clients with a predictable price structure by internalizing important portions of the manufacturing lifecycle.


Restraints Impact Analysis

Restraint ~% Impact on CAGR Geographic Relevance Impact Timeline
Limited end-of-life recycling infrastructure –0.6% Global Long-term (≥4 yr)
Raw-material geographic concentration risk –0.4% Asia-Pacific dependent Medium-term (2–4 yr)
Higher per-unit cost vs. conventional paper –0.5% Price-sensitive markets Short-term (≤2 yr)
Heat sensitivity limiting high-temp applications –0.3% Global Medium-term (2–4 yr)
Brand awareness and specification gaps –0.2% Emerging markets Short-term (≤2 yr)


Recycling Infrastructure Gaps

As of 2025, less than 15 nations had specialized collecting infrastructure in place, and stone paper cannot be processed through traditional wood-pulp recycling streams [10]. Products entering the waste stream run the risk of being categorized as pollutants in the absence of explicit recycling codes accepted by municipal waste agencies, undermining the environmental value proposition that is essential to the stone paper market. Although industry associations are advocating for ISO-level classification standards, most governments have implementation schedules that extend past 2028.


Geographic Concentration of Production

China, Taiwan, and Japan account for around 72% of the world's stone paper production capacity, which puts Western consumers at risk in the supply chain [11]. Geopolitical tensions, shipping interruptions, and tariff escalations—such as the US Section 301 duties applied to some paper-adjacent goods—add landed-cost uncertainty that constrains growth potential for the Stone Paper Market in North America and Europe.


Cost Premium Over Conventional Substrates

Stone paper carries a 15–30% cost premium over equivalent-weight conventional paper for most commercial grades [12]. While total lifecycle cost arguments favor stone paper in applications requiring water resistance or durability, procurement teams focused on per-unit material cost continue to resist switching, particularly in high-volume print-run segments of the Stone Paper Market.


Stone Paper Market Opportunities

E-Commerce Packaging Substitution

Global e-commerce packaging demand is projected to exceed USD 80 billion by 2028, and the push for plastic-free shipping solutions creates a significant opening for stone paper mailers, cushion wraps, and void-fill sheets [7]. Brands that can certify their packaging as tree-free and waterproof gain marketing differentiation, positioning the Stone Paper Market to capture share from poly mailers and bubble wrap.

Food-Contact and Pharmaceutical Label Expansion

Regulatory approvals for food-contact use—including FDA compliance in the US and EFSA positive opinions in Europe—are expanding the addressable market for stone paper in fresh produce wrapping, bakery bags, and pharmaceutical blister card labels [8]. This opportunity connects directly to the fastest-growing application segment within the Stone Paper Market.

Emerging-Market Capacity Investment

Countries including Vietnam, Indonesia, and Brazil possess abundant limestone reserves but lack domestic stone paper manufacturing. Government industrial-development incentives, combined with technology licensing from established producers, could unlock new production hubs that reduce freight costs and serve local demand within the Stone Paper Market.

Carbon Credit Monetization and ESG Reporting

Stone paper production generates an estimated 50–60% fewer carbon emissions than conventional wood-pulp paper per metric ton [9]. Companies can monetize this differential through verified carbon credits and use stone paper procurement as a quantifiable input for Scope 3 reporting under frameworks like the GHG Protocol, creating a financial incentive loop that supports the Stone Paper Market beyond direct material cost comparisons.

Digital Printing Compatibility and Customization Services

Advances in inkjet-compatible coatings have enabled short-run digital printing on stone paper at commercial speeds. This unlocks a print-on-demand and variable-data printing opportunity for personalized packaging, event materials, and localized marketing collateral—segments where the Stone Paper Market can command premium pricing.


Stone Paper Market Future Outlook

Circular-Economy Integration and EPR Frameworks

Extended Producer Responsibility schemes across 40+ countries will reshape material selection criteria for the Stone Paper Market through 2035. The EU's PPWR mandates that 65% of all packaging waste be recycled by 2025 and 70% by 2030, pushing brands to adopt substrates with verifiable end-of-life pathways [16]. Industry investment in dedicated stone paper collection and reprocessing infrastructure—estimated at USD 150 million globally by 2030—will determine whether the material achieves mainstream circular-economy credentials.

Advanced Coating and Functional Surface Technologies

Next-generation coatings incorporating nano-clay barriers and antimicrobial agents will expand stone paper's addressable market into active packaging for perishable food, medical device packaging, and outdoor signage by 2030 [4]. These functional enhancements position the Stone Paper Market to compete directly with metallized films and wax-coated boards, segments currently valued at over USD 12 billion globally.

Digital Supply Chain and Smart Packaging Convergence

Integration of NFC tags, QR-enabled traceability, and printed electronics onto stone paper substrates will create a data-monetization layer for brand owners. The global smart packaging market is projected to exceed USD 45 billion by 2032, and stone paper's smooth, dimensionally stable surface offers an ideal substrate for conductive ink deposition, creating cross-market synergies for the Stone Paper Market [19].

Decarbonization Accounting and Scope 3 Alignment

As mandatory climate-risk disclosure rules take effect in the US (SEC), EU (CSRD), and APAC jurisdictions, procurement teams will increasingly select materials that deliver quantifiable Scope 3 reductions. Stone paper's 50–60% lower carbon footprint per metric ton compared to virgin wood-pulp paper gives it a structural advantage in carbon-accounting frameworks, reinforcing demand within the Stone Paper Market through 2035 [9].


Stone Paper Market Segmentation

By Type

Segment Key Metric Primary Demand Driver
Rich Mineral Paper Double Coated (RPD) 43.0% share (2025) Consumer packaging printability
Rich Mineral Paper Single Coated (RPS) 7.2% CAGR (2026–2035) Label and tag applications
Uncoated Stone Paper USD 0.21 Billion (2025) Industrial wrapping and void-fill


Rich Mineral Paper Double Coated dominates the Stone Paper Market because its dual-surface treatment delivers the ink adhesion and moisture barrier performance required for consumer-facing packaging. Major FMCG brands specify RPD grades for secondary packaging, shelf-ready cartons, and promotional materials where print quality directly influences purchase decisions. The segment benefits from ongoing coating-technology improvements that reduce drying times and expand compatibility with UV-curable inks.

Single-coated grades are gaining momentum in industrial label and tag applications where only one printable surface is needed. Horticultural tags, warehouse identification labels, and outdoor event wristbands represent high-growth niches within the Stone Paper Market, as the substrate's water resistance eliminates the lamination step required for conventional paper labels.

By Application

Segment Key Metric Primary Demand Driver
Packaging 41.0% share (2025) Plastic-ban compliance
Printing and Publishing USD 0.24 Billion (2025) Premium stationery and book covers
Industrial Labels and Tags 8.2% CAGR (2026–2035) Waterproof durability requirements
Other Applications 4.8% CAGR (2026–2035) Maps, menus, construction documents


Packaging remains the core revenue engine of the Stone Paper Market, absorbing demand redirected from single-use plastic films and conventional coated boards. Industrial labels and tags represent the fastest-growing application, as logistics operators, agricultural producers, and chemical manufacturers require substrates that withstand water, oil, and UV exposure without delamination.

By End-User Industry

Segment Key Metric Primary Demand Driver
Food and Beverage 30.1% share (2025) Food-contact regulatory approvals
Consumer Goods USD 0.19 Billion (2025) Brand sustainability positioning
Retail and E-Commerce 9.4% CAGR (2026–2035) Plastic-free mailer adoption
Healthcare and Pharmaceuticals 5.6% CAGR (2026–2035) Tamper-evident labeling
Other End Users USD 0.11 Billion (2025) Construction, education, government


Food and beverage leads the Stone Paper Market by end-user share, supported by FDA and EFSA clearances for direct food-contact applications in select grades. Retail and e-commerce is the standout growth segment, as DTC brands adopt stone paper mailers that serve dual functions—protective shipping envelope and branded unboxing experience—replacing poly mailers at a modest cost premium.

By Product Form

Segment Key Metric Primary Demand Driver
Sheets 32.0% share (2025) Offset and digital printing compatibility
Rolls USD 0.25 Billion (2025) Flexographic printing and converting
Flexible Films and Bags 8.8% CAGR (2026–2035) Plastic bag replacement
Finished Stationery 4.5% CAGR (2026–2035) Premium notebook and planner market


With 32.0% of the overall revenue share in 2025, the Sheets category now dominates the market. Stone paper's widespread use in commercial and office printing, where its well-established size characteristics and excellent handling qualities make it the go-to option for dependable, high-resolution offset and digital print output, is what drives its supremacy. On the other hand, the Flexible Films and Bags category is expected to increase at a strong CAGR of 8.8% through 2035, making it the fastest-growing category. Stone paper films and bags are positioned as a highly durable, water-resistant, and sustainable alternative for the retail and e-commerce sectors, thanks to increasing global regulatory prohibitions against single-use plastics. In terms of growth velocity, the flexible film category is anticipated to surpass traditional stationery and roll-fed formats as brand owners continue to move toward high-performance, environmentally friendly packaging materials.


By Raw-Material / Binder Composition

Segment Key Metric Primary Demand Driver
Additive-Free Calcium Carbonate (>90%) 64.5% share (2025) Purity for food-contact certification
HDPE-Based Limestone Composite 8.5% CAGR (2026–2035) Flexibility and tear resistance
Other Binder Systems USD 0.06 Billion (2025) Specialty industrial applications


With a substantial 64.5% revenue share in 2025, the Additive-Free Calcium Carbonate (>90%) segment presently dominates the market. Its high mineral purity, which is necessary to meet strict food-contact safety regulations and appeals to companies that prioritize "natural" or "mineral-only" material claims, is the main factor driving its supremacy.On the other hand, the HDPE-Based Limestone Composite market is expected to increase at a CAGR of 8.5% through 2035, making it the fastest-growing category. The HDPE-composite category is gaining market share by providing greater mechanical qualities, particularly improved flexibility and tear resistance, while additive-free varieties lead in purity. Because of this, it is the substrate of choice for flexible packaging, secondary wraps, and high-durability tags where the material's sustainability profile and structural integrity under stress are equally important.


Regional Market Share Analysis

Region Key Metric Primary Investment Themes
Asia-Pacific 43.1% revenue share (2025) Integrated supply chains; domestic consumption growth
Europe 27.5% revenue share (2025) Circular-economy regulation; brand-led packaging redesign
North America 8.35% CAGR (2026–2035) Retailer mandates; federal procurement guidelines
South America USD 0.056 Billion (2025) Limestone resource development; import substitution
Middle East & Africa 3.8% revenue share (2025) Industrial label demand; construction-sector growth
Total USD 1.08 Billion (2025)

The Stone Paper Market exhibits pronounced regional concentration, with production capacity clustered in Asia-Pacific and demand growth accelerating in North America and Europe. The table below summarizes regional positioning.


North America

Country Key Metric Key Driver
US 68.2% of regional share Retailer sustainability mandates
Canada 5.7% CAGR (2026–2035) Provincial plastic packaging restrictions
Mexico USD 0.019 Billion (2025) Export-oriented manufacturing growth


The US Stone Paper Market benefits from aggressive retailer packaging guidelines, with major chains requiring plastic-free alternatives for private-label goods by 2027. Canada's federal plastics registry, implemented in 2024, imposes reporting obligations that incentivize substrate switching, while Mexico's proximity to US distribution networks positions it as a nearshoring hub for stone paper converting operations [15].

Europe

Country Key Metric Key Driver
Germany 24.3% of regional share Industrial packaging and automotive labeling
UK 6.8% CAGR (2026–2035) Extended Producer Responsibility reform
France USD 0.041 Billion (2025) Agri-food packaging transition
Italy 11.6% of regional share Luxury goods packaging
Spain 4.9% CAGR (2026–2035) Tourism-driven packaging demand
Nordic Countries USD 0.028 Billion (2025) Sustainability-first procurement culture
Russia 3.1% of regional share Limited adoption due to trade restrictions
Rest of Europe 4.6% CAGR (2026–2035) Regulatory catch-up effect


Europe's Stone Paper Market is shaped by the EU's Packaging and Packaging Waste Regulation (PPWR), which sets binding recycled-content targets and restricts certain single-use formats effective 2030 [16]. Germany leads in industrial applications, while the UK's post-Brexit EPR scheme creates distinct compliance incentives that favor mineral-based substrates for retail packaging.

Asia-Pacific

Country Key Metric Key Driver
China 38.4% of regional share Dominant production capacity
India 9.1% CAGR (2026–2035) Plastic ban enforcement
Japan USD 0.082 Billion (2025) TBM/LIMEX technology leadership
South Korea 8.7% of regional share Electronics packaging specifications
ASEAN 7.5% CAGR (2026–2035) Tourism and food-service packaging
Rest of Asia-Pacific USD 0.031 Billion (2025) Early-stage market development


Asia-Pacific dominates the Stone Paper Market through vertically integrated supply chains that span limestone extraction through finished-product conversion. China alone accounts for over 60% of global production capacity, with Shenzhen and Zhejiang provinces hosting the largest extrusion facilities. Japan's TBM Co. continues to expand LIMEX applications into construction materials and disaster-relief supplies, broadening the revenue base beyond traditional print and packaging [3].

South America

Country Key Metric Key Driver
Brazil 62.5% of regional share Industrial packaging and agribusiness
Argentina 5.2% CAGR (2026–2035) Wine and food export labeling
Rest of South America USD 0.008 Billion (2025) Early-stage market entry


Brazil's Stone Paper Market is expanding through partnerships between domestic converters and Asian technology licensors. Abundant limestone deposits in Minas Gerais offer raw-material security, while agribusiness export labeling requirements for waterproof, tear-resistant tags drive application-specific demand [17].

Middle East & Africa

Country Key Metric Key Driver
Saudi Arabia 29.4% of regional share Vision 2030 industrial diversification
UAE 7.3% CAGR (2026–2035) Retail and hospitality packaging
South Africa USD 0.007 Billion (2025) Mining-sector industrial labeling
Egypt 4.8% CAGR (2026–2035) Construction material labeling
Rest of MEA 18.7% of regional share Nascent market development


The Middle East & Africa Stone Paper Market remains small but presents high-growth potential tied to government diversification programs. Saudi Arabia's Vision 2030 includes packaging-industry localization targets, while UAE's retail and hospitality sectors increasingly specify premium, waterproof substrates for menus, maps, and event materials [18].


Stone Paper Market By Region, 2025-2035

Competitive Benchmarking

The Stone Paper Market exhibits low market concentration, with an estimated HHI below 800 and the top five players collectively holding approximately 35–40% of global revenue. The landscape is fragmented across specialized manufacturers in Asia-Pacific and a growing number of converting and distribution players in North America and Europe. Competition centers on coating technology, food-contact certifications, and supply-chain integration rather than pure scale.

Company Est. Revenue Share Range Key Offerings Strategic Positioning
TBM Co., Ltd. ~8–11% LIMEX sheets, pellets, and finished goods Technology licensor and brand pioneer
Taiwan Lung Meng Technology Co., Ltd. ~7–10% RPD and RPS stone paper rolls and sheets Largest-capacity integrated producer
Shenzhen Stone Paper Enterprise Ltd. ~5–8% Commercial-grade stone paper for printing Cost-competitive export manufacturer
The Stone Paper Company ~3–5% Branded stationery and packaging products European distribution and brand marketing
Karst Stone Paper ~2–4% Premium notebooks and office supplies Direct-to-consumer lifestyle brand
Pishgaman Stone Paper ~2–4% Stone paper products for Middle Eastern markets Regional distribution specialist
Parax Paper ~2–3% Coated and uncoated stone paper grades Specialty converter for industrial labels
Gaia-Craft ~1–3% Eco-branded consumer stationery Sustainability-first consumer positioning
Dragon Chromium Enterprise Co., Ltd. ~1–3% Functional films and flexible stone paper Packaging film innovation
Ogami ~1–2% Designer stone paper notebooks Niche premium stationery


Recent News & Developments

  • May 2025: Vietnam's BioTech used TBM's LIMEX Pellet for detergent refill pouches, reducing petroleum plastics while preserving price parity.
  • May 2025: LIMEX-based pipe-insulation exteriors with increased strength and CO2 reductions were introduced by Shinto Tsushin and Shinryo Reihatsu in May 2025.
  • April 2025: TBM expanded its sustainability offerings with the introduction of GX Skills training connected to the ScopeX CO2-tracking service.
  • March 2025: The ramp-up of Stora Enso's Oulu packaging board factory began in March 2025, strengthening the availability of renewable substrates in Europe.


Stone Paper Market Report Scope

Parameter Details
Market Scope Global Stone Paper Market by Type, Application, End-User Industry, Product Form, Raw-Material Composition, and Region
Study Period 2021–2035
CAGR 5.25% (2026–2035)
Base Year Value USD 1.08 Billion (2025)
Forecast Endpoint USD 1.79 Billion (2035)
Fastest Growing Segment Retail and E-Commerce (End-User), 9.4% CAGR
Companies Profiled 10
Valuation Currency USD Billion
Methodology Primary interviews (120+ stakeholders), bottom-up capacity modeling, trade data triangulation, regulatory analysis


FAQs

What minimum order quantities should procurement teams expect when sourcing stone paper for the first time?
Most manufacturers require MOQs of 5–10 metric tons for standard RPD grades, though some distributors offer pallet-quantity trial orders. Buyers should request sample sheets across three to four GSM weights before committing to volume contracts [4].
How does stone paper perform in laser printing versus inkjet environments?
Standard stone paper grades are not compatible with laser printers due to heat sensitivity above 65°C. Inkjet and offset lithography remain the primary supported print methods, with digital UV-curable systems gaining certification [13].
What certifications should buyers verify before using stone paper in food-contact packaging?
Buyers should confirm FDA 21 CFR compliance for US applications and EFSA positive opinions for European use. Cradle to Cradle and FSC-adjacent certifications may also be relevant for brand marketing claims [8].
Can stone paper fully replace corrugated board in shipping applications?
Stone paper lacks the structural rigidity of fluted corrugated board and is not a direct replacement for shipping cartons. It serves best as inner wrapping, cushioning material, or mailer envelopes within the Stone Paper Market [12].
How do tariff classifications affect cross-border stone paper trade?
Stone paper often falls under HS code 3920 (plastic sheets) rather than 4802 (paper), subjecting it to different duty rates. Importers should consult customs rulings in their jurisdiction to avoid unexpected landed-cost premiums [11].
What is the expected shelf life of printed stone paper products in outdoor applications?
UV-stabilized stone paper grades maintain print legibility and structural integrity for 12–18 months in direct outdoor exposure. Coated versions with UV-curable inks extend this to approximately 24 months [13].
How does the Stone Paper Market address end-of-life processing for high-calcium-carbonate grades?
High-CaCO3 grades can be incinerated with calciumite recovery or downcycled into construction aggregates. Dedicated collection pilots in Japan and Germany are testing closed-loop reprocessing into new stone paper sheets [10].    
Author
Author
Author Profile
Snehal Singh LinkedIn
Manager - Research
High acumen in analyzing complex macro & micro markets with more than 6 years of work experience in the field of market research. By implementing her analytical skills in forecasting and estimation into market research reports, she has expertise in Packaging, Construction, and Equipment domains. She handles a team size of 20-25 resources and ensures smooth running of the projects, associated marketing activities, and client servicing.

Research Approach


Secondary Research

The secondary research process involved comprehensive analysis of regulatory databases, industry publications, sustainability research reports, and authoritative environmental organizations. Key sources included the US Environmental Protection Agency (EPA), European Environment Agency (EEA), International Organization for Standardization (ISO), Forest Stewardship Council (FSC), Sustainable Packaging Coalition (SPC), Ellen MacArthur Foundation, World Resources Institute (WRI), United Nations Environment Programme (UNEP), US Geological Survey (USGS), China Ministry of Ecology and Environment, EU Eurostat Environmental Database, and national environmental ministry reports from key markets. These sources were used to collect calcium carbonate mining statistics, regulatory compliance data, sustainability certifications, environmental impact assessments, and market landscape analysis for stone paper sheets, stone paper rolls, packaging applications, and stationery products.


Primary Research

In the initial research phase, both supply-side and demand-side stakeholders were interviewed to gather qualitative and quantitative views. Supply-side sources included CEOs, VPs of Manufacturing Operations, sustainability directors, and commercial directors from companies that make stone paper, calcium carbonate, and specialty resins. Demand-side sources included procurement managers from packaging companies, print production managers, stationery retail buyers, and sustainability officials from businesses, schools, and online stores. Primary research confirmed market segmentation, confirmed deadlines for expanding production capacity, and gathered information on how materials are used, pricing tactics, and how companies follow sustainability rules.

Primary Respondent Breakdown:

By Designation: C-level Primaries (32%), Director Level (30%), Others (38%)

By Region: North America (32%), Europe (30%), Asia-Pacific (28%), Rest of World (10%)


Market Size Estimation

Global market valuation was derived through revenue mapping and production volume analysis. The methodology included:

Identification of 40+ key manufacturers across North America, Europe, Asia-Pacific, and Latin America

Product mapping across stone paper sheets, stone paper rolls, stone paper products, and stone paper booklets

Analysis of reported and modeled annual revenues specific to stone paper portfolios

Coverage of manufacturers representing 65-70% of global market share in 2024

Extrapolation using bottom-up (production volume × ASP by country) and top-down (manufacturer revenue validation) approaches to derive segment-specific valuations

Download Free Sample

Kindly complete the form below to receive a free sample of this Report

Download PDF ×

We do not share your information with anyone. However, we may send you emails based on your report interest from time to time. You may contact us at any time to opt-out.














