Surgical Equipment Market (2026 - 2035)

Surgical Equipment Market Research Report: Size, Share, Trend Analysis By Product Type (Surgical Instruments, Electrosurgical Devices, Surgical Navigation Systems, Sutures, Endoscopy Equipment), By Applications (Orthopedic Surgery, Cardiac Surgery, Neurosurgery, General Surgery, Plastic Surgery), By End Use (Hospitals, Ambulatory Surgical Centers, Specialty Clinics), By Technology (Robotic Surgery, Laparoscopic Surgery, Minimally Invasive Surgery) and By Regional (North America, Europe, South America, Asia Pacific, Middle East and Africa) - Growth Outlook & Industry Forecast 2025 To 2035
ID: MRFR/HC/0113-HCR
200 Pages
Rahul Gotadki, Vikita Thakur
Last Updated: July 12, 2026
Surgical Equipment Market
Market Size
Forecast Period2026-2035
CAGR (2026-2035)7.50%
2025 Market SizeUSD 18.55 Billion
2035 Market SizeUSD 38.25 Billion
Key Players
Medtronic plc
Johnson & Johnson
Stryker Corporation
B. Braun Melsungen AG
ConMed Corporation
Smith & Nephew plc
Opportunities
  • Single-Use Instrument Platforms
  • Emerging-Market Infrastructure Build-Outs
  • Data Monetization Through Connected OR Ecosystems

Surgical Equipment Market Summary

The Surgical Equipment Market stood at USD 18.55 Billion in 2025 and is projected to climb from USD 19.94 Billion in 2026 to USD 38.25 Billion by 2035, registering a CAGR of 7.50% across the forecast window. Two catalysts are driving this expansion: a global rise in surgical procedure volumes — the WHO estimates more than 310 million major operations are performed annually [1] — and sustained government investments in healthcare infrastructure, particularly across low- and middle-income economies where surgical capacity remains critically underbuilt [2].

The technology landscape inside the operating room is shifting fast. Legacy manual instruments are giving way to integrated energy-based platforms that cut, seal, and coagulate in a single pass, reducing procedure times by up to 25% according to peer-reviewed trials [3]. Hospitals worldwide committed an estimated USD 4.8 Billion to operating-room capital upgrades in 2024 alone, with a growing share directed at robotic-assisted and image-guided platforms [4]. Regulatory bodies including the U.S. FDA and the EU MDR framework are accelerating clearance pathways for advanced devices, further compressing time-to-market cycles.

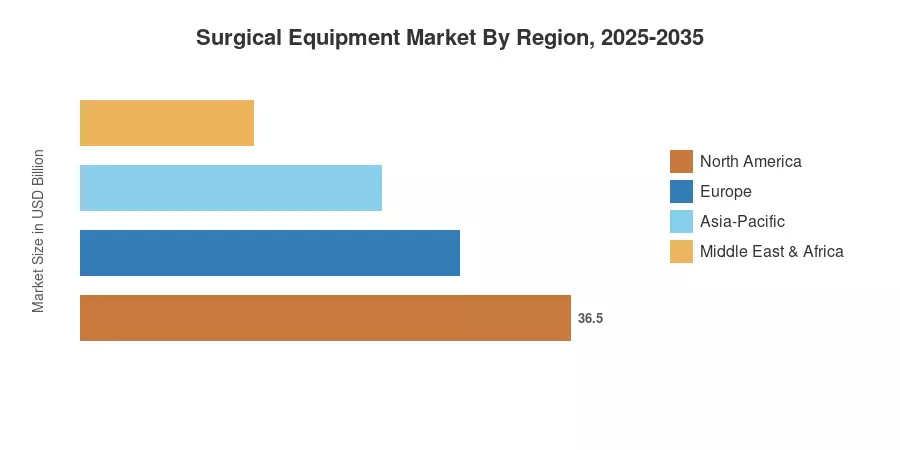
North America held a 32.4% revenue share of the Surgical Equipment Market in 2025, anchored by high procedural volumes and mature reimbursement frameworks. Asia-Pacific is set to record the fastest regional CAGR of 8.05%, reflecting capacity build-outs in China, India, and Southeast Asia [5]. Europe maintained the second-largest position, accounting for 27.8% of global revenue, with Germany and the U.K. leading adoption. The decade ahead will be defined by how quickly ambulatory surgical centers absorb technology that was previously confined to full-service hospitals.


Key Report Takeaways

• By Product Type

  • Sutures, Staplers & Wound-Closure Devices captured a 35.0% share of the Surgical Equipment Market in 2025, driven by the sheer volume of wound-closure procedures across all surgical specialties.
  • Powered & Electrosurgical Devices are projected to register a 7.80% CAGR through 2035, as clinicians increasingly adopt multifunctional energy platforms.

• By Application

  • Orthopedic & Trauma Surgeries commanded a 22.6% share of the Surgical Equipment Market in 2025, supported by aging demographics and sports-injury prevalence.
  • Plastic, Cosmetic & Burn Reconstruction is forecast to expand at an 8.10% CAGR, the fastest among application segments.

• By End User

  • Hospitals maintained a 61.5% revenue share in 2025, reflecting their dominance in complex, multi-specialty procedures.
  • Ambulatory Surgical Centers are advancing at an 8.30% CAGR to 2035, benefiting from outpatient-shift trends.

• By Region

  • North America led with a 32.4% revenue share of the Surgical Equipment Market in 2025.
  • Asia-Pacific is projected to post an 8.05% CAGR between 2026 and 2035.


Market Size and Forecast (2021–2035)

Market Research Future employs a triangulated estimation methodology, blending company revenue disclosures, procedural volume data from national health registries, and proprietary demand-supply modeling. Historical figures (2021–2024) reflect audited performance; the 2025 base year is validated against primary interviews with procurement heads; and the 2026–2035 forecast applies a constant-growth model consistent with underlying procedure-volume and infrastructure-spending trajectories.
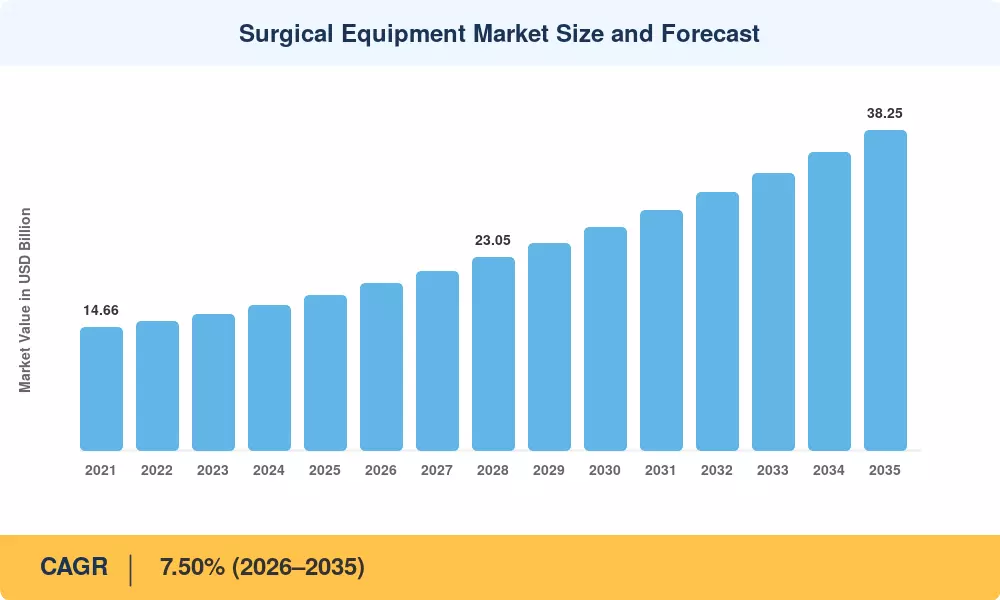
Surgical Equipment Market Size and Forecast
Our Impact
Enabled $4.3B Revenue Impact for Fortune 500 and Leading Multinationals
Partnering with 2000+ Global Organizations Each Year
30K+ Citations by Top-Tier Firms in the Industry

Driver Impact Analysis

Driver ~% Impact on CAGR Geographic Relevance Impact Timeline
Rising global surgical procedure volumes +2.1% Global Long-term (≥4 yr)
Shift toward minimally invasive surgery +1.6% North America, Europe Medium-term (2–4 yr)
ASC proliferation and outpatient migration +1.3% North America, Asia-Pacific Short-term (≤2 yr)
Healthcare infrastructure expansion in emerging markets +1.1% Asia-Pacific, South America, MEA Long-term (≥4 yr)
Aging population and chronic disease burden +0.9% Europe, Japan Long-term (≥4 yr)
Robotic surgery and digital-OR integration +0.8% North America, Europe Medium-term (2–4 yr)
Favorable reimbursement policy reforms +0.5% North America Short-term (≤2 yr)


Rising Global Surgical Procedure Volumes

According to the Lancet Commission on Global Surgery, low- and middle-income countries face a cumulative shortfall of 143 million surgical procedures per year, which governments are actively closing through specific capital projects [1]. In its 2024-2025 budget cycle, India's National Health Mission set aside INR 37,800 crore (approximately USD 4.5 billion) for tertiary-care expansion, which will directly improve instrument acquisition in 700+ district hospitals [13]. Procedure volume growth remains the single most significant tailwind for the Surgical Equipment Market, as each extra operation drives consumable and instrument demand regardless of device brand.


Shift Toward Minimally Invasive Surgery

Minimally invasive procedures currently account for more than 55% of cholecystectomies and hernia repairs in OECD countries, up from around 38% a decade ago [3]. The trend favors higher-value instrumentation, such as articulating staplers, sophisticated energy devices, and specialist trocars, which have average selling prices that are two to four times higher than standard open-surgery counterparts. CMS procedure-code analysis shows that reimbursement for laparoscopic procedures has increased by 12% since 2021, supporting hospital ROI calculations for equipment upgrades [14].


ASC Proliferation and Outpatient Migration

The United States added more than 1,200 new ambulatory surgical centers between 2020 and 2024, bringing the national total past 6,100 facilities [9]. Each new ASC represents a discrete capital-equipment purchase cycle, typically USD 1.2–2.5 Million in surgical instrumentation during the first year of operation. This expansion is not limited to the U.S.; India, Brazil, and Saudi Arabia are encouraging private-sector ASC development through tax incentives and public-private partnership frameworks [5].

Robotic Surgery and Digital-OR Integration

Intuitive Surgical's installed base exceeded 9,200 da Vinci systems globally by end-2024, and competitors including Medtronic's Hugo and Johnson & Johnson's Ottava are widening the addressable procedure set [11]. Each robotic platform generates an annuity stream of proprietary instruments and accessories valued at USD 1,500–2,800 per procedure, creating a durable pull-through effect for the broader Surgical Equipment Market. Hospitals that invest in robotic programs also tend to upgrade adjacent OR infrastructure — visualization towers, insufflators, and smoke-evacuation systems — amplifying total equipment spend.


Restraints Impact Analysis

The restraints below exert negative pressure on headline growth. Impact estimates are directional and may overlap.

Restraint ~% Impact on CAGR Geographic Relevance Impact Timeline
Capital budget constraints in public hospitals –1.2% Global Short-term (≤2 yr)
Stringent regulatory and compliance costs –0.9% Europe, North America Medium-term (2–4 yr)
Skilled surgeon and technician shortages –0.7% MEA, South America Long-term (≥4 yr)
Reprocessing and sterilization complexity –0.5% Global Medium-term (2–4 yr)
Pricing pressure from group purchasing organizations –0.4% North America Short-term (≤2 yr)


Capital Budget Constraints in Public Hospitals

Public hospitals in both wealthy and emerging economies suffer ongoing capital budget constraints. According to the American Hospital Association, 33% of US hospitals would run with negative margins in 2024, reducing their ability to fund OR remodeling initiatives [14]. Procurement cycles for high-value surgical equipment in single-payer systems across Europe can take 18-24 months due to multi-stage tender processes, limiting device uptake even when clinical evidence strongly justifies the upgrade [8].


Stringent Regulatory and Compliance Costs

The EU Medical Device Regulation (MDR 2017/745) increased the average time and cost of notified-body conformity assessments by roughly 60% compared to the prior MDD framework, according to MedTech Europe's 2024 member survey [8]. Smaller device firms face disproportionate burdens: compliance costs that exceeded EUR 1.5 Million per product family forced several niche instrument makers to exit the European market altogether. While these regulations improve patient safety, they create friction that temporarily reduces product availability and raises end-user prices across the Surgical Equipment Market.


Skilled Surgeon and Technician Shortages

The WHO estimates a global deficit of 1.27 million surgical specialists and 1.97 million anesthesia providers, concentrated in sub-Saharan Africa and South Asia [1]. Equipment without trained operators generates no revenue; this workforce gap directly constrains addressable demand. Training pipelines for advanced laparoscopic and robotic techniques remain bottlenecked, with fellowship spots growing at only 3–4% annually against procedure-volume growth exceeding 6% in many emerging markets.


Surgical Equipment Market Opportunities

Single-Use Instrument Platforms

Single-use surgical instruments eliminate reprocessing costs and cross-contamination risk, two pain points that rank among the top procurement concerns for ASC administrators. The global single-use surgical-device segment reached an estimated USD 3.1 Billion in 2024 and is expanding faster than the reusable category by roughly 300 basis points of CAGR [15]. Manufacturers that can offer competitively priced single-use alternatives in arthroscopy, laparoscopy, and wound closure stand to capture share from incumbents locked into reusable-instrument service contracts.

Emerging-Market Infrastructure Build-Outs

Sub-Saharan Africa has just 0.5 operating rooms per 100,000 people compared to 14.3 in OECD countries, representing an enormous greenfield opportunity for equipment vendors willing to design cost-optimized product lines [1]. Government-led programs like Nigeria's Basic Healthcare Provision Fund and Kenya's Universal Health Coverage rollout are channeling multilateral financing into surgical-facility construction. Companies that pair hardware sales with training academies and service networks will gain first-mover advantages in these markets.

Data Monetization Through Connected OR Ecosystems

Operating-room connectivity platforms now generate continuous data streams — instrument usage cycles, energy-device activation patterns, and procedural workflow analytics — that carry commercial value beyond the device itself. Vendors can monetize this data through software-as-a-service dashboards that help hospitals benchmark OR efficiency, predict instrument failures before they occur, and optimize case scheduling [12]. The addressable market for surgical-analytics software is projected to exceed USD 1.8 Billion by 2030, opening a high-margin recurring-revenue channel for equipment OEMs.

Per-Procedure and Flexible Financing Models

Capital constraints are nudging hospitals and ASCs toward usage-based pricing, where suppliers charge a per-case fee rather than requiring upfront equipment purchase. This model lowers adoption barriers, accelerates installed-base growth, and creates predictable revenue streams for manufacturers. Medtronic's "TouchSurgery Enterprise" and Stryker's "Flex Financial" programs demonstrate that creative financing can shift purchasing decisions from C-suite budget committees to surgical-department champions.

AI-Guided Surgical Navigation

Artificial intelligence is moving from radiology into the operating room, powering intraoperative image-guidance systems that overlay real-time anatomy on a surgeon's field of view [12]. Companies such as Augmedics and Proprio have received FDA clearance for AR-based spinal navigation, and the technology is expanding into orthopedic trauma and cranial procedures. Early clinical data shows a 40% reduction in fluoroscopy time when AI navigation is used, creating compelling value propositions for both patient safety and OR throughput.


Surgical Equipment Market Future Outlook

AI-Augmented Surgical Decision-Making

Artificial intelligence will move beyond navigation into intraoperative decision support by 2030, with algorithms that analyze tissue perfusion in real time, flag anatomical anomalies, and recommend optimal instrument selection mid-procedure. Estimates suggest that AI applications in the operating room could reduce adverse surgical events by 20–30%, creating a compelling quality and liability argument for adoption [12]. The Surgical Equipment Market will increasingly bundle hardware with embedded AI software, shifting competitive differentiation from mechanical design to algorithmic capability.

Sustainability-Driven Procurement

By 2028, an estimated 40% of European hospital procurement tenders will include mandatory carbon-footprint scoring for surgical devices, according to Health Care Without Harm projections [17]. This shift will favor manufacturers that can demonstrate lifecycle carbon reductions through lighter packaging, reprocessable components, and localized manufacturing. The sustainability imperative will also accelerate the single-use versus reusable debate, as lifecycle analyses increasingly show that modern single-use devices can match or beat reusable counterparts on environmental metrics when reprocessing energy costs are fully accounted for.

Platform Economics and Ecosystem Lock-In

The surgical equipment industry is migrating toward platform business models where instrument compatibility, data integration, and consumable pull-through create ecosystem lock-in analogous to enterprise software. Stryker's "Connected OR" and Medtronic's "Touch Surgery" platforms exemplify this strategy, generating recurring revenue streams that now represent 15–20% of these companies' surgical-segment income [22]. Over the next decade, the Surgical Equipment Market will reward vendors that control end-to-end OR workflows over those selling standalone devices.

Ambulatory Surgical Centers as the Default Venue

CMS projects that 60% of Medicare-eligible surgical procedures will be performed in outpatient settings by 2033, up from roughly 48% in 2024 [16]. This migration redefines instrument requirements: ASCs need compact footprints, rapid-turnover capabilities, and all-in-one device platforms rather than the specialized, multi-tray setups found in large hospitals. Equipment manufacturers that design purpose-built ASC product lines — lighter, modular, and priced for per-procedure economics — will capture disproportionate growth.


Surgical Equipment Market Segmentation

By Product Type

Segment Key Metric Primary Demand Driver
Sutures, Staplers & Wound-Closure Devices 35.0% share (2025) Universal demand across all surgeries
Handheld Surgical Instruments USD 5.29 Billion (2025) Foundational instrument sets
Powered & Electrosurgical Devices 7.80% CAGR (2026–2035) Multifunctional energy-platform adoption
Other Products USD 2.54 Billion (2025) Specialty and ancillary devices


Sutures, staplers, and wound-closure devices remain the backbone of the Surgical Equipment Market because virtually every operative procedure — regardless of specialty — culminates in wound closure. This segment's stability makes it a cash-flow anchor for diversified manufacturers like Ethicon and B. Braun, even as higher-growth categories attract R&D investment. Powered and electrosurgical devices represent the fastest-expanding product category, driven by surgeon preference for instruments that consolidate cutting, sealing, and coagulation into a single handpiece. Devices like Medtronic's LigaSure and Ethicon's Harmonic portfolio have established clinical protocols in general, bariatric, and thoracic surgery, creating switching costs that sustain premium pricing.

By Application

Segment Key Metric Primary Demand Driver
Orthopedic & Trauma 22.6% share (2025) Aging populations and trauma incidence
Cardiovascular & Thoracic CAGR 7.65% (2026–2035) Coronary and structural heart procedures
General Surgery USD 3.49 Billion (2025) High-volume routine procedures
Plastic, Cosmetic & Burn Reconstruction 8.10% CAGR (2026–2035) Elective and reconstructive demand
Neurosurgery USD 2.50 Billion (2025) Precision instrument requirements
Other Applications CAGR 6.80% (2026–2035) Emerging specialties


Orthopedic and trauma applications lead the Surgical Equipment Market by share, reflecting global aging trends — the UN projects that the population aged 65+ will reach 1.6 billion by 2050 — and rising road-traffic trauma in developing economies [7]. Plastic, cosmetic, and burn reconstruction commands the fastest application-level CAGR, powered by the dual engines of elective cosmetic procedures in developed markets and burn-care infrastructure buildouts in South Asia and sub-Saharan Africa.

By End User

Segment Key Metric Primary Demand Driver
Hospitals 61.5% share (2025) Complex multi-specialty surgery volumes
Ambulatory Surgical Centers 8.30% CAGR (2026–2035) Outpatient-shift economics
Other End Users USD 2.63 Billion (2025) Specialty clinics and physician offices


Hospitals continue to dominate the Surgical Equipment Market because they handle the highest-acuity procedures — cardiac, neuro, transplant — requiring the broadest instrument inventories. Ambulatory surgical centers, however, are closing the gap at pace. Their per-case equipment spend may be lower, but facility counts are multiplying fast enough to generate the segment's leading CAGR. The "other" category includes physician-office surgical suites and military field hospitals, both of which are increasingly adopting compact, self-contained instrument platforms.


Regional Market Share Analysis

Region Key Metric Primary Investment Themes
North America 32.4% revenue share (2025) Robotic adoption, ASC expansion, value-based care
Europe USD 5.16 Billion (2025) EU MDR compliance, single-use transitions
Asia-Pacific 8.05% CAGR (2026–2035) Hospital construction, procedure-volume catch-up
South America USD 1.39 Billion (2025) Public-private partnerships, trauma-center upgrades
Middle East & Africa 7.15% CAGR (2026–2035) Greenfield facility builds, medical tourism

The Surgical Equipment Market displays distinct regional growth profiles shaped by healthcare spending levels, regulatory maturity, and surgical capacity.


North America

Country Key Metric Key Driver
United States 78.5% of regional share Largest ASC network globally
Canada 12.8% of regional share Provincial OR modernization programs
Mexico CAGR 8.20% (2026–2035) Medical-tourism investment


The United States accounts for the overwhelming majority of North American revenue in the Surgical Equipment Market, supported by more than 6,100 ASCs and a hospital sector that performed an estimated 51 million inpatient procedures in 2024 [9]. Canada's surgical-equipment procurement is undergoing a cycle refresh as provinces fund OR upgrades deferred during the pandemic. Mexico is emerging as a compelling growth pocket, driven by medical-tourism clusters in Monterrey and Guadalajara where private hospitals invest heavily in advanced instrumentation to attract international patients [19].

Europe

Country Key Metric Key Driver
Germany 23.6% of regional share MedTech manufacturing hub
United Kingdom CAGR 6.90% (2026–2035) NHS surgical-hub expansion
France 16.2% of regional share University-hospital procurement cycles
Italy USD 0.52 Billion (2025) Minimally invasive surgery adoption
Spain CAGR 6.75% (2026–2035) Public-hospital modernization
Nordic Countries 8.4% of regional share Digital-OR early adoption
Russia CAGR 5.80% (2026–2035) Import-substitution policies
Rest of Europe 11.5% of regional share Mixed procurement maturity


Europe's Surgical Equipment Market is shaped by the EU MDR transition, which has increased compliance costs but also accelerated device-replacement cycles as legacy instruments lose certification. Germany's position as a manufacturing base for B. Braun, Karl Storz, and Richard Wolf provides the region with a self-reinforcing innovation ecosystem. The U.K.'s NHS is rolling out a network of 50 surgical hubs designed to clear the elective-care backlog, each requiring full OR outfitting that represents procurement opportunities exceeding GBP 2 Million per facility [20].

Asia-Pacific

Country Key Metric Key Driver
China 34.2% of regional share National hospital-grade upgrading program
India CAGR 9.30% (2026–2035) Ayushman Bharat and private-hospital expansion
Japan USD 0.81 Billion (2025) Robotic surgery penetration
South Korea 10.1% of regional share Advanced MIS adoption
ASEAN CAGR 8.85% (2026–2035) Medical-tourism and infrastructure growth
Rest of Asia-Pacific 7.8% of regional share Varied development stages


Asia-Pacific is the fastest-growing region in the Surgical Equipment Market, propelled by China's hospital-grade upgrading initiative that aims to bring 1,000 county-level hospitals to tertiary standards by 2027 [5]. India's combination of Ayushman Bharat coverage expansion and private-hospital chain buildouts (Apollo, Fortis, Max Healthcare) is generating double-digit instrument-procurement growth. Japan's aging population — 29% of citizens are now over 65 — sustains strong demand for orthopedic and cardiovascular instruments [7].

South America

Country Key Metric Key Driver
Brazil 62.4% of regional share SUS procurement modernization
Argentina CAGR 6.40% (2026–2035) Private-sector hospital investment
Rest of South America 18.3% of regional share Uneven infrastructure development


Brazil dominates South American demand for the Surgical Equipment Market through its Unified Health System (SUS), which serves 190 million citizens and runs centralized procurement tenders that shape regional pricing benchmarks. Argentina's private hospital sector has emerged as a secondary growth engine, with chains like Swiss Medical and Galeno investing in minimally invasive surgical capabilities to differentiate their service offerings [19].

Middle East & Africa

Country Key Metric Key Driver
Saudi Arabia 28.5% of regional share Vision 2030 healthcare investment
UAE CAGR 7.95% (2026–2035) Medical-tourism hub ambitions
South Africa 19.7% of regional share Largest sub-Saharan clinical infrastructure
Egypt CAGR 7.50% (2026–2035) Universal health insurance rollout
Rest of MEA 26.8% of regional share NGO and multilateral-funded projects


Saudi Arabia's Vision 2030 has earmarked more than USD 65 Billion for healthcare transformation, including the construction of over 20 new hospitals with fully equipped surgical suites [21]. The UAE leverages its medical-tourism positioning to justify premium instrument investments at flagship facilities like Cleveland Clinic Abu Dhabi and King's College Hospital Dubai. Sub-Saharan Africa remains the most underserved region globally, yet multilateral programs from the World Bank and African Development Bank are beginning to fund surgical-capacity projects that will require foundational equipment purchases [1].


Surgical Equipment Market By Region, 2025-2035

Competitive Benchmarking

The Surgical Equipment Market exhibits medium concentration, with the top five companies collectively holding an estimated 35–42% of global revenue. The competitive structure balances multinational conglomerates — which leverage cross-selling across OR equipment, implants, and consumables — against focused specialists that compete on procedural-workflow innovation. The Herfindahl-Hirschman Index for the sector falls in the 800–1,100 range, indicating a moderately fragmented landscape where M&A activity regularly reshapes positioning.

Company Est. Revenue Share Range Key Offerings for Surgical Equipment Market Strategic Positioning
Medtronic plc ~8–11% Advanced energy, robotic-assisted surgery, stapling Broadest surgical portfolio; ecosystem play
Johnson & Johnson (Ethicon) ~7–10% Sutures, endocutters, energy devices Wound-closure and MIS market leader
Stryker Corporation ~6–9% Powered instruments, navigation, visualization Digital-OR integration and connected platforms
B. Braun Melsungen AG ~5–8% Sutures, retractors, OR management systems Strong European distribution network
Becton, Dickinson and Company ~4–7% Sharps, trocars, procedural solutions High-volume consumables focus
ConMed Corporation ~3–5% Orthopedic power tools, smoke evacuation, visualization Niche MIS and arthroscopy specialist
Smith & Nephew plc ~3–5% Sports medicine instruments, wound management Orthopedic-adjacent strength
Zimmer Biomet Holdings ~3–5% Powered surgical instruments, robotic platforms Orthopedic surgical workflow integration
Olympus Corporation ~2–4% Endoscopic and energy devices Visualization technology leadership
Integra LifeSciences ~2–3% Neurosurgical instruments, tissue technologies Specialty surgical-niche positioning


Recent News & Developments

  • April 2025: Intuitive acquired FDA authorization for its SureForm 45 stapler for use with the da Vinci SP surgical system, boosting its capabilities in urologic and thoracic operations.
  • March 2025: Johnson & Johnson MedTech unveiled its VELYS Robotic-Assisted Solution, which has received FDA approval for unicompartmental knee arthroplasty, improving joint replacement precision.
  • February 2025: Stryker completed the acquisition of Inari Medical, extending its vascular offering with an anticipated revenue contribution of USD 590 million in 2025. Stryker will benefit from Inari's experience in peripheral vascular and venous thromboembolism (VTE), as well as revolutionary mechanical thrombectomy solutions such as the FlowTriever and ClotTriever systems.


Surgical Equipment Market Report Scope

Parameter Detail
Market Scope Global Surgical Equipment Market — instruments, powered devices, sutures/staplers, and ancillary products
Study Period 2021–2035
CAGR 7.50% (2026–2035)
Market Size (2025) USD 18.55 Billion
Market Size (2035) USD 38.25 Billion
Fastest Growing Segment Ambulatory Surgical Centers (End User); Powered & Electrosurgical Devices (Product)
Companies Profiled 10 (Medtronic, J&J/Ethicon, Stryker, B. Braun, BD, ConMed, Smith & Nephew, Zimmer Biomet, Olympus, Integra LifeSciences)
Valuation Currency USD Billion


FAQs

How do connected surgical devices handle cybersecurity risks in hospital networks?
Connected OR platforms must comply with FDA premarket cybersecurity guidance (2023), requiring threat modeling and software bill-of-materials disclosure. Hospitals typically isolate surgical-device networks on dedicated VLANs with encrypted data channels [15].
What total cost of ownership should a mid-size ASC expect for a full instrument suite?
A 4-OR ambulatory center typically spends USD 3.5–5.0 Million on initial surgical equipment, including instruments, energy devices, and sterilization infrastructure. Annual consumable and maintenance costs add 12–18% of that base [9].
How does the shift to value-based reimbursement affect equipment purchasing decisions?
Value-based models reward shorter operative times and lower complication rates, steering procurement toward advanced devices that demonstrably improve outcomes. Hospitals increasingly require clinical-evidence dossiers before approving capital purchases [14].
Are 3D-printed patient-specific surgical instruments gaining regulatory acceptance?
The FDA has cleared over 200 3D-printed medical devices, including patient-specific cutting guides for orthopedic procedures. Broad adoption remains limited by per-unit cost and point-of-care manufacturing validation requirements [4].
What role do group purchasing organizations play in surgical equipment pricing?
GPOs negotiate contracts covering roughly 72% of U.S. hospital supply spending, compressing manufacturer margins by 8–15% on commodity instruments. Premium differentiated devices retain stronger pricing power outside GPO frameworks [18].
How are trade tariffs affecting cross-border surgical instrument supply chains?
U.S. Section 301 tariffs on Chinese-origin steel and titanium components raised input costs 10–22% for several instrument categories since 2023. Manufacturers are diversifying sourcing to Vietnam, India, and Mexico to mitigate exposure [19].
What training infrastructure exists for surgeons adopting robotic-assisted platforms?
Major OEMs operate dedicated training centers — Intuitive has 26 global facilities — offering cadaver labs, simulation modules, and proctored case programs. Most credentialing pathways require 15–25 supervised procedures before independent use [11].    
Author
Author
Author Profile
Rahul Gotadki LinkedIn
Research Manager
He holds an experience of about 9+ years in Market Research and Business Consulting, working under the spectrum of Life Sciences and Healthcare domains. Rahul conceptualizes and implements a scalable business strategy and provides strategic leadership to the clients. His expertise lies in market estimation, competitive intelligence, pipeline analysis, customer assessment, etc.
Co-Author
Co-Author Profile
Vikita Thakur LinkedIn
Senior Research Analyst
She holds an experience of about 5+ years in market research and business consulting projects for sectors such as life sciences, medical devices, and healthcare IT. She possesses a robust background in data analysis, market estimation, competitive intelligence, pipeline analysis market trend identification, and consumer behavior insights. Her expertise lies in technical Sales support, client interaction and project management, designing and implementing market research studies, conducting competitive analysis, and synthesizing complex data into actionable recommendations that drive business growth.

Research Approach


Secondary Research

The secondary research process involved comprehensive analysis of regulatory databases for medical devices, peer-reviewed surgical journals, clinical outcome publications, and authoritative healthcare technology organizations. Key sources included the US Food & Drug Administration (FDA) Center for Devices and Radiological Health (CDRH), European Medicines Agency (EMA) Medical Device Coordination Group (MDCG), International Organization for Standardization (ISO 13485 medical device quality management), Association of Surgical Technologists (AST), American College of Surgeons (ACS), Society of American Gastrointestinal and Endoscopic Surgeons (SAGES), European Association for Endoscopic Surgery (EAES),_advancing Minimally Invasive Gynecology Worldwide (AAGL), National Institutes of Health (NIH) National Library of Medicine, National Center for Biotechnology Information (NCBI/PubMed), World Health Organization (WHO) Global Health Observatory, Organisation for Economic Co-operation and Development (OECD) Health Statistics, World Bank Health Expenditure Database, and national medical device regulatory authorities including Japan's PMDA, China's NMPA, and India's CDSCO. These sources were utilized to collect surgical procedure statistics (procedure volumes by orthopedic, cardiac, neurosurgery, and general surgery categories), medical device regulatory approval data (510(k) clearances, PMA approvals, CE markings), clinical safety and efficacy studies, healthcare infrastructure investments, and competitive landscape analysis for surgical instruments, electrosurgical devices, robotic surgical systems, and endoscopy equipment.


Primary Research

Supply-side and demand-side stakeholders were interviewed during the primary research process to acquire qualitative and quantitative insights that were tailored to the adoption and procurement of surgical instruments. The supply-side sources comprised CEOs, VPs of Surgical Innovation, regulatory affairs leaders, commercial directors, and R&D heads from surgical robotics companies, medical device OEMs, and surgical equipment manufacturers. Board-certified orthopedic surgeons, cardiac surgeons, neurosurgeons, general surgeons, OR directors, supply chain managers, and procurement leads from tertiary care hospitals, ambulatory surgical centers (ASCs), specialty surgical clinics, and integrated delivery networks (IDNs) comprised demand-side sources. The market segmentation was validated across product categories (surgical instruments, electrosurgical devices, and endoscopy systems), and the timelines for the adoption of robotic surgery and minimally invasive technology were confirmed. Additionally, insights were gathered on the integration of surgical workflows, capital equipment purchasing cycles, maintenance service agreements, and reimbursement dynamics for surgical procedures through primary research.

Primary Respondent Breakdown:

By Designation: C-level Primaries (30%), Director Level (35%), Others (35%)

By Region: North America (32%), Europe (30%), Asia-Pacific (28%), Rest of World (10%)


Market Size Estimation

Global market valuation was derived through revenue mapping and surgical procedure volume analysis across orthopedic, cardiac, neurosurgery, and general surgery categories. The methodology included:

Identification of 45+ key surgical equipment manufacturers across North America, Europe, Asia-Pacific, and Latin America, including leaders in robotic surgery systems, electrosurgical generators, and endoscopic platforms

Product mapping across surgical instruments (scalpels, forceps, retractors), electrosurgical devices (generators, accessories), surgical navigation systems, endoscopy equipment (laparoscopes, arthroscopes), and sutures/stapling devices

Analysis of reported and modeled annual revenues specific to surgical equipment portfolios, including capital equipment sales and recurring consumables/replacement instruments

Coverage of manufacturers representing 70-75% of global market share in 2024, encompassing diversified medical device conglomerates and specialized surgical equipment pure-plays

Extrapolation using bottom-up (procedure volume × average selling price (ASP) by surgical specialty and country) and top-down (manufacturer revenue validation and supply chain confirmation) approaches to derive segment-specific valuations for robotic-assisted surgery, laparoscopic equipment, and open surgery instruments

Download Free Sample

Kindly complete the form below to receive a free sample of this Report

Download PDF ×

We do not share your information with anyone. However, we may send you emails based on your report interest from time to time. You may contact us at any time to opt-out.
















