Sustainable Fuel Market (2026 - 2035)

Sustainable Fuel Market Research Report By Fuel Type (Biodiesel & Renewable Diesel (HVO), Bioethanol, Sustainable Aviation Fuel (SAF), Bio-LNG / Bio-CNG, E-Fuels (Synthetic), Other Sustainable Fuels), By Application (Road Transport, Aviation, Maritime, Industrial / Power Generation, Other Applications), By Feedstock (Waste Oils & Fats (UCO, Tallow), Agricultural Residues, Energy Crops, Municipal Solid Waste, Algae & Novel Sources, Other Feedstocks) and By Regional (North America, Europe, South America, Asia Pacific, Middle East and Africa) - Industry Forecast to 2035
ID: MRFR/EnP/27254-HCR
128 Pages
Priya Nagrale
Last Updated: July 23, 2026
Sustainable Fuel Market
Market Size
Forecast Period2026-2035
CAGR (2026-2035)8.2%
2025 Market SizeUSD 197.8 Billion
2035 Market SizeUSD 435.2 Billion
Key Players
Neste
TotalEnergies
bp
Shell
Gevo
LanzaTech
Opportunities
  • SAF Scale-Up Through Alcohol-to-Jet and Fischer-Tropsch Pathways
  • Maritime Decarbonization and Bio-LNG Bunkering
  • Emerging-Market Biofuel Production in Southeast Asia and Latin America

Sustainable Fuel Market Summary

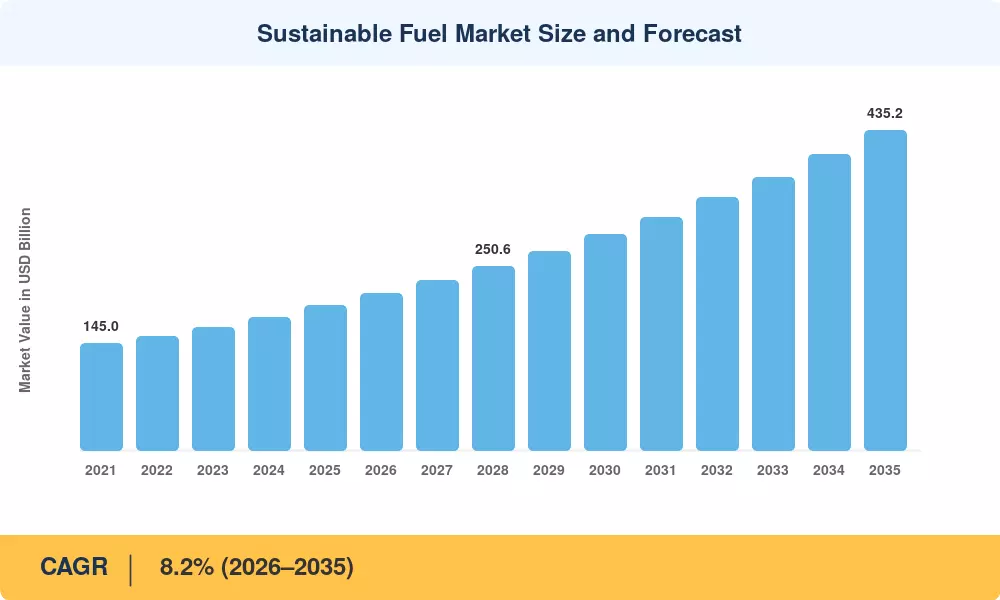
The global Sustainable Fuel Market was valued at approximately USD 197.8 billion in 2025 and is projected to reach USD 214.0 billion in 2026 before expanding to USD 435.2 billion by 2035, registering a compound annual growth rate (CAGR) of 8.2% over the 2026–2035 forecast window. Two catalysts are driving this acceleration: the European Union's ReFuelEU Aviation regulation mandating escalating blending quotas through 2050 [1] and the U.S. Inflation Reduction Act's $1.25-per-gallon Sustainable Aviation Fuel (SAF) blender's tax credit, which alone mobilized over USD 4.5 billion in private refinery investment commitments between 2023 and 2025 [2].

The technology shift underpinning the Sustainable Fuel Market involves displacing unabated fossil-derived fuels with biogenic, waste-derived, and power-to-liquid alternatives. Legacy petroleum refining assets are being retrofitted into hydroprocessed esters and fatty acids (HEFA) and Fischer-Tropsch synthesis facilities. Neste's Singapore expansion — a USD 1.9 billion project completed in 2023 — added 1.3 million tonnes of renewable product capacity, signaling the scale of capital now flowing into drop-in fuel pathways [3].

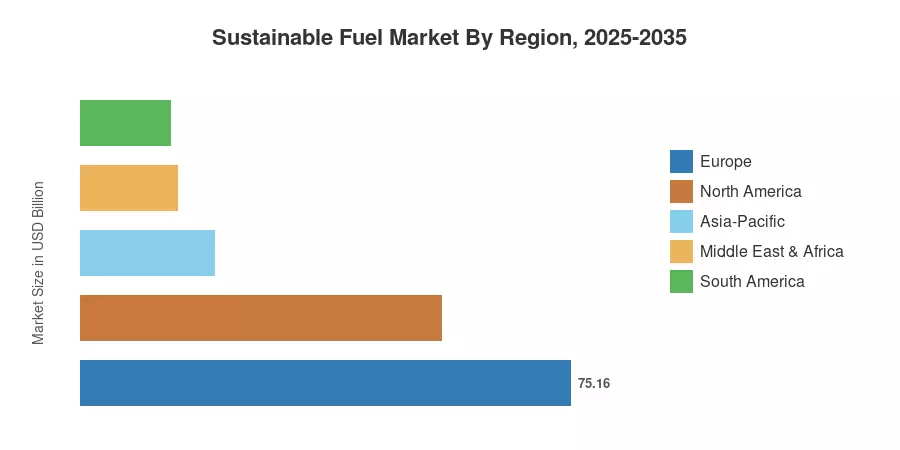
Europe commands the dominant share of the Sustainable Fuel Market at roughly 38% of global revenue, propelled by the EU Renewable Energy Directive III (RED III) targets. Asia-Pacific represents the fastest-growing region with a projected CAGR of 10.4%, led by India's ethanol blending programme and Japan's SAF commercialization roadmap. North America holds the second-largest share at approximately 28%, anchored by California's Low Carbon Fuel Standard and federal tax incentives. As decarbonization timelines compress across aviation, maritime, and heavy road transport, the Sustainable Fuel Market stands at the intersection of energy security and climate policy.


Key Report Takeaways

• By Fuel Type

  • Biodiesel and renewable diesel (HVO) account for roughly 38% of the Sustainable Fuel Market, driven by mature feedstock supply chains and drop-in compatibility with existing diesel infrastructure.
  • SAF is the fastest-growing fuel segment with a projected CAGR of 14.6% through 2035, reflecting regulatory mandates and airline offtake agreements.
  • E-fuels and synthetic pathways represent an estimated USD 13.8 billion opportunity by 2035 as electrolyzer costs continue to decline.

• By Application

  • Road transport absorbs the largest share of sustainable fuel volumes at 52%, although this share is expected to contract as aviation and maritime mandates accelerate.
  • The aviation sector within the Sustainable Fuel Market is forecast to grow at a CAGR of 13.9%, propelled by ICAO's CORSIA framework and national blending mandates.

• By Region

  • Europe holds an estimated 38% revenue share, the largest of any region in the Sustainable Fuel Market.
  • Asia-Pacific records the highest regional CAGR at 10.4%, with India and Japan as primary growth engines.
  • North America contributes approximately USD 55.4 billion in 2025 revenue, supported by state-level LCFS programmes and federal blender credits.


Sustainable Fuel Market Size and Forecast (2021–2035)

Market Research Future's sizing model triangulates top-down regulatory-capacity forecasts with bottom-up production data from refinery conversion trackers and disclosed offtake volumes. Historical figures (2021–2024) are grounded in IEA Bioenergy production statistics; forecast values apply the 8.2% CAGR with year-specific adjustments for known capacity additions and policy-trigger events.
Sustainable Fuel Market Size and Forecast
Our Impact
Enabled $4.3B Revenue Impact for Fortune 500 and Leading Multinationals
Partnering with 2000+ Global Organizations Each Year
30K+ Citations by Top-Tier Firms in the Industry

Driver Impact Analysis

Driver ~% Impact on CAGR Geographic Relevance Impact Timeline
Regulatory blending mandates (ReFuelEU, RED III, RFS) ~22% Global Short-term (≤2 yr)
Aviation decarbonization (CORSIA, airline offtakes) ~18% Global Medium-term (2–4 yr)
Tax incentives and production credits (U.S. IRA §45Z) ~16% North America Short-term (≤2 yr)
Feedstock diversification (waste oils, MSW, algae) ~14% Europe, Asia-Pacific Medium-term (2–4 yr)
Electrolyzer cost decline for e-fuels ~12% Europe Long-term (≥4 yr)
Carbon pricing expansion (EU ETS, national schemes) ~10% Europe, Asia-Pacific Medium-term (2–4 yr)
Maritime GHG intensity regulations (FuelEU Maritime) ~8% Europe, Asia-Pacific Long-term (≥4 yr)


Regulatory Blending Mandates

Compulsory blending frameworks are the primary catalyst for the Sustainable Fuel Market in the near term. The EU's ReFuelEU Aviation regulation requires airports to supply fuel containing at least 2% SAF by 2025, escalating to 6% by 2030 and 70% by 2050 [1]. On the road-transport side, RED III raises the renewable energy target for transport to 29% by 2030, creating binding demand across member states. These mandates convert voluntary corporate commitments into guaranteed offtake, thereby reducing the risk associated with capital investment in new production capacity.


Aviation Decarbonization and Airline Offtake Agreements

ICAO's Carbon Offsetting and Reduction Scheme for International Aviation (CORSIA) entered its first compliance phase in 2024, covering approximately 80% of international emissions growth above 2019 levels [9]. Airlines have responded with over USD 30 billion in long-term SAF purchase agreements, anchoring demand visibility for producers in the Sustainable Fuel Market. United Airlines' USD 1.5 billion Sustainable Ventures Fund and Delta's partnership with Gevo illustrate the sector's corporate financing model.

4.3 U.S. Tax Incentives and Production Credits

The Inflation Reduction Act's §45Z Clean Fuel Production Credit, effective from 2025, provides up to USD 1.75 per gallon for fuels with lifecycle carbon intensity below 50 kg CO₂e/mmBTU [2]. This credit structure creates a powerful economic incentive for Sustainable Fuel Market participants to invest in alcohol-to-jet and gasification pathways that achieve the deepest carbon reductions. Estimated cumulative tax credit value through 2032 exceeds USD 8.6 billion [15].

Feedstock Diversification

Reliance on used cooking oil (UCO) and animal fats has created supply bottlenecks in Europe, where UCO imports from China surged 40% between 2021 and 2023 [12]. Producers within the Sustainable Fuel Market are diversifying toward municipal solid waste, forestry residues, and purpose-grown cover crops. LanzaTech's gas-fermentation technology converts industrial off-gases into ethanol, demonstrating commercial viability at its Shougang Steel facility in China.


Restraints Impact Analysis

The restraint impact values below reflect directional drag on market expansion; they are not algebraically subtracted from the CAGR.

Restraint ~% Impact on CAGR Geographic Relevance Impact Timeline
Feedstock supply constraints and UCO price volatility ~–20% Europe, Asia-Pacific Short-term (≤2 yr)
High production cost premium vs. fossil fuels ~–18% Global Medium-term (2–4 yr)
Infrastructure and logistics gaps ~–15% Emerging markets Long-term (≥4 yr)
Policy uncertainty and subsidy phase-out risk ~–12% North America Medium-term (2–4 yr)
Certification and sustainability verification complexity ~–10% Global Short-term (≤2 yr)


Feedstock Supply Constraints

The single largest structural challenge for the Sustainable Fuel Market remains feedstock availability. Global UCO collection volumes are estimated at roughly 10 million tonnes annually, yet projected HEFA production capacity alone will require more than 25 million tonnes of eligible feedstocks by 2030 [12]. Competition among biodiesel, renewable diesel, and SAF producers for the same waste-oil supply has driven UCO spot prices up nearly 35% since 2022. Without rapid commercialization of cellulosic and waste-gas pathways, feedstock constraints will cap throughput at existing facilities.

High Production Cost Premium

SAF currently trades at a 2–5× cost premium over conventional Jet A-1, while e-fuels produced via direct air capture and electrolysis can exceed USD 5 per litre [16]. Even with tax credits and carbon pricing, cost parity remains elusive for most pathways before 2032. For the Sustainable Fuel Market, this price gap limits voluntary uptake and places the burden of demand creation on regulatory mandates rather than market economics.

Infrastructure and Logistics Gaps

The infrastructure for blending, storage, and distribution in emerging economies is still insufficiently developed. The concentration of port bunkering facilities for bio-LNG in Northwest Europe and Singapore results in the underserving of major shipping corridors [17]. Sustainable fuel penetration outside Western markets is restricted by the absence of dedicated B100 or HVO storage at inland petroleum depots in road transport. The anticipated cumulative investment of USD 35 billion through 2035 will be necessary to upgrade global infrastructure to accommodate higher blend ratios.


Sustainable Fuel Market Opportunities

SAF Scale-Up Through Alcohol-to-Jet and Fischer-Tropsch Pathways

Alcohol-to-jet (AtJ) technology converts sugarcane- and corn-derived ethanol into kerosene-range hydrocarbons at lifecycle carbon reductions exceeding 80%. The Sustainable Fuel Market is expected to see AtJ capacity quadruple by 2030 as LanzaJet's Freedom Pines facility demonstrates cost-competitiveness at USD 3.50 per gallon [19]. Pairing AtJ with carbon-capture-enhanced ethanol production could push lifecycle emissions to near zero.

Maritime Decarbonization and Bio-LNG Bunkering

The International Maritime Organization's 2023 revised GHG strategy targets a 20% reduction in shipping emissions by 2030 relative to 2008 and net-zero by 2050 [11]. This creates a substantial addressable opportunity within the Sustainable Fuel Market for bio-LNG and bio-methanol bunkering infrastructure at major port clusters. TotalEnergies and CMA CGM have already committed to bio-LNG supply agreements across key Asian and European routes.

Emerging-Market Biofuel Production in Southeast Asia and Latin America

In 2024, Brazil's RenovaBio program generated more than 36 million decarbonization credits (CBIOs), which were used to monetize carbon reductions for ethanol and biodiesel producers [20]. Excess palm oil mill effluent and agricultural residues are available in Indonesia and Malaysia, which could be used to create second-generation biofuel pathways. The Sustainable Fuel Market is poised to benefit from the expansion of domestic mandates and the reduction of feedstock procurement costs in these regions.


Digital Certification and Carbon-Credit Monetization

Blockchain-based chain-of-custody platforms such as RSB's book-and-claim system allow producers to decouple physical fuel delivery from sustainability attribute trading. This digital layer creates new revenue streams within the Sustainable Fuel Market by enabling airlines to purchase verified carbon reductions independent of supply logistics. Early movers like Xpansiv and Verra are positioning tokenized renewable fuel certificates as tradable financial instruments.

Green Hydrogen Integration for Power-to-Liquid Fuels

Electrolyzer installed capacity is forecast to reach 134 GW globally by 2030, roughly a twentyfold increase from 2024 levels, according to the sources [13]. Coupling cheap renewable electricity with direct air capture of CO₂ unlocks scalable e-fuel production. The Sustainable Fuel Market will benefit as electrolyzer costs decline below USD 300/kW, making synthetic kerosene competitive with conventional SAF pathways by the early 2030s.


Sustainable Fuel Market Future Outlook

Electrification–Fuel Complementarity in Hard-to-Abate Sectors

Battery-electric powertrains will capture the light-duty vehicle segment, but aviation, long-haul trucking, and deep-sea shipping resist direct electrification due to energy-density constraints. The Sustainable Fuel Market will therefore become the primary decarbonization lever for these sectors, with the IEA estimating that sustainable fuels must supply at least 10% of global transport energy by 2030 to align with net-zero pathways [5].

Platform Economics and Feedstock Aggregation

Digital procurement platforms are emerging to aggregate distributed waste-oil, agricultural-residue, and forestry-biomass supply into reliable, traceable feedstock streams. Companies like Argus Media and Commodity Insights are building sustainability-verified price indices for UCO and tallow, bringing pricing transparency to the Sustainable Fuel Market. By 2030, analysts expect standardized feedstock exchanges to reduce procurement costs by 12–18% [23].

ESG Reporting and Scope 3 Compliance Pressure

The EU Corporate Sustainability Reporting Directive (CSRD) and the SEC's climate-related disclosure rules are compelling large emitters to quantify and reduce Scope 3 transportation emissions. Airlines, shipping lines, and logistics firms purchasing sustainable fuels can directly lower reported lifecycle emissions, creating an ESG-driven demand floor for the Sustainable Fuel Market through the forecast period [14].

AI-Enabled Process Optimization

From the characterization of feedstock using near-infrared spectroscopy to the optimization of catalysts in Fischer-Tropsch reactors, machine-learning models are being implemented throughout the Sustainable Fuel Market value chain. Through real-time process control, bp has achieved a 6–8% increase in renewable diesel yield at its Cherry Point refinery as a result of its partnership with C3.ai [24]. By 2030, it is feasible to achieve production cost reductions of 10–15% as digital twins become the norm in biorefinery operations.


Sustainable Fuel Market Segmentation

By Fuel Type

Segment Key Metric Primary Demand Driver
Biodiesel & Renewable Diesel (HVO) ~38% share (2025) Drop-in compatibility with existing diesel engines
Bioethanol CAGR 6.8% Road-transport blending mandates globally
Sustainable Aviation Fuel (SAF) CAGR 14.6% CORSIA and ReFuelEU Aviation mandates
Bio-LNG / Bio-CNG ~USD 19.8 B (2025) Maritime and heavy-duty trucking decarbonization
E-Fuels (Synthetic) CAGR 18.2% Green hydrogen cost declines and EU PtL mandates
Other Sustainable Fuels ~5% share (2025) Niche industrial and heating applications


Biodiesel and renewable diesel dominate the Sustainable Fuel Market by volume, benefiting from established supply chains and minimal end-use infrastructure modification. Neste, TotalEnergies, and Diamond Green Diesel collectively operate over 6 million tonnes of annual HVO capacity, with additional expansions planned through 2028 [3]. Renewable diesel's premium pricing over conventional FAME biodiesel reflects its superior cold-flow properties and compatibility with existing fuel-quality standards.

SAF represents the highest-growth fuel category in the Sustainable Fuel Market, albeit from a smaller base. Global SAF production reached approximately 1.5 million tonnes in 2024 — less than 0.3% of total jet fuel demand — but committed capacity additions across HEFA, AtJ, and Fischer-Tropsch pathways target 10 million tonnes by 2030 [9]. The segment's growth trajectory is primarily mandate-driven, with regulatory penalties for non-compliance creating guaranteed offtake volumes.

By Application

Segment Key Metric Primary Demand Driver
Road Transport ~52% share (2025) National ethanol and biodiesel blending mandates
Aviation CAGR 13.9% CORSIA compliance and airline net-zero pledges
Maritime ~USD 23.7 B (2025) IMO GHG strategy and FuelEU Maritime
Industrial / Power Generation ~10% share (2025) Co-firing mandates and industrial heat decarbonization
Other Applications CAGR 5.4% Rail, off-road, and military uses


Road transport remains the largest end-use within the Sustainable Fuel Market, absorbing the majority of ethanol and biodiesel volumes produced globally. However, its share is projected to decline from 52% in 2025 to approximately 44% by 2035 as electric vehicles erode demand for liquid fuels in the light-duty segment, redirecting sustainable fuel production toward aviation and shipping.

Aviation is emerging as the defining growth vector for the Sustainable Fuel Market over the next decade. With direct electrification of commercial aircraft remaining decades away, airlines are contractually locking in SAF supply to meet both voluntary net-zero commitments and mandatory CORSIA obligations. Over 100 offtake agreements were signed between 2022 and 2025, representing cumulative committed volumes exceeding 25 million tonnes [9].

By Feedstock

Segment Key Metric Primary Demand Driver
Waste Oils & Fats (UCO, Tallow) ~30% share (2025) Lowest-cost HEFA feedstock with established collection
Agricultural Residues CAGR 9.5% Cellulosic ethanol and pyrolysis pathway development
Energy Crops ~USD 35.6 B (2025) Sugarcane ethanol in Brazil and corn ethanol in the U.S.
Municipal Solid Waste CAGR 11.3% Waste-to-fuel gasification projects gaining regulatory support
Algae & Novel Sources ~8% share (2025) Long-term R&D pipelines for high-yield oil production
Other Feedstocks ~7% share (2025) Forestry residues and industrial off-gases


Waste oils and fats anchor the Sustainable Fuel Market's current feedstock supply, given their low cost and favourable lifecycle emissions profiles under RED III. UCO collected primarily from food-service operations in China, the EU, and the U.S. feeds the majority of global HEFA production. Price volatility remains a risk: EU UCO spot prices exceeded EUR 1,200 per tonne in late 2024, compressing refinery margins for HVO producers [12].

Municipal solid waste and agricultural residues represent the fastest-expanding feedstock categories in the Sustainable Fuel Market. Gasification-based pathways — such as those developed by Sierra Energy and Fulcrum BioEnergy — convert non-recyclable waste into synthesis gas for Fischer-Tropsch liquid production. These pathways command premium carbon-intensity scores under LCFS and RED III, unlocking higher credit revenues for producers [8].


Regional Market Share Analysis

Region Key Metric Primary Investment Themes
Europe ~38% revenue share (2025) RED III, ReFuelEU Aviation, FuelEU Maritime
North America ~USD 55.4 B (2025) IRA tax credits, LCFS, refinery conversions
Asia-Pacific CAGR 10.4% Ethanol blending, SAF roadmaps, green hydrogen
South America ~USD 13.8 B (2025) Sugarcane ethanol, RenovaBio, biodiesel mandates
Middle East & Africa CAGR 7.5% Green hydrogen export hubs, SAF demonstration
Total USD 197.8 B (2025)

The Sustainable Fuel Market displays a pronounced geographic concentration, with Europe and North America collectively accounting for roughly two-thirds of global revenues. Regulatory maturity, feedstock infrastructure, and carbon-pricing mechanisms shape the competitive position of each region.


Europe

Country Key Metric Key Driver
Germany ~24% of regional share National PtL roadmap and e-fuel incentives
France CAGR 8.8% Domestic SAF blending mandate and TotalEnergies capacity
United Kingdom ~USD 7.2 B (2025) Jet Zero Strategy and SAF clearing house
Netherlands ~16% of regional share Major HVO refining hub at Rotterdam
Rest of Europe ~28% of regional share Nordic biofuel heritage and RED III transposition


Europe's leadership in the Sustainable Fuel Market reflects over a decade of layered regulations, from the original Fuel Quality Directive through RED II to the current RED III framework. Germany's power-to-liquid roadmap commits EUR 1.8 billion in federal funding through 2028, while Neste's Rotterdam refinery — the world's largest renewable diesel plant — underscores the Netherlands' role as a processing hub [6]. The UK's Jet Zero Strategy targets 10% SAF use by 2030 and has established a dedicated SAF clearing house to aggregate airline demand.

North America

Country Key Metric Key Driver
United States ~82% of regional share IRA §45Z credit, California LCFS
Canada CAGR 9.3% Clean Fuel Regulations and SAF Grand Challenge
Mexico ~USD 1.4 B (2025) Biodiesel blending pilot programmes


The United States dominates the North American Sustainable Fuel Market, with California alone generating over 25 million LCFS credits in 2024 [8]. Refinery conversions along the Gulf Coast and West Coast — including the former Phillips 66 Rodeo facility now producing 100% renewable fuels — illustrate the industry's pivot from petroleum refining to sustainable feedstock processing. Canada's Clean Fuel Regulations, effective since 2023, impose lifecycle carbon intensity reduction requirements that incentivize domestic HVO and ethanol production [21].

Asia-Pacific

Country Key Metric Key Driver
India CAGR 12.1% E20 ethanol programme and second-generation biofuel PLI
Japan ~USD 5.8 B (2025) SAF commercialization target at major airports
China ~34% of regional share Waste-oil collection infrastructure and biodiesel exports
South Korea CAGR 10.8% Hydrogen Economy Roadmap and SAF mandate (2027)
Rest of Asia-Pacific ~18% of regional share Southeast Asian palm-residue feedstock advantage


Asia-Pacific is the fastest-growing region in the Sustainable Fuel Market, reflecting aggressive government mandates and abundant biomass feedstock. India's ethanol blending programme achieved its E20 target ahead of schedule, and a production-linked incentive scheme worth INR 18,000 crore targets second-generation ethanol and compressed biogas [7]. Japan's Ministry of Economy, Trade and Industry has set a target to replace 10% of jet fuel consumed domestically with SAF by 2030, backed by a public–private partnership that includes ANA, JAL, and ENEOS [10].

South America

Country Key Metric Key Driver
Brazil ~72% of regional share RenovaBio CBIOs and sugarcane ethanol dominance
Argentina CAGR 7.9% Soybean-based biodiesel expansion
Rest of South America ~USD 1.5 B (2025) Emerging palm-oil and forestry-residue programmes


Brazil remains the anchor of the South American Sustainable Fuel Market, producing more than 35 billion litres of sugarcane ethanol annually. The RenovaBio programme monetizes carbon reductions through tradable CBIOs, providing an additional revenue stream that incentivizes plant efficiency upgrades [20]. Argentina's biodiesel sector, built on soybean crush capacity, exported approximately 1.8 million tonnes in 2024 despite fluctuating export tax policies.

Middle East & Africa

Country Key Metric Key Driver
UAE ~38% of regional share Masdar green hydrogen projects and SAF trials
Saudi Arabia CAGR 8.1% NEOM green hydrogen and synthetic fuel ambitions
South Africa ~USD 1.2 B (2025) Sasol gas-to-liquids pivot to sustainable feedstock
Rest of MEA ~22% of regional share Nascent biofuel programmes across East Africa


The Middle East & Africa region is transitioning from fossil-fuel exporter to sustainable-fuel producer. The UAE's Masdar has committed over USD 2 billion to green hydrogen electrolyzer capacity, positioning Abu Dhabi as an e-fuel export hub [22]. Saudi Arabia's NEOM project targets 600 tonnes per day of green hydrogen production by 2026, with downstream conversion to green ammonia and synthetic methanol. These investments could reshape the Sustainable Fuel Market by introducing low-cost renewable electricity into fuel synthesis pathways.


Sustainable Fuel Market By Region, 2025-2035

Competitive Benchmarking

The Sustainable Fuel Market is moderately concentrated, with an estimated Herfindahl-Hirschman Index (HHI) below 1,000 and the top five producers accounting for roughly 32–38% of global revenue. Large integrated oil majors compete alongside pure-play renewable fuel companies, and recent years have seen aggressive capacity expansion through greenfield construction, refinery conversions, and joint ventures. Strategic partnerships with airlines and shipping companies for long-term offtake have become a key competitive differentiator.

Company Est. Revenue Share Range Key Offerings Strategic Positioning
Neste ~8–11% Renewable diesel, SAF (HEFA), renewable feedstock trading Largest pure-play renewable fuels producer; global refinery network
TotalEnergies ~5–8% HVO, SAF, bio-LNG bunkering Integrated major pivoting refining portfolio to renewables
bp ~4–7% Renewable diesel (Cherry Point), SAF partnerships Refinery conversion strategy; AI-enabled process optimization
Shell ~4–6% Biofuels, SAF blending, e-fuel pilot projects Broad portfolio across multiple sustainable fuel pathways
Gevo ~2–4% Alcohol-to-jet SAF, isobutanol Technology-led pure-play targeting net-zero SAF
LanzaTech ~2–3% Gas-fermentation ethanol, CarbonSmart products Waste-gas-to-fuel platform with licensing model
World Energy ~2–4% SAF (Paramount refinery), renewable diesel Largest SAF producer in the Americas
Chevron (REG) ~3–5% Biodiesel, renewable diesel, R&D partnerships Integrated downstream; acquired Renewable Energy Group
Cepsa ~2–3% 2G biofuels, green hydrogen, SAF European refiner pivoting to sustainable feedstocks
Preem ~1–3% HVO, renewable gasoline, lignin-based fuels Nordic renewable fuels leader with Vattenfall green H₂ JV


Recent News & Developments


  • European Commission (March 2024): Finalized implementing rules for ReFuelEU Aviation, specifying SAF blending quotas, reporting mechanisms, and penalty structures effective from January 2025 [1].


  • India Ministry of Petroleum (February 2025): Announced a production-linked incentive scheme of INR 18,000 crore for second-generation ethanol and compressed biogas, supporting the Sustainable Fuel Market expansion in Asia-Pacific [7].
  • bp & C3.ai (April 2025): Reported a 6–8% renewable diesel yield improvement at bp's Cherry Point refinery through AI-driven catalyst and process optimization, demonstrating scalable digital gains in sustainable fuel production [24].


Sustainable Fuel Market Report Scope

Parameter Details
Market Scope Global Sustainable Fuel Market — biodiesel, renewable diesel, SAF, bioethanol, bio-LNG, e-fuels, and other low-carbon fuel pathways
Study Period 2021–2035
CAGR 8.2% (2026–2035)
Market Size – 2025 (Base Year) USD 197.8 Billion
Market Size – 2035 (Forecast) USD 435.2 Billion
Fastest Growing Segments E-fuels (CAGR 18.2%); SAF (CAGR 14.6%); Asia-Pacific (CAGR 10.4%)
Companies Profiled Neste, TotalEnergies, bp, Shell, Gevo, LanzaTech, World Energy, Chevron (REG), Cepsa, Preem
Valuation Currency USD (constant 2025 dollars)


FAQs

How do airline offtake agreements affect pricing for smaller SAF buyers?
Long-term offtake contracts — often 5–10 years in duration — absorb the majority of committed SAF capacity, creating supply scarcity for spot purchasers. Smaller buyers should consider pooled procurement cooperatives to secure allocation [16].
What carbon-intensity certification frameworks should procurement teams prioritize?
RSB and ISCC EU remain the most widely accepted standards under RED III and CORSIA. Selecting a dual-certified supplier simplifies compliance across both aviation and road-transport regulatory regimes [18].
Can existing petroleum pipeline infrastructure transport renewable diesel without modification?
Renewable diesel (HVO) is chemically identical to fossil diesel and fully compatible with existing pipeline, storage, and dispensing infrastructure. No modifications are needed for blends up to B100 [17].
How does the EU Emissions Trading System interact with sustainable fuel credits?
The EU ETS applies to airlines from 2025, creating a carbon-cost incentive to purchase SAF. Verified SAF use allows operators to reduce their surrendered allowances proportionally [14].
What minimum electrolyzer utilization rate makes e-fuel production economically viable?
Industry analyses indicate that electrolyzer capacity factors above 50% — combined with renewable electricity below USD 30/MWh — are necessary to bring synthetic fuel costs under USD 2.50 per litre [13].
Which feedstock pathways qualify for the highest LCFS credit values in California?
Dairy biogas-derived renewable natural gas and cellulosic ethanol from agricultural residues generate the highest per-unit LCFS credits due to their negative or near-zero carbon-intensity scores [8].
How are sustainable fuel producers managing UCO supply-chain fraud risk?
Leading producers deploy mass-balance chain-of-custody systems with third-party audits and blockchain traceability. The EU's updated RED III anti-fraud provisions mandate enhanced documentation for imported UCO [12].    
Author
Author
Author Profile
Priya Nagrale LinkedIn
Senior Research Analyst
With an experience of over five years in market research industry (Chemicals & Materials domain), I gather and analyze market data from diverse sources to produce results, which are then presented back to a client. Also, provide recommendations based on the findings. As a Senior Research Analyst, I perform quality checks (QC) for market estimations, QC for reports, and handle queries and work extensively on client customizations. Also, handle the responsibilities of client proposals, report planning, report finalization, and execution

Research Approach


Secondary Research

The secondary research process involved comprehensive analysis of regulatory databases, energy transition publications, peer-reviewed journals, and authoritative energy organizations. Key sources included the US Department of Energy (DOE), Energy Information Administration (EIA), Environmental Protection Agency (EPA), International Energy Agency (IEA), International Renewable Energy Agency (IRENA), Organization of the Petroleum Exporting Countries (OPEC), European Commission Directorate-General for Energy, European Environment Agency (EEA), National Renewable Energy Laboratory (NREL), International Air Transport Association (IATA), International Maritime Organization (IMO), World Bioenergy Association (WBA), Renewable Fuels Association (RFA), Advanced Biofuels Association (ABFA), Hydrogen Council, International Partnership for Hydrogen and Fuel Cells in the Economy (IPHE), and national energy ministry reports from key markets. These sources were used to collect production capacity statistics, regulatory framework data, carbon intensity studies, feedstock availability trends, and market landscape analysis for biofuels, hydrogen, synthetic fuels, biogas, renewable natural gas, and other sustainable fuel technologies.


Primary Research

In order to gather both qualitative and quantitative insights, supply-side and demand-side stakeholders were interviewed during the primary research process. CEOs, VPs of Technology & Innovation, heads of regulatory affairs, and commercial directors from manufacturers of sustainable fuels, refinery operators, and technology suppliers were examples of supply-side sources. Fleet managers, procurement leaders, sustainability officers, and energy directors from automakers, airlines, shipping firms, industrial manufacturers, power utilities, and oil and gas majors were examples of demand-side suppliers. Primary research obtained information on feedstock sourcing tactics, offtake agreement structures, pricing processes, and regulatory compliance dynamics. It also evaluated market segmentation and production facility schedules.

Primary Respondent Breakdown:

By Designation: C-level Primaries (32%), Director Level (30%), Others (38%)

By Region: North America (32%), Europe (30%), Asia-Pacific (28%), Rest of World (10%)


Market Size Estimation

Global market valuation was derived through production capacity mapping and consumption volume analysis. The methodology included:

Identification of 50+ key producers and technology providers across North America, Europe, Asia-Pacific, Latin America, and Middle East & Africa

Product mapping across biofuels (biodiesel, renewable diesel, ethanol), hydrogen (green, blue, gray), synthetic fuels (e-fuels, power-to-liquid), biogas, and renewable natural gas categories

Analysis of reported and modeled annual revenues specific to sustainable fuel portfolios

Coverage of producers representing 75-80% of global market share in 2024

Extrapolation using bottom-up (production volume × ASP by fuel type and region) and top-down (producer revenue validation) approaches to derive segment-specific valuations, incorporating technology readiness levels, policy incentive impacts, and carbon credit valuations

Download Free Sample

Kindly complete the form below to receive a free sample of this Report

Download PDF ×

We do not share your information with anyone. However, we may send you emails based on your report interest from time to time. You may contact us at any time to opt-out.
















