×
Hero Background
English
Chinese
French
Japanese
Korean
German
Spanish

Tablet PC Market Size

ID: MRFR/ICT/9971-CR
188 Pages
Garvit Vyas
April 2023

Tablet PC Market Research Report Information By Operating System (Android, iOS, and Windows), Distribution Channel (Supermarkets/ Hypermarkets, Independent Retailers, and Online Sales), End-User (Individual User, Corporate User, Schools & Colleges, and Others), and By Region (North America, Europe, Asia-Pacific, Middle East & Africa, and South America) - Forecast till 2035

Share:
Download PDF ×

We do not share your information with anyone. However, we may send you emails based on your report interest from time to time. You may contact us at any time to opt-out.

Tablet PC Market Infographic
Purchase Options

Tablet Pc Size

Tablet PC Market Growth Projections and Opportunities

The global Tablet PC market is experiencing exponential growth, projected to reach USD 97,474.5 million by 2030, driven by a CAGR of 5.7% during the forecast period, 2022-2030. This growth is fuelled by continuous innovation, the rise of hybrid devices, and the acceleration of digitization. Consumer demand is shaping the evolution of tablet designs, with manufacturers introducing lighter tablets, larger screens, improved graphics for gaming and streaming video, and applications for bill payment and device syncing.

Additionally, the development of new gadgets with enticing features is expected to further propel market growth. Government regulations favouring the use of tablets in educational settings and the increasing adoption of hybrid tablets in businesses are opening up new opportunities for tablet PC manufacturers. The corporate sector's rapid expansion, rising demand for hybrid devices, and growing consumer preference for tablets are propelling the market's expansion.

The global Tablet PC market is segmented into Operating System, Distribution Channel, End-User, and Region. Android, iOS, and Windows are the dominant operating systems in the market. Supermarkets/hypermarkets, independent retailers, and online sales are the primary distribution channels. Individual users, corporate users, schools & colleges, and others are the key end-users of tablet PCs.

North America, Europe, Asia-Pacific, Middle East & Africa, and South America are the major regional markets. MRFR's analysis of the global Tablet PC market highlights the significant contributions of major players, including Apple Inc., Samsung Electronics Co. Ltd., Lenovo Group Limited, Microsoft Corporation, and Huawei Technologies Co. Ltd. These companies are constantly innovating their products and services, investing in research and development to deliver cost-effective tablet PCs with cutting-edge features.

Strategic partnerships, mergers & acquisitions, product developments & enhancements, global expansion initiatives, and client base strengthening are key strategies employed by these players to gain a competitive edge. The future of the global Tablet PC market is bright, with the acceleration of digitization, technological advancements, and improving internet connectivity expected to drive further growth. Tablet PCs are poised to play an increasingly prominent role in various aspects of life, from personal entertainment and education to business productivity and healthcare monitoring.
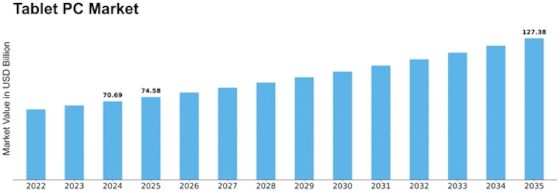
Tablet PC Market Size Graph
Author
Garvit Vyas
Analyst

Explore the profile of Garvit Vyas, one of our esteemed authors at Market Research Future, and access their expert research contributions in the field of market research and industry analysis

Leave a Comment

FAQs

What is the projected market valuation of the Tablet PC Market by 2035?

The Tablet PC Market is projected to reach a valuation of 127.38 USD Billion by 2035.

What was the market valuation of the Tablet PC Market in 2024?

In 2024, the overall market valuation was 70.69 USD Billion.

What is the expected CAGR for the Tablet PC Market from 2025 to 2035?

The expected CAGR for the Tablet PC Market during the forecast period 2025 - 2035 is 5.5%.

Which operating system segment is expected to generate the highest revenue in the Tablet PC Market?

The iOS segment is anticipated to generate the highest revenue, with projections ranging from 30.0 to 50.0 USD Billion.

How do online sales compare to other distribution channels in the Tablet PC Market?

Online sales are projected to generate between 35.0 and 66.0 USD Billion, surpassing other distribution channels.

Market Summary

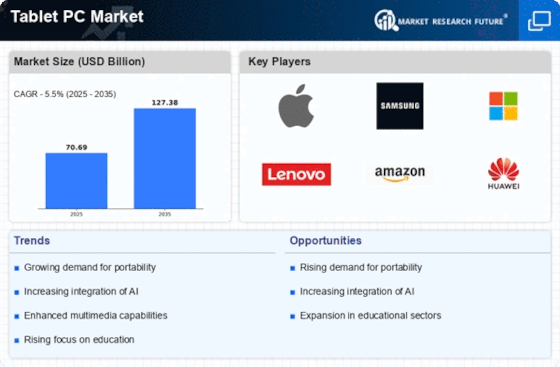
As per MRFR analysis, the Tablet PC Market Size was estimated at 70.69 USD Billion in 2024. The Tablet PC industry is projected to grow from 74.57 USD Billion in 2025 to 127.38 USD Billion by 2035, exhibiting a compound annual growth rate (CAGR) of 5.5 during the forecast period 2025 - 2035.

Key Market Trends & Highlights

The Tablet PC Market is experiencing a dynamic shift towards versatile and technologically advanced devices.

  • The demand for versatile devices continues to rise, driven by consumer preferences for multifunctionality. Integration of advanced technologies, such as 5G, is reshaping the capabilities of tablet PCs. North America remains the largest market, while Asia-Pacific is recognized as the fastest-growing region in this sector. The growing educational sector demand and advancements in battery technology are key drivers propelling market growth.

Market Size & Forecast

2024 Market Size 70.69 (USD Billion)
2035 Market Size 127.38 (USD Billion)
CAGR (2025 - 2035) 5.5%
Largest Regional Market Share in 2024 North America

Major Players

<p>Apple (US), <a href="https://gs.statcounter.com/vendor-market-share/tablet/worldwide">Samsung</a> (KR), Microsoft (US), Lenovo (CN), Amazon (US), Huawei (CN), Asus (TW), Dell (US), Xiaomi (CN)</p>

Market Trends

The Tablet PC Market is currently experiencing a dynamic evolution, characterized by rapid technological advancements and shifting consumer preferences. As users increasingly seek versatile devices that blend the functionality of laptops and smartphones, manufacturers are responding with innovative designs and enhanced features. This market appears to be driven by a growing demand for portability, performance, and user-friendly interfaces, which are becoming essential in both personal and professional settings. Furthermore, the integration of advanced technologies such as artificial intelligence and augmented reality is likely to redefine user experiences, making Tablet PCs more appealing to a broader audience. In addition, the rise of remote work and digital learning has further propelled the Tablet PC Market, as these devices offer convenient solutions for various tasks. The emphasis on connectivity and cloud-based applications suggests that consumers are looking for devices that can seamlessly integrate into their digital ecosystems. As the market continues to evolve, it may witness increased competition among established brands and emerging players, each striving to capture the attention of tech-savvy consumers. Overall, the Tablet PC Market is poised for continued growth, driven by innovation and changing user needs.

Increased Demand for Versatile Devices

Consumers are gravitating towards Tablet PCs that offer multifunctionality, combining the capabilities of traditional laptops and smartphones. This trend indicates a preference for devices that can adapt to various tasks, from work to entertainment.

Integration of Advanced Technologies

The incorporation of technologies such as artificial intelligence and augmented reality is becoming more prevalent in Tablet PCs. This trend suggests that manufacturers are focusing on enhancing user experiences through innovative features.

Focus on Connectivity and Cloud Solutions

As remote work and digital learning become more common, there is a growing emphasis on connectivity and cloud-based applications in Tablet PCs. This trend indicates that users are seeking devices that facilitate seamless integration into their digital environments.

Tablet PC Market Market Drivers

Emergence of 5G Technology

The Tablet PC Market is on the brink of transformation with the emergence of 5G technology. The rollout of 5G networks is expected to enhance connectivity and data transfer speeds, making tablets even more versatile for users. With faster internet access, consumers can enjoy seamless streaming, gaming, and productivity applications. This technological advancement is likely to attract a broader audience, including professionals and gamers who require high-speed connectivity. As 5G becomes more widely available, the Tablet PC Market may experience a significant uptick in demand, as users seek devices that can leverage these enhanced capabilities for both work and leisure.

Growing Educational Sector Demand

The Tablet PC Market is significantly influenced by the growing demand within the educational sector. Educational institutions are increasingly integrating tablets into their curricula to enhance learning experiences. Tablets provide interactive and engaging platforms for students, facilitating access to a wealth of educational resources. Recent statistics suggest that the education segment of the tablet market is expected to witness a growth rate of around 8% annually. This growth is driven by the need for digital learning tools that cater to diverse learning styles. As schools and universities invest in technology to support remote and hybrid learning models, the Tablet PC Market stands to gain from this trend, positioning tablets as essential tools for modern education.

Advancements in Battery Technology

The Tablet PC Market is poised for growth due to advancements in battery technology. Innovations in battery efficiency and longevity are enhancing the usability of tablets, making them more appealing to consumers. With longer battery life, users can engage in extended periods of work or entertainment without the constant need for recharging. This improvement is particularly relevant in a market where portability is a key selling point. As manufacturers continue to invest in research and development, the Tablet PC Market is likely to see an influx of devices that offer superior battery performance. This could potentially lead to increased consumer satisfaction and, consequently, higher sales figures in the coming years.

Rising Adoption of Remote Work Solutions

The Tablet PC Market is experiencing a notable surge in demand due to the increasing adoption of remote work solutions. As organizations continue to embrace flexible work arrangements, the need for portable and efficient devices has become paramount. Tablets offer a unique blend of functionality and mobility, allowing users to perform tasks seamlessly from various locations. According to recent data, the tablet segment is projected to grow at a compound annual growth rate of approximately 6.5% over the next five years. This trend indicates a shift in consumer preferences towards devices that facilitate productivity while on the go. Consequently, the Tablet PC Market is likely to benefit from this evolving work culture, as more professionals seek devices that can adapt to their dynamic work environments.

Increased Focus on Health and Wellness Applications

The Tablet PC Market is witnessing a growing focus on health and wellness applications, which is driving demand for tablets. As consumers become more health-conscious, there is an increasing interest in devices that can support fitness tracking, telehealth consultations, and wellness management. Tablets, with their larger screens and user-friendly interfaces, are well-suited for these applications. Recent market analysis indicates that the health and wellness segment is expected to grow by approximately 7% annually. This trend suggests that as more individuals seek to monitor their health and engage with wellness programs, the Tablet PC Market will likely benefit from the integration of health-focused applications and services.

Market Segment Insights

By Operating System: Android (Largest) vs. iOS (Fastest-Growing)

<p>The Tablet PC Market exhibits a diverse landscape dominated by Android, which holds the largest market share. Android's open-source platform allows various manufacturers to adopt the OS, making it widely available across different device price points. This accessibility contributes significantly to its extensive reach and user base compared to other operating systems. iOS, on the other hand, while not as broadly adopted, ranks as the fastest-growing operating system in the segment. Apple's controlled ecosystem ensures seamless integration across devices, appealing particularly to consumers seeking a premium experience. Growth trends indicate that Android's market presence is fortified by a range of affordable devices appealing to emerging markets, while iOS is leveraging its robust brand loyalty and product ecosystem to draw more users. Windows, although present, is considered a smaller player in the tablet segment. As consumer preferences shift towards hybrid devices that blend the functionalities of tablets and laptops, the operating systems continue to evolve, catering to demands for enhanced performance and usability. Market drivers include increasing educational deployments, consumer reliance on mobile computing, and advancements in app ecosystems for each operating system.</p>

<p>Operating Systems: Android (Dominant) vs. iOS (Emerging)</p>

<p>Android remains the dominant force in the Tablet PC Market due to its wide compatibility with various hardware configurations, enabling manufacturers to produce a diverse range of devices catering to different demographics and price segments. This flexibility allows Android to thrive in regions with varying purchasing power. In contrast, iOS is classified as an emerging player in the tablet space, characterized by a premium segment focus. Apple's tablets are synonymous with high-quality build and impressive user experience, fostering brand loyalty. This loyalty, combined with iOS's continuous innovation in app development and cross-device integration, positions it as an increasingly significant player in a market that values both performance and usability.</p>

By Distribution Channel: Online Sales (Largest) vs. Supermarkets/Hypermarkets (Fastest-Growing)

<p>In the Tablet PC Market, online sales have emerged as the largest distribution channel, dominating the market due to the convenience and variety they offer. Traditional channels such as supermarkets and hypermarkets follow closely behind, yet they are increasingly adapting their strategies to engage tech-savvy consumers and provide competitive prices. Independent retailers occupy a smaller, yet significant portion of the market, appealing to niche customer segments that seek personalized services and expert advice. Looking ahead, online sales are expected to continue their upward trajectory, driven by the rising trend of <a href="https://www.marketresearchfuture.com/reports/e-commerce-market-18845">e-commerce</a> and the increasing reliance on digital platforms for purchasing. The COVID-19 pandemic has accelerated this trend, forcing consumers to embrace online shopping, while supermarkets and hypermarkets are implementing innovative strategies like click-and-collect services to attract more buyers. Independent retailers are focusing on enhanced customer experiences and curated product selections to stay relevant in a competitive landscape.</p>

<p>Online Sales (Dominant) vs. Supermarkets/Hypermarkets (Emerging)</p>

<p>Online sales represent the dominant distribution channel in the Tablet PC Market, leveraging technology to reach consumers effectively. With robust infrastructure and marketing strategies, online platforms offer a wide range of products, competitive pricing, and customer reviews, making them a preferred choice for many tablet buyers. Supermarkets and hypermarkets, though traditionally strong players, are emerging in this rapidly changing market, utilizing their physical presence to boost online sales through integrated omnichannel experiences. This evolution signifies an important shift toward fulfilling the demands of consumers who seek convenience and flexibility, thereby enhancing their shopping experiences. Independent retailers, while smaller in market share, focus on differentiation by offering personalized service and expertise, appealing particularly to consumers who value tailored recommendations.</p>

By End-User: Individual User (Largest) vs. Corporate User (Fastest-Growing)

<p>In the Tablet PC Market, the distribution of market share reveals that Individual Users account for the largest portion, reflecting the popularity of tablets for personal use, entertainment, and casual browsing. Following closely, Corporate Users have surged as businesses recognize the productivity benefits of tablets. Schools and Colleges also contribute significantly to the market, as educational institutions increasingly adopt tablets for digital learning. Other segments encompass diverse applications, but they represent a smaller share compared to the aforementioned groups.</p>

<p>Individual Users (Dominant) vs. Corporate Users (Emerging)</p>

<p>The Individual User segment remains dominant in the Tablet PC Market, characterized by a broad spectrum of use cases from leisure to productivity. This segment thrives on trends favoring mobility and convenience, with users demanding versatile devices for tasks ranging from e-reading to gaming. Conversely, Corporate Users represent the emerging segment, driven by the digital transformation of workplaces and the trend towards remote working. Tablets are increasingly favored for their portability and integration with business applications, enabling efficient workflows and access to information on-the-go. As corporations invest in technology for employee productivity, tablets are expected to see enhanced growth in this sector.</p>

Get more detailed insights about Tablet PC Market Research Report - Global Forecast till 2035

Regional Insights

By Region, the study segments the market into North America, Europe, Asia-Pacific, Middle East & Africa, and South America. North America holds a largest market share in the global market.

The North America consists of the U.S., Canada, and Mexico. The demand for tablet computers in North America has recently been increasing quickly. Unprecedented demand for better hardware technologies is a key factor in the development and maturation of the market. The usage of tablet PCs is not limited to a certain age group, and the demand for them is diverse, which has fueled the market expansion. Among the key growth-promoting factors for the tablet PC market are the region's rising smart device penetration and trends in online learning.

Moreover, the growing customer base for consumer electronics and clever gadgets drives the industry's overall growth for Tablets PC. 

Demand in North America is being boosted by parental control, connection, and other technological developments constantly being made available. The region's expanding adoption of the newest technical innovations also benefits the local economy. For instance, the American government passed the Bipartisan Infrastructure Law, an Infrastructure Investment & Jobs Act, in November 2021. To guarantee that the American people have access to dependable high-speed internet, the government has allotted close to USD 65 billion under this act. The strong demand for cloud-based e-learning results from businesses like IBM Corporation, Amazon Web Services, and Microsoft Corporation in the cloud computing market.

Figure 5: Tablet Pc Market Share By End Users, 2022 Vs 2030 (USD Billion)

TABLET PC MARKET SHARE BY END USERS, 2022 VS 2030

Source: Secondary Research, Primary Research, Market Research Future Database and Analyst Review

Key Players and Competitive Insights

The tablet PC market has witnessed significant growth over the forecast period due to increasing popularity of the laptops and tablets owing to their smaller sizes and less weight.There are several domestic, regional, and global players operating in the tablet PC market who continuously strive to gain a significant share of the overall market. 

During the study, MRFR has analyzed some of the major players in the Tablet PC Market who have contributed to the market growth. These include Acer Inc, Apple Inc, Hewlett-Packard Company, Huawei Technologies, Lenovo Group, LG Electronics Inc, Microsoft Corporation, Nokia Corporation, Samsung Electronics Co Ltd, Realme, Xiaomi, Amazon, Fujitsu Ltd, CHUWI, Dynabook. Among these, Apple Inc, Huawei Technologies , Lenovo Group, Samsung Electronics Co Ltd, and Amazon are among the top 5 players in Tablet PC Market. 

These players focus on expanding and enhancing their product portfolio and services to remain competitive and increase their customer base. Additionally, these players are focusing on partnerships & collaborations to expand their business and customer base to enhance their market position.

October 2022 Apple unveiled the all-screen new iPad , with a huge 10.9-inch Liquid Retina display. The A14 Bionic chip, which powers the new iPad, provides even quicker performance with exceptional power efficiency for demanding workloads while maintaining all-day battery life. 1 Updated camera includes a 12MP back camera with 4K video recording capabilities and an Ultra Wide 12MP front camera situated along the iPad's edge in landscape orientation. A USB-C port supports wide-ranging accessories, Wi-Fi 6 provides even quicker connectivity, and cellular variants have ultrafast 5G so users can stay connected while on the road.

November 2022 HP, the Chromebook x2 11 has introduced a new 2-in-1 tablet running Chrome OS. Although there are currently numerous Chrome OS tablets, the Chromebook x2 11 is the first to enable 4G LTE. The tablet also features an 11-inch display with a 3:2 aspect ratio and a resolution of 2,160 x 1,440 pixels.

Key Companies in the Tablet PC Market market include

Industry Developments

October 2022 With significant upgrades to Mail, iCloud Shared Photo Library, passkeys, and new collaboration tools in Safari, the Weather app, pro features like Reference Mode and Display Zoom, and a new multitasking experience with Stage Manager, iPadOS 16 expands on the flexibility of the iPad. As of right now, iPadOS 16 is a cost-free software update.

June 2022 Apple previewed a significant update that expands the functionality of the iPad experience. Stage Manager introduces a unique multitasking method with numerous overlapping windows and complete external display compatibility by utilizing the capability of the M1 chip. With new ways to start collaborating with others in apps throughout the system using Messages, collaboration is simpler than ever. In addition, the new Freeform app offers a flexible canvas for group brainstorming.

Future Outlook

Tablet PC Market Future Outlook

<p>The Tablet PC Market is projected to grow at a 5.5% CAGR from 2024 to 2035, driven by advancements in technology, increasing demand for portable devices, and enhanced user experiences.</p>

New opportunities lie in:

  • <p>Development of specialized educational tablet solutions for remote learning environments.</p><p>Integration of AI-driven applications to enhance user productivity and engagement.</p><p>Expansion into emerging markets with affordable, feature-rich tablet offerings.</p>

<p>By 2035, the Tablet PC Market is expected to achieve robust growth, solidifying its position in the global technology landscape.</p>

Market Segmentation

Tablet PC Market End-User Outlook

  • Individual User
  • Corporate User
  • Schools & Colleges
  • Others

Tablet PC Market Operating System Outlook

  • Android
  • iOS
  • Windows

Tablet PC Market Distribution Channel Outlook

  • Supermarkets/ Hypermarkets
  • Independent Retailers
  • Online Sales

Report Scope

MARKET SIZE 202470.69(USD Billion)
MARKET SIZE 202574.57(USD Billion)
MARKET SIZE 2035127.38(USD Billion)
COMPOUND ANNUAL GROWTH RATE (CAGR)5.5% (2024 - 2035)
REPORT COVERAGERevenue Forecast, Competitive Landscape, Growth Factors, and Trends
BASE YEAR2024
Market Forecast Period2025 - 2035
Historical Data2019 - 2024
Market Forecast UnitsUSD Billion
Key Companies ProfiledMarket analysis in progress
Segments CoveredMarket segmentation analysis in progress
Key Market OpportunitiesIntegration of advanced artificial intelligence features enhances user experience in the Tablet PC Market.
Key Market DynamicsRising consumer demand for versatile devices drives innovation and competition in the Tablet PC market.
Countries CoveredNorth America, Europe, APAC, South America, MEA

FAQs

What is the projected market valuation of the Tablet PC Market by 2035?

The Tablet PC Market is projected to reach a valuation of 127.38 USD Billion by 2035.

What was the market valuation of the Tablet PC Market in 2024?

In 2024, the overall market valuation was 70.69 USD Billion.

What is the expected CAGR for the Tablet PC Market from 2025 to 2035?

The expected CAGR for the Tablet PC Market during the forecast period 2025 - 2035 is 5.5%.

Which operating system segment is expected to generate the highest revenue in the Tablet PC Market?

The iOS segment is anticipated to generate the highest revenue, with projections ranging from 30.0 to 50.0 USD Billion.

How do online sales compare to other distribution channels in the Tablet PC Market?

Online sales are projected to generate between 35.0 and 66.0 USD Billion, surpassing other distribution channels.

  1. SECTION I: EXECUTIVE SUMMARY AND KEY HIGHLIGHTS
    1. EXECUTIVE SUMMARY
      1. Market Overview
      2. Key Findings
      3. Market Segmentation
      4. Competitive Landscape
      5. Challenges and Opportunities
      6. Future Outlook 2
  2. SECTION II: SCOPING, METHODOLOGY AND MARKET STRUCTURE
    1. MARKET INTRODUCTION
      1. Definition
      2. Scope of the study
    2. RESEARCH METHODOLOGY
      1. Overview
      2. Data Mining
      3. Secondary Research
      4. Primary Research
      5. Forecasting Model
      6. Market Size Estimation
      7. Data Triangulation
      8. Validation 3
  3. SECTION III: QUALITATIVE ANALYSIS
    1. MARKET DYNAMICS
      1. Overview
      2. Drivers
      3. Restraints
      4. Opportunities
    2. MARKET FACTOR ANALYSIS
      1. Value chain Analysis
      2. Porter's Five Forces Analysis
      3. COVID-19 Impact Analysis
  4. SECTION IV: QUANTITATIVE ANALYSIS
    1. Information and Communications Technology, BY Operating System (USD Billion)
      1. Android
      2. iOS
      3. Windows
    2. Information and Communications Technology, BY Distribution Channel (USD Billion)
      1. Supermarkets/ Hypermarkets
      2. Independent Retailers
      3. Online Sales
    3. Information and Communications Technology, BY End-User (USD Billion)
      1. Individual User
      2. Corporate User
      3. Schools & Colleges
      4. Others
    4. Information and Communications Technology, BY Region (USD Billion)
      1. North America
      2. Europe
      3. APAC
      4. South America
      5. MEA
  5. SECTION V: COMPETITIVE ANALYSIS
    1. Competitive Landscape
      1. Overview
      2. Competitive Analysis
      3. Market share Analysis
      4. Major Growth Strategy in the Information and Communications Technology
      5. Competitive Benchmarking
      6. Leading Players in Terms of Number of Developments in the Information and Communications Technology
      7. Key developments and growth strategies
      8. Major Players Financial Matrix
    2. Company Profiles
      1. Apple (US)
      2. Samsung (KR)
      3. Microsoft (US)
      4. Lenovo (CN)
      5. Amazon (US)
      6. Huawei (CN)
      7. Asus (TW)
      8. Dell (US)
      9. Xiaomi (CN)
    3. Appendix
      1. References
      2. Related Reports 6 LIST OF FIGURES
    4. MARKET SYNOPSIS
    5. NORTH AMERICA MARKET ANALYSIS
    6. US MARKET ANALYSIS BY OPERATING SYSTEM
    7. US MARKET ANALYSIS BY DISTRIBUTION CHANNEL
    8. US MARKET ANALYSIS BY END-USER
    9. CANADA MARKET ANALYSIS BY OPERATING SYSTEM
    10. CANADA MARKET ANALYSIS BY DISTRIBUTION CHANNEL
    11. CANADA MARKET ANALYSIS BY END-USER
    12. EUROPE MARKET ANALYSIS
    13. GERMANY MARKET ANALYSIS BY OPERATING SYSTEM
    14. GERMANY MARKET ANALYSIS BY DISTRIBUTION CHANNEL
    15. GERMANY MARKET ANALYSIS BY END-USER
    16. UK MARKET ANALYSIS BY OPERATING SYSTEM
    17. UK MARKET ANALYSIS BY DISTRIBUTION CHANNEL
    18. UK MARKET ANALYSIS BY END-USER
    19. FRANCE MARKET ANALYSIS BY OPERATING SYSTEM
    20. FRANCE MARKET ANALYSIS BY DISTRIBUTION CHANNEL
    21. FRANCE MARKET ANALYSIS BY END-USER
    22. RUSSIA MARKET ANALYSIS BY OPERATING SYSTEM
    23. RUSSIA MARKET ANALYSIS BY DISTRIBUTION CHANNEL
    24. RUSSIA MARKET ANALYSIS BY END-USER
    25. ITALY MARKET ANALYSIS BY OPERATING SYSTEM
    26. ITALY MARKET ANALYSIS BY DISTRIBUTION CHANNEL
    27. ITALY MARKET ANALYSIS BY END-USER
    28. SPAIN MARKET ANALYSIS BY OPERATING SYSTEM
    29. SPAIN MARKET ANALYSIS BY DISTRIBUTION CHANNEL
    30. SPAIN MARKET ANALYSIS BY END-USER
    31. REST OF EUROPE MARKET ANALYSIS BY OPERATING SYSTEM
    32. REST OF EUROPE MARKET ANALYSIS BY DISTRIBUTION CHANNEL
    33. REST OF EUROPE MARKET ANALYSIS BY END-USER
    34. APAC MARKET ANALYSIS
    35. CHINA MARKET ANALYSIS BY OPERATING SYSTEM
    36. CHINA MARKET ANALYSIS BY DISTRIBUTION CHANNEL
    37. CHINA MARKET ANALYSIS BY END-USER
    38. INDIA MARKET ANALYSIS BY OPERATING SYSTEM
    39. INDIA MARKET ANALYSIS BY DISTRIBUTION CHANNEL
    40. INDIA MARKET ANALYSIS BY END-USER
    41. JAPAN MARKET ANALYSIS BY OPERATING SYSTEM
    42. JAPAN MARKET ANALYSIS BY DISTRIBUTION CHANNEL
    43. JAPAN MARKET ANALYSIS BY END-USER
    44. SOUTH KOREA MARKET ANALYSIS BY OPERATING SYSTEM
    45. SOUTH KOREA MARKET ANALYSIS BY DISTRIBUTION CHANNEL
    46. SOUTH KOREA MARKET ANALYSIS BY END-USER
    47. MALAYSIA MARKET ANALYSIS BY OPERATING SYSTEM
    48. MALAYSIA MARKET ANALYSIS BY DISTRIBUTION CHANNEL
    49. MALAYSIA MARKET ANALYSIS BY END-USER
    50. THAILAND MARKET ANALYSIS BY OPERATING SYSTEM
    51. THAILAND MARKET ANALYSIS BY DISTRIBUTION CHANNEL
    52. THAILAND MARKET ANALYSIS BY END-USER
    53. INDONESIA MARKET ANALYSIS BY OPERATING SYSTEM
    54. INDONESIA MARKET ANALYSIS BY DISTRIBUTION CHANNEL
    55. INDONESIA MARKET ANALYSIS BY END-USER
    56. REST OF APAC MARKET ANALYSIS BY OPERATING SYSTEM
    57. REST OF APAC MARKET ANALYSIS BY DISTRIBUTION CHANNEL
    58. REST OF APAC MARKET ANALYSIS BY END-USER
    59. SOUTH AMERICA MARKET ANALYSIS
    60. BRAZIL MARKET ANALYSIS BY OPERATING SYSTEM
    61. BRAZIL MARKET ANALYSIS BY DISTRIBUTION CHANNEL
    62. BRAZIL MARKET ANALYSIS BY END-USER
    63. MEXICO MARKET ANALYSIS BY OPERATING SYSTEM
    64. MEXICO MARKET ANALYSIS BY DISTRIBUTION CHANNEL
    65. MEXICO MARKET ANALYSIS BY END-USER
    66. ARGENTINA MARKET ANALYSIS BY OPERATING SYSTEM
    67. ARGENTINA MARKET ANALYSIS BY DISTRIBUTION CHANNEL
    68. ARGENTINA MARKET ANALYSIS BY END-USER
    69. REST OF SOUTH AMERICA MARKET ANALYSIS BY OPERATING SYSTEM
    70. REST OF SOUTH AMERICA MARKET ANALYSIS BY DISTRIBUTION CHANNEL
    71. REST OF SOUTH AMERICA MARKET ANALYSIS BY END-USER
    72. MEA MARKET ANALYSIS
    73. GCC COUNTRIES MARKET ANALYSIS BY OPERATING SYSTEM
    74. GCC COUNTRIES MARKET ANALYSIS BY DISTRIBUTION CHANNEL
    75. GCC COUNTRIES MARKET ANALYSIS BY END-USER
    76. SOUTH AFRICA MARKET ANALYSIS BY OPERATING SYSTEM
    77. SOUTH AFRICA MARKET ANALYSIS BY DISTRIBUTION CHANNEL
    78. SOUTH AFRICA MARKET ANALYSIS BY END-USER
    79. REST OF MEA MARKET ANALYSIS BY OPERATING SYSTEM
    80. REST OF MEA MARKET ANALYSIS BY DISTRIBUTION CHANNEL
    81. REST OF MEA MARKET ANALYSIS BY END-USER
    82. KEY BUYING CRITERIA OF INFORMATION AND COMMUNICATIONS TECHNOLOGY
    83. RESEARCH PROCESS OF MRFR
    84. DRO ANALYSIS OF INFORMATION AND COMMUNICATIONS TECHNOLOGY
    85. DRIVERS IMPACT ANALYSIS: INFORMATION AND COMMUNICATIONS TECHNOLOGY
    86. RESTRAINTS IMPACT ANALYSIS: INFORMATION AND COMMUNICATIONS TECHNOLOGY
    87. SUPPLY / VALUE CHAIN: INFORMATION AND COMMUNICATIONS TECHNOLOGY
    88. INFORMATION AND COMMUNICATIONS TECHNOLOGY, BY OPERATING SYSTEM, 2024 (% SHARE)
    89. INFORMATION AND COMMUNICATIONS TECHNOLOGY, BY OPERATING SYSTEM, 2024 TO 2035 (USD Billion)
    90. INFORMATION AND COMMUNICATIONS TECHNOLOGY, BY DISTRIBUTION CHANNEL, 2024 (% SHARE)
    91. INFORMATION AND COMMUNICATIONS TECHNOLOGY, BY DISTRIBUTION CHANNEL, 2024 TO 2035 (USD Billion)
    92. INFORMATION AND COMMUNICATIONS TECHNOLOGY, BY END-USER, 2024 (% SHARE)
    93. INFORMATION AND COMMUNICATIONS TECHNOLOGY, BY END-USER, 2024 TO 2035 (USD Billion)
    94. BENCHMARKING OF MAJOR COMPETITORS 7 LIST OF TABLES
    95. LIST OF ASSUMPTIONS
    96. North America MARKET SIZE ESTIMATES; FORECAST
      1. BY OPERATING SYSTEM, 2025-2035 (USD Billion)
      2. BY DISTRIBUTION CHANNEL, 2025-2035 (USD Billion)
      3. BY END-USER, 2025-2035 (USD Billion)
    97. US MARKET SIZE ESTIMATES; FORECAST
      1. BY OPERATING SYSTEM, 2025-2035 (USD Billion)
      2. BY DISTRIBUTION CHANNEL, 2025-2035 (USD Billion)
      3. BY END-USER, 2025-2035 (USD Billion)
    98. Canada MARKET SIZE ESTIMATES; FORECAST
      1. BY OPERATING SYSTEM, 2025-2035 (USD Billion)
      2. BY DISTRIBUTION CHANNEL, 2025-2035 (USD Billion)
      3. BY END-USER, 2025-2035 (USD Billion)
    99. Europe MARKET SIZE ESTIMATES; FORECAST
      1. BY OPERATING SYSTEM, 2025-2035 (USD Billion)
      2. BY DISTRIBUTION CHANNEL, 2025-2035 (USD Billion)
      3. BY END-USER, 2025-2035 (USD Billion)
    100. Germany MARKET SIZE ESTIMATES; FORECAST
      1. BY OPERATING SYSTEM, 2025-2035 (USD Billion)
      2. BY DISTRIBUTION CHANNEL, 2025-2035 (USD Billion)
      3. BY END-USER, 2025-2035 (USD Billion)
    101. UK MARKET SIZE ESTIMATES; FORECAST
      1. BY OPERATING SYSTEM, 2025-2035 (USD Billion)
      2. BY DISTRIBUTION CHANNEL, 2025-2035 (USD Billion)
      3. BY END-USER, 2025-2035 (USD Billion)
    102. France MARKET SIZE ESTIMATES; FORECAST
      1. BY OPERATING SYSTEM, 2025-2035 (USD Billion)
      2. BY DISTRIBUTION CHANNEL, 2025-2035 (USD Billion)
      3. BY END-USER, 2025-2035 (USD Billion)
    103. Russia MARKET SIZE ESTIMATES; FORECAST
      1. BY OPERATING SYSTEM, 2025-2035 (USD Billion)
      2. BY DISTRIBUTION CHANNEL, 2025-2035 (USD Billion)
      3. BY END-USER, 2025-2035 (USD Billion)
    104. Italy MARKET SIZE ESTIMATES; FORECAST
      1. BY OPERATING SYSTEM, 2025-2035 (USD Billion)
      2. BY DISTRIBUTION CHANNEL, 2025-2035 (USD Billion)
      3. BY END-USER, 2025-2035 (USD Billion)
    105. Spain MARKET SIZE ESTIMATES; FORECAST
      1. BY OPERATING SYSTEM, 2025-2035 (USD Billion)
      2. BY DISTRIBUTION CHANNEL, 2025-2035 (USD Billion)
      3. BY END-USER, 2025-2035 (USD Billion)
    106. Rest of Europe MARKET SIZE ESTIMATES; FORECAST
      1. BY OPERATING SYSTEM, 2025-2035 (USD Billion)
      2. BY DISTRIBUTION CHANNEL, 2025-2035 (USD Billion)
      3. BY END-USER, 2025-2035 (USD Billion)
    107. APAC MARKET SIZE ESTIMATES; FORECAST
      1. BY OPERATING SYSTEM, 2025-2035 (USD Billion)
      2. BY DISTRIBUTION CHANNEL, 2025-2035 (USD Billion)
      3. BY END-USER, 2025-2035 (USD Billion)
    108. China MARKET SIZE ESTIMATES; FORECAST
      1. BY OPERATING SYSTEM, 2025-2035 (USD Billion)
      2. BY DISTRIBUTION CHANNEL, 2025-2035 (USD Billion)
      3. BY END-USER, 2025-2035 (USD Billion)
    109. India MARKET SIZE ESTIMATES; FORECAST
      1. BY OPERATING SYSTEM, 2025-2035 (USD Billion)
      2. BY DISTRIBUTION CHANNEL, 2025-2035 (USD Billion)
      3. BY END-USER, 2025-2035 (USD Billion)
    110. Japan MARKET SIZE ESTIMATES; FORECAST
      1. BY OPERATING SYSTEM, 2025-2035 (USD Billion)
      2. BY DISTRIBUTION CHANNEL, 2025-2035 (USD Billion)
      3. BY END-USER, 2025-2035 (USD Billion)
    111. South Korea MARKET SIZE ESTIMATES; FORECAST
      1. BY OPERATING SYSTEM, 2025-2035 (USD Billion)
      2. BY DISTRIBUTION CHANNEL, 2025-2035 (USD Billion)
      3. BY END-USER, 2025-2035 (USD Billion)
    112. Malaysia MARKET SIZE ESTIMATES; FORECAST
      1. BY OPERATING SYSTEM, 2025-2035 (USD Billion)
      2. BY DISTRIBUTION CHANNEL, 2025-2035 (USD Billion)
      3. BY END-USER, 2025-2035 (USD Billion)
    113. Thailand MARKET SIZE ESTIMATES; FORECAST
      1. BY OPERATING SYSTEM, 2025-2035 (USD Billion)
      2. BY DISTRIBUTION CHANNEL, 2025-2035 (USD Billion)
      3. BY END-USER, 2025-2035 (USD Billion)
    114. Indonesia MARKET SIZE ESTIMATES; FORECAST
      1. BY OPERATING SYSTEM, 2025-2035 (USD Billion)
      2. BY DISTRIBUTION CHANNEL, 2025-2035 (USD Billion)
      3. BY END-USER, 2025-2035 (USD Billion)
    115. Rest of APAC MARKET SIZE ESTIMATES; FORECAST
      1. BY OPERATING SYSTEM, 2025-2035 (USD Billion)
      2. BY DISTRIBUTION CHANNEL, 2025-2035 (USD Billion)
      3. BY END-USER, 2025-2035 (USD Billion)
    116. South America MARKET SIZE ESTIMATES; FORECAST
      1. BY OPERATING SYSTEM, 2025-2035 (USD Billion)
      2. BY DISTRIBUTION CHANNEL, 2025-2035 (USD Billion)
      3. BY END-USER, 2025-2035 (USD Billion)
    117. Brazil MARKET SIZE ESTIMATES; FORECAST
      1. BY OPERATING SYSTEM, 2025-2035 (USD Billion)
      2. BY DISTRIBUTION CHANNEL, 2025-2035 (USD Billion)
      3. BY END-USER, 2025-2035 (USD Billion)
    118. Mexico MARKET SIZE ESTIMATES; FORECAST
      1. BY OPERATING SYSTEM, 2025-2035 (USD Billion)
      2. BY DISTRIBUTION CHANNEL, 2025-2035 (USD Billion)
      3. BY END-USER, 2025-2035 (USD Billion)
    119. Argentina MARKET SIZE ESTIMATES; FORECAST
      1. BY OPERATING SYSTEM, 2025-2035 (USD Billion)
      2. BY DISTRIBUTION CHANNEL, 2025-2035 (USD Billion)
      3. BY END-USER, 2025-2035 (USD Billion)
    120. Rest of South America MARKET SIZE ESTIMATES; FORECAST
      1. BY OPERATING SYSTEM, 2025-2035 (USD Billion)
      2. BY DISTRIBUTION CHANNEL, 2025-2035 (USD Billion)
      3. BY END-USER, 2025-2035 (USD Billion)
    121. MEA MARKET SIZE ESTIMATES; FORECAST
      1. BY OPERATING SYSTEM, 2025-2035 (USD Billion)
      2. BY DISTRIBUTION CHANNEL, 2025-2035 (USD Billion)
      3. BY END-USER, 2025-2035 (USD Billion)
    122. GCC Countries MARKET SIZE ESTIMATES; FORECAST
      1. BY OPERATING SYSTEM, 2025-2035 (USD Billion)
      2. BY DISTRIBUTION CHANNEL, 2025-2035 (USD Billion)
      3. BY END-USER, 2025-2035 (USD Billion)
    123. South Africa MARKET SIZE ESTIMATES; FORECAST
      1. BY OPERATING SYSTEM, 2025-2035 (USD Billion)
      2. BY DISTRIBUTION CHANNEL, 2025-2035 (USD Billion)
      3. BY END-USER, 2025-2035 (USD Billion)
    124. Rest of MEA MARKET SIZE ESTIMATES; FORECAST
      1. BY OPERATING SYSTEM, 2025-2035 (USD Billion)
      2. BY DISTRIBUTION CHANNEL, 2025-2035 (USD Billion)
      3. BY END-USER, 2025-2035 (USD Billion)
    125. PRODUCT LAUNCH/PRODUCT DEVELOPMENT/APPROVAL
    126. ACQUISITION/PARTNERSHIP

Tablet PC  Market Segmentation

Global Tablet PC, By Operating System Outlook (USD Million, 2018-2030)

  • Android
  • IOS
  • Windows

Global Tablet PC, By Distribution Channel (USD Million, 2018-2030)

  • Supermarkets/ Hypermarkets
  • Independent Retailers
  • Online Sales

Global Tablet PC, By End-User (USD Million, 2018-2030)

  • Individual User
  • Corporate User
  • School & Colleges
  • Others

Global Tablet PC Regional Outlook (USD Million, 2018-2030)

  • North America Outlook (USD Million, 2018-2030)
  • North America Tablet PC, By Operating System Outlook (USD Million, 2018-2030)
    • Android
    • IOS
    • Windows
  • North America Tablet PC, By Distribution Channel (USD Million, 2018-2030)
    • Supermarkets/ Hypermarkets
    • Independent Retailers
    • Online Sales
  • North America Tablet PC, By End-User (USD Million, 2018-2030)
    • Individual User
    • Corporate User
    • School & Colleges
    • Others
    • US Outlook (USD Million, 2018-2030)
    • US Tablet PC, By Operating System Outlook (USD Million, 2018-2030)
      • Android
      • IOS
      • Windows
    • US Tablet PC, By Distribution Channel (USD Million, 2018-2030)
      • Supermarkets/ Hypermarkets
      • Independent Retailers
      • Online Sales
    • US Tablet PC, By End-User (USD Million, 2018-2030)
      • Individual User
      • Corporate User
      • School & Colleges
      • Others
    • Canada Outlook (USD Million, 2018-2030)
    • Canada Tablet PC, By Operating System Outlook (USD Million, 2018-2030)
      • Android
      • IOS
      • Windows
    • Canada Tablet PC, By Distribution Channel (USD Million, 2018-2030)
      • Supermarkets/ Hypermarkets
      • Independent Retailers
      • Online Sales
    • Canada Tablet PC, By End-User (USD Million, 2018-2030)
      • Individual User
      • Corporate User
      • School & Colleges
      • Others
    • Europe Outlook (USD Million, 2018-2030)
    • Europe Tablet PC, By Operating System Outlook (USD Million, 2018-2030)
      • Android
      • IOS
      • Windows
    • Europe Tablet PC, By Distribution Channel (USD Million, 2018-2030)
      • Supermarkets/ Hypermarkets
      • Independent Retailers
      • Online Sales
    • Europe Tablet PC, By End-User (USD Million, 2018-2030)
      • Individual User
      • Corporate User
      • School & Colleges
      • Others
      • Germany Outlook (USD Million, 2018-2030)
      • Germany Tablet PC, By Operating System Outlook (USD Million, 2018-2030)
        • Android
        • IOS
        • Windows
      • Germany Tablet PC, By Distribution Channel (USD Million, 2018-2030)
        • Supermarkets/ Hypermarkets
        • Independent Retailers
        • Online Sales
      • Germany Tablet PC, By End-User (USD Million, 2018-2030)
        • Individual User
        • Corporate User
        • School & Colleges
        • Others
      • France Outlook (USD Million, 2018-2030)
      • France Tablet PC, By Operating System Outlook (USD Million, 2018-2030)
        • Android
        • IOS
        • Windows
      • France Tablet PC, By Distribution Channel (USD Million, 2018-2030)
        • Supermarkets/ Hypermarkets
        • Independent Retailers
        • Online Sales
      • France Tablet PC, By End-User (USD Million, 2018-2030)
        • Individual User
        • Corporate User
        • School & Colleges
        • Others
      • UK Outlook (USD Million, 2018-2030)
      • UK Tablet PC, By Operating System Outlook (USD Million, 2018-2030)
        • Android
        • IOS
        • Windows
      • UK Tablet PC, By Distribution Channel (USD Million, 2018-2030)
        • Supermarkets/ Hypermarkets
        • Independent Retailers
        • Online Sales
      • UK Tablet PC, By End-User (USD Million, 2018-2030)
        • Individual User
        • Corporate User
        • School & Colleges
        • Others
      • Italy Outlook (USD Million, 2018-2030)
      • Italy Tablet PC, By Operating System Outlook (USD Million, 2018-2030)
        • Android
        • IOS
        • Windows
      • Italy Tablet PC, By Distribution Channel (USD Million, 2018-2030)
        • Supermarkets/ Hypermarkets
        • Independent Retailers
        • Online Sales
      • Italy Tablet PC, By End-User (USD Million, 2018-2030)
        • Individual User
        • Corporate User
        • School & Colleges
        • Others
      • Rest of Europe Outlook (USD Million, 2018-2030)
      • Rest of Europe Tablet PC, By Operating System Outlook (USD Million, 2018-2030)
        • Android
        • IOS
        • Windows
      • Rest of Europe Tablet PC, By Distribution Channel (USD Million, 2018-2030)
        • Supermarkets/ Hypermarkets
        • Independent Retailers
        • Online Sales
      • Rest of Europe Tablet PC, By End-User (USD Million, 2018-2030)
        • Individual User
        • Corporate User
        • School & Colleges
        • Others
      • Asia-Pacific Outlook (USD Million, 2018-2030)
      • Asia-Pacific Tablet PC, By Operating System Outlook (USD Million, 2018-2030)
        • Android
        • IOS
        • Windows
      • Asia-Pacific Tablet PC, By Distribution Channel (USD Million, 2018-2030)
        • Supermarkets/ Hypermarkets
        • Independent Retailers
        • Online Sales
      • Asia-Pacific Tablet PC, By End-User (USD Million, 2018-2030)
        • Individual User
        • Corporate User
        • School & Colleges
        • Others
        • China Outlook (USD Million, 2018-2030)


  • China Tablet PC, By Operating System Outlook (USD Million, 2018-2030)
    • Android
    • IOS
    • Windows
  • China Tablet PC, By Distribution Channel (USD Million, 2018-2030)
    • Supermarkets/ Hypermarkets
    • Independent Retailers
    • Online Sales
  • China Tablet PC, By End-User (USD Million, 2018-2030)
    • Individual User
    • Corporate User
    • School & Colleges
    • Others
  • India Outlook (USD Million, 2018-2030)
  • India Tablet PC, By Operating System Outlook (USD Million, 2018-2030)
    • Android
    • IOS
    • Windows
  • India Tablet PC, By Distribution Channel (USD Million, 2018-2030)
    • Supermarkets/ Hypermarkets
    • Independent Retailers
    • Online Sales
  • India Tablet PC, By End-User (USD Million, 2018-2030)
    • Individual User
    • Corporate User
    • School & Colleges
    • Others
  • Japan Outlook (USD Million, 2018-2030)
  • Japan Tablet PC, By Operating System Outlook (USD Million, 2018-2030)
    • Android
    • IOS
    • Windows
  • Japan Tablet PC, By Distribution Channel (USD Million, 2018-2030)
    • Supermarkets/ Hypermarkets
    • Independent Retailers
    • Online Sales
  • Japan Tablet PC, By End-User (USD Million, 2018-2030)
    • Individual User
    • Corporate User
    • School & Colleges
    • Others
  • South Korea Outlook (USD Million, 2018-2030)
  • South Korea Tablet PC, By Operating System Outlook (USD Million, 2018-2030)
    • Android
    • IOS
    • Windows
  • South Korea Tablet PC, By Distribution Channel (USD Million, 2018-2030)
    • Supermarkets/ Hypermarkets
    • Independent Retailers
    • Online Sales
  • South Korea Tablet PC, By End-User (USD Million, 2018-2030)
    • Individual User
    • Corporate User
    • School & Colleges
    • Others
  • Australia Outlook (USD Million, 2018-2030)
  • Australia Tablet PC, By Operating System Outlook (USD Million, 2018-2030)
    • Android
    • IOS
    • Windows
  • Australia Tablet PC, By Distribution Channel (USD Million, 2018-2030)
    • Supermarkets/ Hypermarkets
    • Independent Retailers
    • Online Sales
  • Australia Tablet PC, By End-User (USD Million, 2018-2030)
    • Individual User
    • Corporate User
    • School & Colleges
    • Others
  • Rest of Asia-Pacific Outlook (USD Million, 2018-2030)
  • Rest of Asia-Pacific Tablet PC, By Operating System Outlook (USD Million, 2018-2030)
    • Android
    • IOS
    • Windows
  • Rest of Asia-Pacific Tablet PC, By Distribution Channel (USD Million, 2018-2030)
    • Supermarkets/ Hypermarkets
    • Independent Retailers
    • Online Sales
  • Rest of Asia-Pacific Tablet PC, By End-User (USD Million, 2018-2030)
    • Individual User
    • Corporate User
    • School & Colleges
    • Others
  • Rest of the World Tablet PC, By Operating System Outlook (USD Million, 2018-2030)
    • Android
    • IOS
    • Windows
  • Rest of the World Tablet PC, By Distribution Channel (USD Million, 2018-2030)
    • Supermarkets/ Hypermarkets
    • Independent Retailers
    • Online Sales
  • Rest of the World Tablet PC, By End-User (USD Million, 2018-2030)
    • Individual User
    • Corporate User
    • School & Colleges
    • Others
    • Middle East & Africa Outlook (USD Million, 2018-2030)
    • Middle East & Africa Tablet PC, By Operating System Outlook (USD Million, 2018-2030)
      • Android
      • IOS
      • Windows
    • Middle East & Africa Tablet PC, By Distribution Channel (USD Million, 2018-2030)
      • Supermarkets/ Hypermarkets
      • Independent Retailers
      • Online Sales
    • Middle East & Africa Tablet PC, By End-User (USD Million, 2018-2030)
      • Individual User
      • Corporate User
      • School & Colleges
      • Others
    • South America Outlook (USD Million, 2018-2030)
    • South America Tablet PC, By Operating System Outlook (USD Million, 2018-2030)
      • Android
      • IOS
      • Windows
    • South America Tablet PC, By Distribution Channel (USD Million, 2018-2030)
      • Supermarkets/ Hypermarkets
      • Independent Retailers
      • Online Sales
    • South America Tablet PC, By End-User (USD Million, 2018-2030)
      • Individual User
      • Corporate User
      • School & Colleges
      • Others
Infographic

Free Sample Request

Kindly complete the form below to receive a free sample of this Report

Get Free Sample

Customer Strories

“I am very pleased with how market segments have been defined in a relevant way for my purposes (such as "Portable Freezers & refrigerators" and "last-mile"). In general the report is well structured. Thanks very much for your efforts.”

Victoria Milne

Founder

Compare Licence

×
Features License Type
Single User Multiuser License Enterprise User
Price $4,950 $5,950 $7,250
Maximum User Access Limit 1 User Upto 10 Users Unrestricted Access Throughout the Organization
Free Customization
Direct Access to Analyst
Deliverable Format
Platform Access
Discount on Next Purchase 10% 15% 15%
Printable Versions