Tablet PC Market Share
Tablet PC Market Research Report Information By Operating System (Android, iOS, and Windows), Distribution Channel (Supermarkets/ Hypermarkets, Independent Retailers, and Online Sales), End-User (Individual User, Corporate User, Schools & Colleges, and Others), and By Region (North America, Europe, Asia-Pacific, Middle East & Africa, and South America) - Forecast till 2035

Market Summary
As per Market Research Future Analysis, the Tablet PC Market was valued at USD 62.65 billion in 2022 and is projected to grow from USD 67.00 billion in 2023 to USD 97.47 billion by 2030, with a CAGR of 5.5% during the forecast period. The market is driven by the increasing popularity of laptops and tablets due to their portability, long battery life, and enhanced performance. The demand for tablets has shifted from entertainment to various applications in business, education, and personal use, supported by technological advancements.
Key Market Trends & Highlights
Key trends influencing the Tablet PC market include:
- Android operating system dominated the market with a revenue share of over 50.3% in 2022. Corporate users held the largest market share in 2022 and are expected to grow at a CAGR of 5.8% during the forecast period. Independent retailers accounted for approximately 53.5% of total revenue in 2022, highlighting the importance of personalized shopping experiences. North America is the largest regional market, driven by rising smart device penetration and trends in online learning.
Market Size & Forecast
2022 Market Size | USD 62.65 Billion |
2023 Market Size | USD 67.00 Billion |
2030 Market Size | USD 97.47 Billion |
CAGR (2023-2030) | 5.5% |
Largest Regional Market | North America. |
Major Players
<p>Key players in the Tablet PC market include Acer Inc, Apple Inc, Hewlett-Packard Company, Huawei Technologies, Lenovo Group, LG Electronics Inc, Microsoft Corporation, Nokia Corporation, Samsung Electronics Co Ltd, Realme, Xiaomi, Amazon, Fujitsu Ltd, CHUWI, Dynabook.</p>
Market Trends
Increasing Popularity Of The Laptops And Tablets Owing To Their Smaller Sizes And Less Weight
A single-panel computer with a touch screen is referred to as a tablet computer. A tablet has more computing power than a notebook and is more portable than a laptop. Like the iPhone before it, Apple's iPad started a revolution in tablet computing. Sales of tablets have risen sharply in recent years, totaling double-digit millions globally. Computer manufacturers are attempting to pique consumer interest with the next must-have mobile media tablet. Tablet computers include the iPad, Android, BlackBerry, HP WebOS, and Windows, each of which includes a web browser.
Applications designed specifically for each platform's operating system are run on each platform. Although there is still a small market for tablets in mainstream computing, they are growing in popularity owing to features like 3G, Wi-Fi, and better wireless access. The industry is being driven by consumer desire for computing devices that offer effective functionality and portability and are smaller than laptops or desktop PCs but larger than smartphones.
There has been a significant paradigm change in consumer desire toward tablet computers. There has been a shift in consumer desire for tablet computers in recent decades. The popularity of tablets, which were formerly mostly used for entertainment, has increased as a result of technological developments, which has changed how consumers utilise them. Tablets are utilised in a variety of contexts, including business, commercial, personal, and education.
With features like lighter tablets, larger screens, greater graphics for gaming and streaming video, applications for bill payment, and syncing with other electronic devices for monitoring, tablet designs have drastically changed in response to consumer needs.
Additionally, it is anticipated that during the projected period, the development of new gadgets with lucrative features would help the Tablet PC Market. Due to their reduced size and increased use, many people perceive tablets to be handier than laptops. Tablets are frequently more affordable, lighter, easier to carry, and need less time to set up. Additionally, tablet data is stored on solid-state drives (SSDs). As a result, most tablets are less heavy but have less storage space. Thus, the demand for Table PC is expected to increase owing to their small sizes and weight.
<p>The Global Tablet PC Market appears to be experiencing a resurgence, driven by increasing demand for portable computing solutions and enhanced user experiences across various sectors.</p>
U.S. Department of Commerce
Tablet PC Market Market Drivers
Market Growth Projections
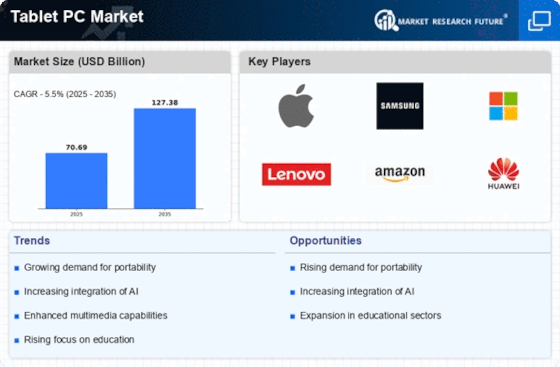
The Global Tablet PC Market Industry is projected to experience robust growth, with an anticipated compound annual growth rate (CAGR) of 5.48% from 2025 to 2035. This growth trajectory indicates a strong demand for tablet PCs, driven by various factors such as technological advancements, increased mobility, and the expanding content ecosystem. The market is expected to reach 127.4 USD Billion by 2035, reflecting the ongoing evolution of consumer preferences and the integration of tablets into daily life. These projections highlight the potential for sustained investment and innovation within the Global Tablet PC Market Industry.
Advancements in Technology
Technological advancements significantly influence the Global Tablet PC Market Industry, as manufacturers continuously innovate to enhance device performance and user experience. Features such as improved processing power, high-resolution displays, and extended battery life are becoming standard in new tablet models. For instance, the integration of artificial intelligence and machine learning capabilities allows for more personalized user interactions. As these technologies evolve, they not only attract tech-savvy consumers but also expand the market's appeal across various demographics. The ongoing evolution in tablet technology suggests that the Global Tablet PC Market Industry will remain competitive and dynamic in the coming years.
Expanding Content Ecosystem
The Global Tablet PC Market Industry is significantly influenced by the expanding content ecosystem, which includes a diverse range of applications, games, and multimedia content. As more developers create tablet-optimized content, consumers are increasingly drawn to these devices for entertainment and productivity. The availability of educational apps, e-books, and streaming services enhances the appeal of tablet PCs, making them indispensable tools for users of all ages. This growing ecosystem not only drives sales but also encourages user retention, as consumers invest in devices that provide access to a rich array of content. The ongoing development of this ecosystem is likely to bolster the Global Tablet PC Market Industry.
Rising Demand for Portable Devices
The Global Tablet PC Market Industry experiences a surge in demand for portable devices, driven by the increasing need for mobility among consumers. As individuals seek versatile gadgets that can seamlessly transition between work and leisure, tablet PCs emerge as a preferred choice. The market is projected to reach 70.9 USD Billion in 2024, reflecting a growing inclination towards devices that offer both functionality and convenience. This trend is particularly pronounced in educational and professional settings, where tablets facilitate remote learning and telecommuting. Consequently, the Global Tablet PC Market Industry is likely to witness sustained growth as more users adopt these portable solutions.
Growth in E-Learning and Remote Work
The Global Tablet PC Market Industry benefits from the increasing adoption of e-learning and remote work practices. Educational institutions and businesses are increasingly integrating tablet PCs into their operations, recognizing their potential to enhance productivity and engagement. For example, tablets facilitate interactive learning experiences and provide access to a wealth of online resources. This trend is expected to contribute to the market's growth, with projections indicating a rise to 127.4 USD Billion by 2035. The ability of tablets to support various applications and platforms further solidifies their role in the evolving landscape of education and work, positioning the Global Tablet PC Market Industry for continued expansion.
Increased Focus on Health and Wellness
The Global Tablet PC Market Industry is witnessing an increased focus on health and wellness applications, which are becoming integral to the functionality of tablet devices. With the rise of health monitoring apps and telehealth services, tablets serve as effective tools for managing personal health and wellness. Users can track fitness goals, access telemedicine consultations, and utilize health-related resources directly from their devices. This trend aligns with the broader societal shift towards health consciousness, suggesting that the Global Tablet PC Market Industry may continue to grow as consumers seek devices that support their health and wellness objectives.
Market Segment Insights
Tablet PC Operating System Insights
<p>The Tablet PC Market, in this report, has been segmented on the basis of operating system into Android, iOS, and Windows. With a revenue share of more than 50.3% in 2022, the Android category dominated the market. Android is an open-source operating system, which means that it is available for free and can be customized by device manufacturers to suit their needs. This has led to a large number of manufacturers using the <a href="https://www.marketresearchfuture.com/reports/smartphone-operating-system-market-4751">Android operating system</a> on their devices, resulting in a wider variety of tablets available to consumers. </p>
<p>Android has a large user base and a strong ecosystem of apps and services, including the Google Play Store, which offers a wide range of apps and content. This has made Android a popular choice among consumers who value access to a broad range of applications and services. Android tablets are available at a range of price points, making them accessible to a broad range of consumers. This has helped to drive adoption of Android tablets in emerging markets and among price-sensitive consumers.</p>
<p>February 2022 Lenovo launched Lenovo Tab M10 Plus (3rd Gen) Android tablet</p>
Tablet PC Distribution Channel Insights
<p>The Tablet PC Market, in this report, has been segmented on the basis of Distribution Channel into Supermarkets/ Hypermarkets, Independent Retailers, and Online Sales. In 2022, the Independent Retailers held the top spot and represented about 53.5% of total revenue.</p>
<p>Independent retailers offer a more personalized shopping experience compared to larger retail chains, which may attract customers who value this type of service. Independent retailers specialize in a particular type of tablet PC or a specific brand, which could attract customers who are looking for a specific product. Independent retailers are located in areas where there are fewer large retail chains, giving them a competitive advantage in those markets.</p>
<p>However, Online sales are becoming increasingly popular for consumers due to their convenience and ease of use. Consumers can shop from the comfort of their own homes, at any time of the day, and have the product delivered to their doorstep. Online retailers such as Amazon and other <a href="https://www.marketresearchfuture.com/reports/e-commerce-market-18845">e-commerce</a> platforms also provide a wide range of products, including Tablet PCs, and often offer competitive prices. However, consumers may not be able to physically see or touch the product before purchasing, which can be a disadvantage.</p>
Tablet PC End-User Insights
<p>The Tablet PC market in this report has been segmented on the basis of End-User into four types, namely Individual User, Corporate User, Schools & Colleges, and Others. Corporate User held the largest market share in 2022 and is expected to register a CAGR of 5.8% during the forecast period. Corporate users refer to businesses that purchase Tablet PCs for their employees to use in the workplace. Tablet PCs may be used for tasks such as presentations, email, and document editing. This segment therefore is large in industries where mobility is important, such as sales or field services.</p>
<p>Figure 4: Tablet Pc Market Share By End Users, 2022 Vs 2030 (USD Billion)</p>
<p>Source: Secondary Research, Primary Research, Market Research Future Database and Analyst Review</p>
Get more detailed insights about Tablet PC Market Research Report - Global Forecast till 2030
Regional Insights
By Region, the study segments the market into North America, Europe, Asia-Pacific, Middle East & Africa, and South America. North America holds a largest market share in the global market.
The North America consists of the U.S., Canada, and Mexico. The demand for tablet computers in North America has recently been increasing quickly. Unprecedented demand for better hardware technologies is a key factor in the development and maturation of the market. The usage of tablet PCs is not limited to a certain age group, and the demand for them is diverse, which has fueled the market expansion. Among the key growth-promoting factors for the tablet PC market are the region's rising smart device penetration and trends in online learning.
Moreover, the growing customer base for consumer electronics and clever gadgets drives the industry's overall growth for Tablets PC.
Demand in North America is being boosted by parental control, connection, and other technological developments constantly being made available. The region's expanding adoption of the newest technical innovations also benefits the local economy. For instance, the American government passed the Bipartisan Infrastructure Law, an Infrastructure Investment & Jobs Act, in November 2021. To guarantee that the American people have access to dependable high-speed internet, the government has allotted close to USD 65 billion under this act. The strong demand for cloud-based e-learning results from businesses like IBM Corporation, Amazon Web Services, and Microsoft Corporation in the cloud computing market.
Figure 5: Tablet Pc Market Share By End Users, 2022 Vs 2030 (USD Billion)
Source: Secondary Research, Primary Research, Market Research Future Database and Analyst Review
Key Players and Competitive Insights
The tablet PC market has witnessed significant growth over the forecast period due to increasing popularity of the laptops and tablets owing to their smaller sizes and less weight.There are several domestic, regional, and global players operating in the tablet PC market who continuously strive to gain a significant share of the overall market.
During the study, MRFR has analyzed some of the major players in the Tablet PC market who have contributed to the market growth. These include Acer Inc, Apple Inc, Hewlett-Packard Company, Huawei Technologies, Lenovo Group, LG Electronics Inc, Microsoft Corporation, Nokia Corporation, Samsung Electronics Co Ltd, Realme, Xiaomi, Amazon, Fujitsu Ltd, CHUWI, Dynabook. Among these, Apple Inc, Huawei Technologies , Lenovo Group, Samsung Electronics Co Ltd, and Amazon are among the top 5 players in Tablet PC market.
These players focus on expanding and enhancing their product portfolio and services to remain competitive and increase their customer base. Additionally, these players are focusing on partnerships & collaborations to expand their business and customer base to enhance their market position.
October 2022 Apple unveiled the all-screen new iPad , with a huge 10.9-inch Liquid Retina display. The A14 Bionic chip, which powers the new iPad, provides even quicker performance with exceptional power efficiency for demanding workloads while maintaining all-day battery life. 1 Updated camera includes a 12MP back camera with 4K video recording capabilities and an Ultra Wide 12MP front camera situated along the iPad's edge in landscape orientation. A USB-C port supports wide-ranging accessories, Wi-Fi 6 provides even quicker connectivity, and cellular variants have ultrafast 5G so users can stay connected while on the road.
November 2022 HP, the Chromebook x2 11 has introduced a new 2-in-1 tablet running Chrome OS. Although there are currently numerous Chrome OS tablets, the Chromebook x2 11 is the first to enable 4G LTE. The tablet also features an 11-inch display with a 3:2 aspect ratio and a resolution of 2,160 x 1,440 pixels.
Key Companies in the Tablet PC Market market include


Industry Developments
October 2022 With significant upgrades to Mail, iCloud Shared Photo Library, passkeys, and new collaboration tools in Safari, the Weather app, pro features like Reference Mode and Display Zoom, and a new multitasking experience with Stage Manager, iPadOS 16 expands on the flexibility of the iPad. As of right now, iPadOS 16 is a cost-free software update.
June 2022 Apple previewed a significant update that expands the functionality of the iPad experience. Stage Manager introduces a unique multitasking method with numerous overlapping windows and complete external display compatibility by utilizing the capability of the M1 chip. With new ways to start collaborating with others in apps throughout the system using Messages, collaboration is simpler than ever. In addition, the new Freeform app offers a flexible canvas for group brainstorming.
Future Outlook
Tablet PC Market Future Outlook
<p>The Global Tablet PC Market is projected to grow at a 5.48% CAGR from 2024 to 2035, driven by advancements in technology, increasing demand for portable devices, and enhanced user experiences.</p>
New opportunities lie in:
- <p>Develop specialized tablets for educational institutions to enhance learning experiences. Invest in 5G-enabled tablets to cater to the growing demand for high-speed connectivity. Create eco-friendly tablet models to attract environmentally conscious consumers.</p>
<p>By 2035, the Tablet PC Market is expected to be robust, reflecting substantial growth and innovation.</p>
Market Segmentation
Tablet PC Regional Outlook
- {""=>["US"
- "Canada"
- "Mexico"]}
- {""=>["Germany"
- "France"
- "UK"
- "Rest of Europe"]}
- {""=>["China"
- "Japan"
- "India"
- "Rest of Asia-Pacific"]}
Tablet PC End-User Outlook
- Individual User
- Corporate User
- Schools & Colleges
- Others
Tablet PC Operating System Outlook
- Android
- iOS
- Windows
Tablet PC Distribution Channel Outlook
- Supermarkets/ Hypermarkets
- Independent Retailers
- Online Sales
Report Scope
Report Attribute/Metric | Details |
Market Size 2022 | USD 62.65 Billion |
Market Size 2023 | USD 67.00 Billion |
Market Size 2030 | USD 97.47 Billion |
Compound Annual Growth Rate (CAGR) | 5.5% (2023-2030) |
Base Year | 2022 |
Forecast Period | 2023-2030 |
Historical Data | 2018-2021 |
Forecast Units | Value (USD Billion) |
Report Coverage | Revenue Forecast, Competitive Landscape, Growth Factors, and Trends |
Segments Covered | Operating System, Distribution Channel, and End-Users |
Geographies Covered | North America, Europe, Asia Pacific, Middle East & Africa, and South America |
Countries Covered | The U.S, Canada, Mexico, Germany, France, UK, China, Japan, India, Australia, South Korea, UAE, and Brazil |
Key Companies Profiled | Acer Inc, Apple Inc, Hewlett-Packard Company, Huawei Technologies, Lenovo Group, LG Electronics Inc, Microsoft Corporation, Nokia Corporation, Samsung Electronics Co Ltd, Realme, Xiaomi, Amazon, Fujitsu Ltd, CHUWI, Dynabook, and Others. |
Key Market Opportunities | New opportunities arising from sectors such as education, healthcare, financial services and retail Importance of compact electronic devices Rising use of tablets in transport & logistics |
Key Market Dynamics | Increasing popularity of the laptops and tablets owing to their smaller sizes and less weight Convenient tool for users due to long battery life and overall performance Rising demand for rugged tablet PC |
Market Highlights
Author
Latest Comments
This is a great article! Really helped me understand the topic better.
Thanks for sharing this. I’ve bookmarked it for later reference.
FAQs
How much is the Tablet PC market?
USD 62,650.0 Million in 2022
What is the market size for 2030, for the Tablet PC Market?
USD 97,474.5 Million in 2030
What is the growth rate of the Tablet PC market?
5.5%
Which region held the largest market share in the Tablet PC market?
North America
Who are the prominent players in the Tablet PC market?
Acer Inc, Apple Inc, Hewlett-Packard Company, Huawei Technologies, Lenovo Group, LG Electronics Inc, Microsoft Corporation, Nokia Corporation, Samsung Electronics Co Ltd, Realme, Xiaomi, Amazon, Fujitsu Ltd, CHUWI, Dynabook, and Others.
-
Table of Contents
-
Executive Summary 18
-
Market Introduction 21
- DEFINITION 21
- Scope of the Study 21
- RESEARCH OBJECTIVE 21
- MARKET STRUCTURE 22
-
Research Methodology 23
-
MARKET DYNAMICS 30
- INTRODUCTION 30
-
DRIVERS 31
- INCREASING POPULARITY OF THE LAPTOPS AND TABLETS OWING TO THEIR SMALLER SIZES AND LESS WEIGHT 31
- CONVENIENT TOOL FOR USERS DUE TO LONG BATTERY LIFE AND OVERALL PERFORMANCE 31
- RISING DEMAND FOR RUGGED TABLET PC 32
- DRIVERS IMPACT ANALYSIS 33
-
RESTRAINTS 33
- ARRIVAL OF PHABLETS (SMARTPHONES WITH LARGER SCREEN SIZE) 33
- CANNIBALIZATION BY EMERGING COMPANIES RESTRAINS MARKET GROWTH 33
-
OPPORTUNITIES 34
- NEW OPPORTUNITIES ARISING FROM SECTORS SUCH AS EDUCATION, HEALTHCARE, FINANCIAL SERVICES AND RETAIL 34
- IMPORTANCE OF COMPACT ELECTRONIC DEVICES 35
- RISING USE OF TABLETS IN TRANSPORT & LOGISTICS 36
-
IMPACT ANALYSIS OF COVID-19 36
- IMPACT ON GLOBAL TABLET PC MARKET 36
- IMPACT ON SEMICONDUCTOR MANUFACTURERS 37
- IMPACT ON COMPONENT MANUFACTURERS 39
- IMPACT ON DEVICE MANUFACTURERS 39
- COVID-19 IMPACT ON SUPPLY CHAIN DELAYS 39
-
MARKET FACTOR ANALYSIS 40
-
VALUE CHAIN ANALYSIS 40
- R&D AND PRODUCT DESIGN 40
- SOURCING & PROCUREMENT 40
- ASSEMBLY 41
- SOFTWARE INSTALLATION 41
- BOOT-UP & BURN-IN 41
- DISPATCH 41
-
PORTER'S FIVE FORCES MODEL 42
- THREAT OF NEW ENTRANTS 43
- BARGAINING POWER OF SUPPLIERS 43
- THREAT OF SUBSTITUTES 43
- BARGAINING POWER OF BUYERS 43
- INTENSITY OF RIVALRY 44
-
VALUE CHAIN ANALYSIS 40
-
GLOBAL TABLET PC MARKET, BY OPERATING SYSTEM 45
-
OVERVIEW 45
- GLOBAL TABLET PC MARKET, BY OPERATING SYSTEM, 2018–2030 (USD MILLION) 46
- ANDROID 46
- IOS 46
- WINDOWS 46
-
OVERVIEW 45
-
GLOBAL TABLET PC MARKET, BY DISTRIBUTION CHANNEL 47
-
OVERVIEW 47
- GLOBAL TABLET PC MARKET, BY DISTRIBUTION CHANNEL, 2018–2030 (USD MILLION) 48
- SUPERMARKETS/ HYPERMARKETS 48
- INDEPENDENT RETAILERS 48
- ONLINE SALES 49
-
OVERVIEW 47
-
GLOBAL TABLET PC MARKET, BY END-USER 50
-
OVERVIEW 50
- GLOBAL TABLET PC MARKET, BY END-USER, 2018–2030 (USD MILLION) 51
- INDIVIDUAL USER 51
- CORPORATE USER 52
- SCHOOLS & COLLEGES 52
- OTHERS 52
-
OVERVIEW 50
-
GLOBAL TABLET PC MARKET, BY REGION 53
-
OVERVIEW 53
- GLOBAL TABLET PC MARKET, BY REGION, 2021 VS 2030 (USD MILLION) 53
- GLOBAL TABLET PC MARKET, BY REGION, 2018–2030 (USD MILLION) 54
-
NORTH AMERICA 55
- NORTH AMERICA: TABLET PC MARKET, BY COUNTRY, 2018–2030 (USD MILLION) 57
- NORTH AMERICA TABLET PC MARKET, BY OPERATING SYSTEM, 2018–2030 (USD MILLION) 58
- NORTH AMERICA TABLET PC MARKET, BY DISTRIBUTION CHANNEL, 2018–2030 (USD MILLION) 58
- NORTH AMERICA TABLET PC MARKET, BY END-USER, 2018–2030 (USD MILLION) 59
- US 59
- US TABLET PC MARKET, BY OPERATING SYSTEM, 2018–2030 (USD MILLION) 59
- US TABLET PC MARKET, BY DISTRIBUTION CHANNEL, 2018–2030 (USD MILLION) 60
- US TABLET PC MARKET, BY END-USER, 2018–2030 (USD MILLION) 60
- CANADA 60
- CANADA TABLET PC MARKET, BY OPERATING SYSTEM, 2018–2030 (USD MILLION) 60
- CANADA TABLET PC MARKET, BY DISTRIBUTION CHANNEL, 2018–2030 (USD MILLION) 60
- CANADA TABLET PC MARKET, BY END-USER, 2018–2030 (USD MILLION) 61
- MEXICO 61
- MEXICO TABLET PC MARKET, BY OPERATING SYSTEM, 2018–2030 (USD MILLION) 61
- MEXICO TABLET PC MARKET, BY DISTRIBUTION CHANNEL, 2018–2030 (USD MILLION) 61
- MEXICO TABLET PC MARKET, BY END-USER, 2018–2030 (USD MILLION) 61
-
EUROPE 62
- EUROPE: TABLET PC MARKET, BY COUNTRY, 2018–2030 (USD MILLION) 63
- EUROPE TABLET PC MARKET, BY OPERATING SYSTEM, 2018–2030 (USD MILLION) 64
- EUROPE TABLET PC MARKET, BY DISTRIBUTION CHANNEL, 2018–2030 (USD MILLION) 64
- EUROPE TABLET PC MARKET, BY END-USER, 2018–2030 (USD MILLION) 65
- GERMANY 65
- GERMANY TABLET PC MARKET, BY OPERATING SYSTEM, 2018–2030 (USD MILLION) 65
- GERMANY TABLET PC MARKET, BY DISTRIBUTION CHANNEL, 2018–2030 (USD MILLION) 66
- GERMANY TABLET PC MARKET, BY END-USER, 2018–2030 (USD MILLION) 66
- UK 66
- UK TABLET PC MARKET, BY OPERATING SYSTEM, 2018–2030 (USD MILLION) 66
- UK TABLET PC MARKET, BY DISTRIBUTION CHANNEL, 2018–2030 (USD MILLION) 66
- UK TABLET PC MARKET, BY END-USER, 2018–2030 (USD MILLION) 67
- FRANCE 67
- FRANCE TABLET PC MARKET, BY OPERATING SYSTEM, 2018–2030 (USD MILLION) 67
- FRANCE TABLET PC MARKET, BY DISTRIBUTION CHANNEL, 2018–2030 (USD MILLION) 67
- FRANCE TABLET PC MARKET, BY END-USER, 2018–2030 (USD MILLION) 67
- ITALY 68
- ITALY TABLET PC MARKET, BY OPERATING SYSTEM, 2018–2030 (USD MILLION) 68
- ITALY TABLET PC MARKET, BY DISTRIBUTION CHANNEL, 2018–2030 (USD MILLION) 68
- ITALY TABLET PC MARKET, BY END-USER, 2018–2030 (USD MILLION) 68
- REST OF EUROPE 69
- REST OF EUROPE TABLET PC MARKET, BY OPERATING SYSTEM, 2018–2030 (USD MILLION) 69
- REST OF EUROPE TABLET PC MARKET, BY DISTRIBUTION CHANNEL, 2018–2030 (USD MILLION) 69
- REST OF EUROPE TABLET PC MARKET, BY END-USER, 2018–2030 (USD MILLION) 69
-
ASIA-PACIFIC 70
- ASIA-PACIFIC: TABLET PC MARKET, BY COUNTRY, 2018–2030 (USD MILLION) 71
- ASIA-PACIFIC TABLET PC MARKET, BY OPERATING SYSTEM, 2018–2030 (USD MILLION) 72
- ASIA-PACIFIC TABLET PC MARKET, BY DISTRIBUTION CHANNEL, 2018–2030 (USD MILLION) 72
- ASIA-PACIFIC TABLET PC MARKET, BY END-USER, 2018–2030 (USD MILLION) 73
- CHINA 73
- CHINA TABLET PC MARKET, BY OPERATING SYSTEM, 2018–2030 (USD MILLION) 73
- CHINA TABLET PC MARKET, BY DISTRIBUTION CHANNEL, 2018–2030 (USD MILLION) 74
- CHINA TABLET PC MARKET, BY END-USER, 2018–2030 (USD MILLION) 74
- INDIA 74
- INDIA TABLET PC MARKET, BY OPERATING SYSTEM, 2018–2030 (USD MILLION) 74
- INDIA TABLET PC MARKET, BY DISTRIBUTION CHANNEL, 2018–2030 (USD MILLION) 74
- INDIA TABLET PC MARKET, BY END-USER, 2018–2030 (USD MILLION) 75
- JAPAN 75
- JAPAN TABLET PC MARKET, BY OPERATING SYSTEM, 2018–2030 (USD MILLION) 75
- JAPAN TABLET PC MARKET, BY DISTRIBUTION CHANNEL, 2018–2030 (USD MILLION) 75
- JAPAN TABLET PC MARKET, BY END-USER, 2018–2030 (USD MILLION) 75
- SOUTH KOREA 76
- SOUTH KOREA TABLET PC MARKET, BY OPERATING SYSTEM, 2018–2030 (USD MILLION) 76
- SOUTH KOREA TABLET PC MARKET, BY DISTRIBUTION CHANNEL, 2018–2030 (USD MILLION) 76
- SOUTH KOREA TABLET PC MARKET, BY END-USER, 2018–2030 (USD MILLION) 76
- REST OF ASIA-PACIFIC 77
- REST OF ASIA-PACIFIC TABLET PC MARKET, BY OPERATING SYSTEM, 2018–2030 (USD MILLION) 77
- REST OF ASIA-PACIFIC TABLET PC MARKET, BY DISTRIBUTION CHANNEL, 2018–2030 (USD MILLION) 77
- REST OF ASIA-PACIFIC TABLET PC MARKET, BY END-USER, 2018–2030 (USD MILLION) 77
-
MIDDLE EAST & AFRICA 78
- MIDDLE EAST & AFRICA: TABLET PC MARKET, BY COUNTRY, 2018–2030 (USD MILLION) 80
- MIDDLE EAST & AFRICA TABLET PC MARKET, BY OPERATING SYSTEM, 2018–2030 (USD MILLION) 81
- MIDDLE EAST & AFRICA TABLET PC MARKET, BY DISTRIBUTION CHANNEL, 2018–2030 (USD MILLION) 81
- MIDDLE EAST & AFRICA TABLET PC MARKET, BY END-USER, 2018–2030 (USD MILLION) 82
- SAUDI ARABIA 82
- SAUDI ARABIA TABLET PC MARKET, BY OPERATING SYSTEM, 2018–2030 (USD MILLION) 82
- SAUDI ARABIA TABLET PC MARKET, BY DISTRIBUTION CHANNEL, 2018–2030 (USD MILLION) 83
- SAUDI ARABIA TABLET PC MARKET, BY END-USER, 2018–2030 (USD MILLION) 83
- UAE 83
- UAE TABLET PC MARKET, BY OPERATING SYSTEM, 2018–2030 (USD MILLION) 83
- UAE TABLET PC MARKET, BY DISTRIBUTION CHANNEL, 2018–2030 (USD MILLION) 83
- UAE TABLET PC MARKET, BY END-USER, 2018–2030 (USD MILLION) 84
- SOUTH AFRICA 84
- SOUTH AFRICA TABLET PC MARKET, BY OPERATING SYSTEM, 2018–2030 (USD MILLION) 84
- SOUTH AFRICA TABLET PC MARKET, BY DISTRIBUTION CHANNEL, 2018–2030 (USD MILLION) 84
- SOUTH AFRICA TABLET PC MARKET, BY END-USER, 2018–2030 (USD MILLION) 85
- REST OF MIDDLE EAST & AFRICA 85
- REST OF MIDDLE EAST & AFRICA TABLET PC MARKET, BY OPERATING SYSTEM, 2018–2030 (USD MILLION) 85
- REST OF MIDDLE EAST & AFRICA TABLET PC MARKET, BY DISTRIBUTION CHANNEL, 2018–2030 (USD MILLION) 85
- REST OF MIDDLE EAST & AFRICA TABLET PC MARKET, BY END-USER, 2018–2030 (USD MILLION) 86
-
LATIN AMERICA 87
- LATIN AMERICA: TABLET PC MARKET, BY COUNTRY, 2018–2030 (USD MILLION) 88
- LATIN AMERICA TABLET PC MARKET, BY OPERATING SYSTEM, 2018–2030 (USD MILLION) 89
- LATIN AMERICA TABLET PC MARKET, BY DISTRIBUTION CHANNEL, 2018–2030 (USD MILLION) 89
- LATIN AMERICA TABLET PC MARKET, BY END-USER, 2018–2030 (USD MILLION) 90
- BRAZIL 90
- BRAZIL TABLET PC MARKET, BY OPERATING SYSTEM, 2018–2030 (USD MILLION) 90
- BRAZIL TABLET PC MARKET, BY DISTRIBUTION CHANNEL, 2018–2030 (USD MILLION) 91
- BRAZIL TABLET PC MARKET, BY END-USER, 2018–2030 (USD MILLION) 91
- REST OF LATIN AMERICA 91
- REST OF LATIN AMERICA TABLET PC MARKET, BY OPERATING SYSTEM, 2018–2030 (USD MILLION) 91
- REST OF LATIN AMERICA TABLET PC MARKET, BY DISTRIBUTION CHANNEL, 2018–2030 (USD MILLION) 92
- REST OF LATIN AMERICA TABLET PC MARKET, BY END-USER, 2018–2030 (USD MILLION) 92
-
OVERVIEW 53
-
Competitive Landscape 93
- COMPETITIVE BENCHMARKING 94
- VENDOR SHARE ANALYSIS 95
-
RECENT DEVELOPMENTS 96
- PRODUCT LAUNCH 96
- PRODUCT EXPANSION 99
- OTHERS 99
-
COMPANY PROFILES 100
-
ACER INC 100
- COMPANY OVERVIEW 100
- FINANCIAL OVERVIEW 101
- PRODUCTS OFFERED 102
- KEY DEVELOPMENTS 103
- SWOT ANALYSIS 103
- KEY STRATEGIES 103
-
APPLE INC 104
- COMPANY OVERVIEW 104
- FINANCIAL OVERVIEW 105
- KEY DEVELOPMENTS 106
- SWOT ANALYSIS 108
- KEY STRATEGIES 108
-
HEWLETT-PACKARD COMPANY 109
- COMPANY OVERVIEW 109
- FINANCIAL OVERVIEWS 109
- PRODUCTS OFFERED 110
- KEY DEVELOPMENTS 111
- SWOT ANALYSIS 111
- KEY STRATEGIES 112
-
HUAWEI TECHNOLOGIES 113
- COMPANY OVERVIEW 113
- FINANCIAL OVERVIEW 113
- PRODUCTS OFFERED 114
- KEY DEVELOPMENTS 114
- SWOT ANALYSIS 114
- KEY STRATEGIES 115
-
LENOVO GROUP 116
- COMPANY OVERVIEW 116
- FINANCIAL OVERVIEW 117
- PRODUCTS OFFERED 118
- KEY DEVELOPMENTS 120
- SWOT ANALYSIS 120
- KEY STRATEGIES 121
-
DYNABOOK (SHARP) 122
- COMPANY OVERVIEW 122
- FINANCIAL OVERVIEW 122
- PRODUCTS OFFERED 123
- KEY DEVELOPMENTS 123
- SWOT ANALYSIS 123
- KEY STRATEGIES 123
-
MICROSOFT CORPORATION 124
- COMPANY OVERVIEW 124
- FINANCIAL OVERVIEW 125
- PRODUCTS OFFERED 126
- KEY DEVELOPMENTS 127
- SWOT ANALYSIS 127
- KEY STRATEGIES 127
-
NOKIA CORPORATION 128
- COMPANY OVERVIEW 128
- FINANCIAL OVERVIEW 129
- PRODUCTS OFFERED 130
- KEY DEVELOPMENTS 130
- SWOT ANALYSIS 131
- KEY STRATEGIES 131
-
SAMSUNG ELECTRONICS CO LTD 132
- COMPANY OVERVIEW 132
- FINANCIAL OVERVIEW 133
- SOLUTIONS OFFERED 134
- KEY DEVELOPMENTS 135
- SWOT ANALYSIS 136
- KEY STRATEGIES 136
-
REALME 137
- COMPANY OVERVIEW 137
- FINANCIAL OVERVIEW 137
- PRODUCTS OFFERED 137
- KEY DEVELOPMENTS 137
- KEY STRATEGIES 137
-
XIAOMI 138
- COMPANY OVERVIEW 138
- FINANCIAL OVERVIEW 139
- PRODUCTS OFFERED 139
- KEY DEVELOPMENTS 140
- SWOT ANALYSIS 140
- KEY STRATEGIES 140
-
FUJITSU LTD 141
- COMPANY OVERVIEW 141
- FINANCIAL OVERVIEW 142
- KEY DEVELOPMENTS 144
- SWOT ANALYSIS 144
- KEY STRATEGIES 144
-
AMAZON 145
- COMPANY OVERVIEW 145
- FINANCIAL OVERVIEW 146
- PRODUCTS/SOLUTIONS/SERVICES OFFERED 147
- KEY DEVELOPMENTS 147
- SWOT ANALYSIS 148
- KEY STRATEGIES 148
-
CHUWI 149
- COMPANY OVERVIEW 149
- FINANCIAL OVERVIEW 149
- PRODUCTS/SOLUTIONS/SERVICES OFFERED 149
- KEY DEVELOPMENTS 150
-
LG ELECTRONICS 151
- COMPANY OVERVIEW 151
- FINANCIAL OVERVIEW 152
- PRODUCTS/SOLUTIONS/SERVICES OFFERED 153
- KEY DEVELOPMENTS 153
- SWOT ANALYSIS 153
- KEY STRATEGIES 154
-
ACER INC 100
-
-
List of Tables and Figures
- LIST OF TABLES
- TABLE 1 GLOBAL TABLET PC MARKET, BY OPERATING SYSTEM, 2018–2030 (USD MILLION) 46
- TABLE 2 GLOBAL TABLET PC MARKET, BY DISTRIBUTION CHANNEL, 2018–2030 (USD MILLION) 48
- TABLE 3 GLOBAL TABLET PC MARKET, BY END-USER, 2018–2030 (USD MILLION) 51
- TABLE 4 GLOBAL TABLET PC MARKET, BY REGION, 2018–2030 (USD MILLION) 54
- TABLE 5 NORTH AMERICA TABLET PC MARKET, BY COUNTRY, 2018–2030 (USD MILLION) 57
- TABLE 6 NORTH AMERICA TABLET PC MARKET, BY OPERATING SYSTEM, 2018–2030 (USD MILLION) 58
- TABLE 7 NORTH AMERICA TABLET PC MARKET, BY DISTRIBUTION CHANNEL, 2018–2030 (USD MILLION) 58
- TABLE 8 NORTH AMERICA TABLET PC MARKET, BY END-USER, 2018–2030 (USD MILLION) 59
- TABLE 9 US TABLET PC MARKET, BY OPERATING SYSTEM, 2018–2030 (USD MILLION) 59
- TABLE 10 US TABLET PC MARKET, BY DISTRIBUTION CHANNEL, 2018–2030 (USD MILLION) 60
- TABLE 11 US TABLET PC MARKET, BY END-USER, 2018–2030 (USD MILLION) 60
- TABLE 12 CANADA TABLET PC MARKET, BY OPERATING SYSTEM, 2018–2030 (USD MILLION) 60
- TABLE 13 CANADA TABLET PC MARKET, BY DISTRIBUTION CHANNEL, 2018–2030 (USD MILLION) 60
- TABLE 14 CANADA TABLET PC MARKET, BY END-USER, 2018–2030 (USD MILLION) 61
- TABLE 15 MEXICO TABLET PC MARKET, BY OPERATING SYSTEM, 2018–2030 (USD MILLION) 61
- TABLE 16 MEXICO TABLET PC MARKET, BY DISTRIBUTION CHANNEL, 2018–2030 (USD MILLION) 61
- TABLE 17 MEXICO TABLET PC MARKET, BY END-USER, 2018–2030 (USD MILLION) 61
- TABLE 18 EUROPE TABLET PC MARKET, BY COUNTRY, 2018–2030 (USD MILLION) 63
- TABLE 19 EUROPE TABLET PC MARKET, BY OPERATING SYSTEM, 2018–2030 (USD MILLION) 64
- TABLE 20 EUROPE TABLET PC MARKET, BY DISTRIBUTION CHANNEL, 2018–2030 (USD MILLION) 64
- TABLE 21 EUROPE TABLET PC MARKET, BY END-USER, 2018–2030 (USD MILLION) 65
- TABLE 22 GERMANY TABLET PC MARKET, BY OPERATING SYSTEM, 2018–2030 (USD MILLION) 65
- TABLE 23 GERMANY TABLET PC MARKET, BY DISTRIBUTION CHANNEL, 2018–2030 (USD MILLION) 66
- TABLE 24 GERMANY TABLET PC MARKET, BY END-USER, 2018–2030 (USD MILLION) 66
- TABLE 25 UK TABLET PC MARKET, BY OPERATING SYSTEM, 2018–2030 (USD MILLION) 66
- TABLE 26 UK TABLET PC MARKET, BY DISTRIBUTION CHANNEL, 2018–2030 (USD MILLION) 66
- TABLE 27 UK TABLET PC MARKET, BY END-USER, 2018–2030 (USD MILLION) 67
- TABLE 28 FRANCE TABLET PC MARKET, BY OPERATING SYSTEM, 2018–2030 (USD MILLION) 67
- TABLE 29 FRANCE TABLET PC MARKET, BY DISTRIBUTION CHANNEL, 2018–2030 (USD MILLION) 67
- TABLE 30 FRANCE TABLET PC MARKET, BY END-USER, 2018–2030 (USD MILLION) 67
- TABLE 31 ITALY TABLET PC MARKET, BY OPERATING SYSTEM, 2018–2030 (USD MILLION) 68
- TABLE 32 ITALY TABLET PC MARKET, BY DISTRIBUTION CHANNEL, 2018–2030 (USD MILLION) 68
- TABLE 33 ITALY TABLET PC MARKET, BY END-USER, 2018–2030 (USD MILLION) 68
- TABLE 34 REST OF EUROPE TABLET PC MARKET, BY OPERATING SYSTEM, 2018–2030 (USD MILLION) 69
- TABLE 35 REST OF EUROPE TABLET PC MARKET, BY DISTRIBUTION CHANNEL, 2018–2030 (USD MILLION) 69
- TABLE 36 REST OF EUROPE TABLET PC MARKET, BY END-USER, 2018–2030 (USD MILLION) 69
- TABLE 37 ASIA-PACIFIC TABLET PC MARKET, BY COUNTRY, 2018–2030 (USD MILLION) 71
- TABLE 38 ASIA-PACIFIC TABLET PC MARKET, BY OPERATING SYSTEM, 2018–2030 (USD MILLION) 72
- TABLE 39 ASIA-PACIFIC TABLET PC MARKET, BY DISTRIBUTION CHANNEL, 2018–2030 (USD MILLION) 72
- TABLE 40 ASIA-PACIFIC TABLET PC MARKET, BY END-USER, 2018–2030 (USD MILLION) 73
- TABLE 41 CHINA TABLET PC MARKET, BY OPERATING SYSTEM, 2018–2030 (USD MILLION) 73
- TABLE 42 CHINA TABLET PC MARKET, BY DISTRIBUTION CHANNEL, 2018–2030 (USD MILLION) 74
- TABLE 43 CHINA TABLET PC MARKET, BY END-USER, 2018–2030 (USD MILLION) 74
- TABLE 44 INDIA TABLET PC MARKET, BY OPERATING SYSTEM, 2018–2030 (USD MILLION) 74
- TABLE 45 INDIA TABLET PC MARKET, BY DISTRIBUTION CHANNEL, 2018–2030 (USD MILLION) 74
- TABLE 46 INDIA TABLET PC MARKET, BY END-USER, 2018–2030 (USD MILLION) 75
- TABLE 47 JAPAN TABLET PC MARKET, BY OPERATING SYSTEM, 2018–2030 (USD MILLION) 75
- TABLE 48 JAPAN TABLET PC MARKET, BY DISTRIBUTION CHANNEL, 2018–2030 (USD MILLION) 75
- TABLE 49 JAPAN TABLET PC MARKET, BY END-USER, 2018–2030 (USD MILLION) 75
- TABLE 50 SOUTH KOREA TABLET PC MARKET, BY OPERATING SYSTEM, 2018–2030 (USD MILLION) 76
- TABLE 51 SOUTH KOREA TABLET PC MARKET, BY DISTRIBUTION CHANNEL, 2018–2030 (USD MILLION) 76
- TABLE 52 SOUTH KOREA TABLET PC MARKET, BY END-USER, 2018–2030 (USD MILLION) 76
- TABLE 53 REST OF ASIA-PACIFIC TABLET PC MARKET, BY OPERATING SYSTEM, 2018–2030 (USD MILLION) 77
- TABLE 54 REST OF ASIA-PACIFIC TABLET PC MARKET, BY DISTRIBUTION CHANNEL, 2018–2030 (USD MILLION) 77
- TABLE 55 REST OF ASIA-PACIFIC TABLET PC MARKET, BY END-USER, 2018–2030 (USD MILLION) 77
- TABLE 56 MIDDLE EAST & AFRICA TABLET PC MARKET, BY COUNTRY, 2018–2030 (USD MILLION) 80
- TABLE 57 MIDDLE EAST & AFRICA TABLET PC MARKET, BY OPERATING SYSTEM, 2018–2030 (USD MILLION) 81
- TABLE 58 MIDDLE EAST & AFRICA TABLET PC MARKET, BY DISTRIBUTION CHANNEL, 2018–2030 (USD MILLION) 81
- TABLE 59 MIDDLE EAST & AFRICA TABLET PC MARKET, BY END-USER, 2018–2030 (USD MILLION) 82
- TABLE 60 SAUDI ARABIA TABLET PC MARKET, BY OPERATING SYSTEM, 2018–2030 (USD MILLION) 82
- TABLE 61 SAUDI ARABIA TABLET PC MARKET, BY DISTRIBUTION CHANNEL, 2018–2030 (USD MILLION) 83
- TABLE 62 SAUDI ARABIA TABLET PC MARKET, BY END-USER, 2018–2030 (USD MILLION) 83
- TABLE 63 UAE TABLET PC MARKET, BY OPERATING SYSTEM, 2018–2030 (USD MILLION) 83
- TABLE 64 UAE TABLET PC MARKET, BY DISTRIBUTION CHANNEL, 2018–2030 (USD MILLION) 83
- TABLE 65 UAE TABLET PC MARKET, BY END-USER, 2018–2030 (USD MILLION) 84
- TABLE 66 SOUTH AFRICA TABLET PC MARKET, BY OPERATING SYSTEM, 2018–2030 (USD MILLION) 84
- TABLE 67 SOUTH AFRICA TABLET PC MARKET, BY DISTRIBUTION CHANNEL, 2018–2030 (USD MILLION) 84
- TABLE 68 SOUTH AFRICA TABLET PC MARKET, BY END-USER, 2018–2030 (USD MILLION) 85
- TABLE 69 REST OF MIDDLE EAST & AFRICA TABLET PC MARKET, BY OPERATING SYSTEM, 2018–2030 (USD MILLION) 85
- TABLE 70 REST OF MIDDLE EAST & AFRICA TABLET PC MARKET, BY DISTRIBUTION CHANNEL, 2018–2030 (USD MILLION) 85
- TABLE 71 REST OF MIDDLE EAST & AFRICA TABLET PC MARKET, BY END-USER, 2018–2030 (USD MILLION) 86
- TABLE 72 LATIN AMERICA TABLET PC MARKET, BY COUNTRY, 2018–2030 (USD MILLION) 88
- TABLE 73 LATIN AMERICA TABLET PC MARKET, BY OPERATING SYSTEM, 2018–2030 (USD MILLION) 89
- TABLE 74 LATIN AMERICA TABLET PC MARKET, BY DISTRIBUTION CHANNEL, 2018–2030 (USD MILLION) 89
- TABLE 75 LATIN AMERICA TABLET PC MARKET, BY END-USER, 2018–2030 (USD MILLION) 90
- TABLE 76 BRAZIL TABLET PC MARKET, BY OPERATING SYSTEM, 2018–2030 (USD MILLION) 90
- TABLE 77 BRAZIL TABLET PC MARKET, BY DISTRIBUTION CHANNEL, 2018–2030 (USD MILLION) 91
- TABLE 78 BRAZIL TABLET PC MARKET, BY END-USER, 2018–2030 (USD MILLION) 91
- TABLE 79 REST OF LATIN AMERICA TABLET PC MARKET, BY OPERATING SYSTEM, 2018–2030 (USD MILLION) 91
- TABLE 80 REST OF LATIN AMERICA TABLET PC MARKET, BY DISTRIBUTION CHANNEL, 2018–2030 (USD MILLION) 92
- TABLE 81 REST OF LATIN AMERICA TABLET PC MARKET, BY END-USER, 2018–2030 (USD MILLION) 92
- TABLE 82 PRODUCT LAUNCH 96
- TABLE 83 PRODUCT EXPANSION 99
- TABLE 84 OTHERS 99
- TABLE 85 ACER INC: PRODUCTS OFFERED 102
- TABLE 86 ACER INC: KEY DEVELOPMENTS 103
- TABLE 87 APPLE INC: PRODUCTS OFFERED 106
- TABLE 88 APPLE INC: KEY DEVELOPMENTS 106
- TABLE 89 HEWLETT-PACKARD COMPANY: PRODUCTS OFFERED 110
- TABLE 90 HEWLETT-PACKARD COMPANY: KEY DEVELOPMENTS 111
- TABLE 91 HUAWEI TECHNOLOGIES: PRODUCTS OFFERED 114
- TABLE 92 HEWLETT-PACKARD COMPANY: KEY DEVELOPMENTS 114
- TABLE 93 LENOVO GROUP: PRODUCTS OFFERED 118
- TABLE 94 LENOVO GROUP: KEY DEVELOPMENTS 120
- TABLE 95 DYNABOOK: PRODUCTS OFFERED 123
- TABLE 96 MICROSOFT CORPORATION.: PRODUCTS OFFERED 126
- TABLE 97 MICROSOFT CORPORATION: KEY DEVELOPMENTS 127
- TABLE 98 NOKIA CORPORATION: PRODUCTS OFFERED 130
- TABLE 99 NOKIA CORPORATION: KEY DEVELOPMENTS 130
- TABLE 100 SAMSUNG ELECTRONICS CO LTD: SOLUTIONS OFFERED 134
- TABLE 101 SAMSUNG ELECTRONICS CO LTD: KEY DEVELOPMENTS 135
- TABLE 102 REALME: PRODUCTS OFFERED 137
- TABLE 103 REALME: KEY DEVELOPMENTS 137
- TABLE 104 XIAOMI: PRODUCTS OFFERED 139
- TABLE 105 XIAOMI: KEY DEVELOPMENTS 140
- TABLE 106 FUJITSU LTD: PRODUCTS OFFERED 143
- TABLE 107 XIAOMI: KEY DEVELOPMENTS 144
- TABLE 108 AMAZON: PRODUCTS/SOLUTIONS/SERVICES OFFERED 147
- TABLE 109 AMAZON: KEY DEVELOPMENTS 147
- TABLE 110 CHUWI: PRODUCTS/SOLUTIONS/SERVICES OFFERED 149
- TABLE 111 CHUWI: KEY DEVELOPMENTS 150
- TABLE 112 LG ELECTRONICS : PRODUCTS/SOLUTIONS/SERVICES OFFERED 153
- TABLE 113 LG ELECTRONICS: KEY DEVELOPMENTS 153 LIST OF FIGURES
- FIGURE 1 MARKET SYNOPSIS 19
- FIGURE 2 MARKET ATTRACTIVENESS ANALYSIS 20
- FIGURE 3 GLOBAL TABLET PC MARKET: MARKET STRUCTURE 22
- FIGURE 4 BOTTOM-UP AND TOP-DOWN APPROACHES 27
- FIGURE 5 MARKET DYNAMIC ANALYSIS OF THE GLOBAL TABLET PC MARKET 30
- FIGURE 6 DRIVER IMPACT ANALYSIS 33
- FIGURE 7 RESTRAINTS IMPACT ANALYSIS 34
- FIGURE 8 VALUE CHAIN: GLOBAL TABLET PC MARKET 40
- FIGURE 9 Porter's Five Forces Analysis OF THE TABLET PC MARKET 42
- FIGURE 10 GLOBAL TABLET PC MARKET, BY OPERATING SYSTEM, 2021 (% SHARE) 45
- FIGURE 11 GLOBAL TABLET PC MARKET, BY OPERATING SYSTEM, 2021 VS 2030 (USD MILLION) 45
- FIGURE 12 GLOBAL TABLET PC MARKET, BY DISTRIBUTION CHANNEL, 2021 (% SHARE) 47
- FIGURE 13 GLOBAL TABLET PC MARKET, BY DISTRIBUTION CHANNEL, 2021 VS 2030 (USD MILLION) 47
- FIGURE 14 GLOBAL TABLET PC MARKET, BY END-USER, 2021 (% SHARE) 50
- FIGURE 15 GLOBAL TABLET PC MARKET, BY END-USER, 2021 VS 2030 (USD MILLION) 50
- FIGURE 16 GLOBAL TABLET PC MARKET, BY REGION, 2021 (% SHARE) 53
- FIGURE 17 GLOBAL TABLET PC MARKET, BY REGION, 2021 VS 2030 (USD MILLION) 53
- FIGURE 18 NORTH AMERICA TABLET PC MARKET, BY COUNTRY, 2021 (% SHARE) 56
- FIGURE 19 NORTH AMERICA TABLET PC MARKET, BY COUNTRY, 2021 VS 2030 (USD MILLION) 56
- FIGURE 20 NORTH AMERICA TABLET PC MARKET, BY OPERATING SYSTEM, 2018-2030 (USD MILLION) 57
- FIGURE 21 NORTH AMERICA TABLET PC MARKET, BY DISTRIBUTION CHANNEL, 2018-2030 (USD MILLION) 58
- FIGURE 22 NORTH AMERICA TABLET PC MARKET, BY END-USER, 2018-2030 (USD MILLION) 59
- FIGURE 23 EUROPE TABLET PC MARKET, BY COUNTRY, 2021 (% SHARE) 62
- FIGURE 24 EUROPE TABLET PC MARKET, BY COUNTRY, 2021 VS 2030 (USD MILLION) 63
- FIGURE 25 EUROPE TABLET PC MARKET, BY OPERATING SYSTEM, 2018-2030 (USD MILLION) 63
- FIGURE 26 EUROPE TABLET PC MARKET, BY DISTRIBUTION CHANNEL, 2018-2030 (USD MILLION) 64
- FIGURE 27 EUROPE TABLET PC MARKET, BY END-USER, 2018-2030 (USD MILLION) 65
- FIGURE 28 ASIA-PACIFIC TABLET PC MARKET, BY COUNTRY, 2021 (% SHARE) 70
- FIGURE 29 ASIA-PACIFIC TABLET PC MARKET, BY COUNTRY, 2021 VS 2030 (USD MILLION) 71
- FIGURE 30 ASIA-PACIFIC TABLET PC MARKET, BY OPERATING SYSTEM, 2018-2030 (USD MILLION) 71
- FIGURE 31 ASIA-PACIFIC TABLET PC MARKET, BY DISTRIBUTION CHANNEL, 2018-2030 (USD MILLION) 72
- FIGURE 32 ASIA-PACIFIC TABLET PC MARKET, BY END-USER, 2018-2030 (USD MILLION) 73
- FIGURE 33 MIDDLE EAST & AFRICA TABLET PC MARKET, BY COUNTRY, 2021 (% SHARE) 79
- FIGURE 34 MIDDLE EAST & AFRICA TABLET PC MARKET, BY COUNTRY, 2021 VS 2030 (USD MILLION) 79
- FIGURE 35 MIDDLE EAST & AFRICA TABLET PC MARKET, BY OPERATING SYSTEM, 2018-2030 (USD MILLION) 80
- FIGURE 36 MIDDLE EAST & AFRICA TABLET PC MARKET, BY DISTRIBUTION CHANNEL, 2018-2030 (USD MILLION) 81
- FIGURE 37 MIDDLE EAST & AFRICA TABLET PC MARKET, BY END-USER, 2018-2030 (USD MILLION) 82
- FIGURE 38 LATIN AMERICA TABLET PC MARKET, BY COUNTRY, 2021 (% SHARE) 87
- FIGURE 39 LATIN AMERICA TABLET PC MARKET, BY COUNTRY, 2021 VS 2030 (USD MILLION) 88
- FIGURE 40 LATIN AMERICA TABLET PC MARKET, BY OPERATING SYSTEM, 2018-2030 (USD MILLION) 88
- FIGURE 41 LATIN AMERICA TABLET PC MARKET, BY DISTRIBUTION CHANNEL, 2018-2030 (USD MILLION) 89
- FIGURE 42 LATIN AMERICA TABLET PC MARKET, BY END-USER, 2018-2030 (USD MILLION) 90
- FIGURE 43 TABLET PC MARKET: COMPETITIVE BENCHMARKING 94
- FIGURE 44 VENDOR SHARE ANALYSIS, 2021 (%) 95
- FIGURE 45 ACER INC: FINANCIAL OVERVIEW SNAPSHOT 101
- FIGURE 46 ACER INC: SWOT ANALYSIS 103
- FIGURE 47 APPLE INC: FINANCIAL OVERVIEW SNAPSHOT 105
- FIGURE 48 APPLE INC: SWOT ANALYSISS 108
- FIGURE 49 HEWLETT-PACKARD DEVELOPMENT COMPANY, L.P OVERVIEW SNAPSHOT 109
- FIGURE 50 HEWLETT-PACKARD COMPANY: SWOT ANALYSISS 111
- FIGURE 51 HUAWEI TECHNOLOGIES: FINANCIAL OVERVIEW SNAPSHOT 113
- FIGURE 52 HUAWEI TECHNOLOGIES: SWOT ANALYSIS 114
- FIGURE 53 LENOVO GROUP: FINANCIAL OVERVIEW SNAPSHOT 117
- FIGURE 54 LENOVO GROUP: SWOT ANALYSIS 120
- FIGURE 55 DYNABOOK (SHARP): FINANCIAL OVERVIEW SNAPSHOT 122
- FIGURE 56 DYNABOOK: SWOT ANALYSIS 123
- FIGURE 57 MICROSOFT CORPORATION: FINANCIAL OVERVIEW SNAPSHOT 125
- FIGURE 58 MICROSOFT CORPORATION: SWOT ANALYSIS 127
- FIGURE 59 NOKIA CORPORATION: FINANCIAL OVERVIEW SNAPSHOT 129
- FIGURE 60 NOKIA CORPORATION: SWOT ANALYSIS 131
- FIGURE 61 SAMSUNG ELECTRONICS CO LTD: FINANCIAL OVERVIEW SNAPSHOT 133
- FIGURE 62 SAMSUNG ELECTRONICS CO LTD: SWOT ANALYSIS 136
- FIGURE 63 XIAOMI: FINANCIAL OVERVIEW SNAPSHOT 139
- FIGURE 64 XIOMI: SWOT ANALYSIS 140
- FIGURE 65 FUJITSU LTD: FINANCIAL OVERVIEW SNAPSHOT 142
- FIGURE 66 FUJITSU LTD: SWOT ANALYSIS 144
- FIGURE 67 AMAZON: FINANCIAL OVERVIEW SNAPSHOT 146
- FIGURE 68 AMAZON: SWOT ANALYSIS 148
- FIGURE 69 LG ELECTRONICS: FINANCIAL OVERVIEW SNAPSHOT 152
- FIGURE 70 LG ELECTRONICS: SWOT ANALYSIS 153 LIST OF ABBREVIATION Abbreviation Full Form US United States UK United Kingdom ME&A Middle East & Africa RoW Rest of the World CAGR Compound Annual Growth Rate
Tablet PC Market Segmentation
Global Tablet PC, By Operating System Outlook (USD Million, 2018-2030)
- Android
- IOS
- Windows
Global Tablet PC, By Distribution Channel (USD Million, 2018-2030)
- Supermarkets/ Hypermarkets
- Independent Retailers
- Online Sales
Global Tablet PC, By End-User (USD Million, 2018-2030)
- Individual User
- Corporate User
- School & Colleges
- Others
Global Tablet PC Regional Outlook (USD Million, 2018-2030)
- North America Outlook (USD Million, 2018-2030)
- North America Tablet PC, By Operating System Outlook (USD Million, 2018-2030)
- Android
- IOS
- Windows
- North America Tablet PC, By Distribution Channel (USD Million, 2018-2030)
- Supermarkets/ Hypermarkets
- Independent Retailers
- Online Sales
- North America Tablet PC, By End-User (USD Million, 2018-2030)
- Individual User
- Corporate User
- School & Colleges
- Others
- US Outlook (USD Million, 2018-2030)
- US Tablet PC, By Operating System Outlook (USD Million, 2018-2030)
- Android
- IOS
- Windows
- US Tablet PC, By Distribution Channel (USD Million, 2018-2030)
- Supermarkets/ Hypermarkets
- Independent Retailers
- Online Sales
- US Tablet PC, By End-User (USD Million, 2018-2030)
- Individual User
- Corporate User
- School & Colleges
- Others
- Canada Outlook (USD Million, 2018-2030)
- Canada Tablet PC, By Operating System Outlook (USD Million, 2018-2030)
- Android
- IOS
- Windows
- Canada Tablet PC, By Distribution Channel (USD Million, 2018-2030)
- Supermarkets/ Hypermarkets
- Independent Retailers
- Online Sales
- Canada Tablet PC, By End-User (USD Million, 2018-2030)
- Individual User
- Corporate User
- School & Colleges
- Others
- Europe Outlook (USD Million, 2018-2030)
- Europe Tablet PC, By Operating System Outlook (USD Million, 2018-2030)
- Android
- IOS
- Windows
- Europe Tablet PC, By Distribution Channel (USD Million, 2018-2030)
- Supermarkets/ Hypermarkets
- Independent Retailers
- Online Sales
- Europe Tablet PC, By End-User (USD Million, 2018-2030)
- Individual User
- Corporate User
- School & Colleges
- Others
- Germany Outlook (USD Million, 2018-2030)
- Germany Tablet PC, By Operating System Outlook (USD Million, 2018-2030)
- Android
- IOS
- Windows
- Germany Tablet PC, By Distribution Channel (USD Million, 2018-2030)
- Supermarkets/ Hypermarkets
- Independent Retailers
- Online Sales
- Germany Tablet PC, By End-User (USD Million, 2018-2030)
- Individual User
- Corporate User
- School & Colleges
- Others
- France Outlook (USD Million, 2018-2030)
- France Tablet PC, By Operating System Outlook (USD Million, 2018-2030)
- Android
- IOS
- Windows
- France Tablet PC, By Distribution Channel (USD Million, 2018-2030)
- Supermarkets/ Hypermarkets
- Independent Retailers
- Online Sales
- France Tablet PC, By End-User (USD Million, 2018-2030)
- Individual User
- Corporate User
- School & Colleges
- Others
- UK Outlook (USD Million, 2018-2030)
- UK Tablet PC, By Operating System Outlook (USD Million, 2018-2030)
- Android
- IOS
- Windows
- UK Tablet PC, By Distribution Channel (USD Million, 2018-2030)
- Supermarkets/ Hypermarkets
- Independent Retailers
- Online Sales
- UK Tablet PC, By End-User (USD Million, 2018-2030)
- Individual User
- Corporate User
- School & Colleges
- Others
- Italy Outlook (USD Million, 2018-2030)
- Italy Tablet PC, By Operating System Outlook (USD Million, 2018-2030)
- Android
- IOS
- Windows
- Italy Tablet PC, By Distribution Channel (USD Million, 2018-2030)
- Supermarkets/ Hypermarkets
- Independent Retailers
- Online Sales
- Italy Tablet PC, By End-User (USD Million, 2018-2030)
- Individual User
- Corporate User
- School & Colleges
- Others
- Rest of Europe Outlook (USD Million, 2018-2030)
- Rest of Europe Tablet PC, By Operating System Outlook (USD Million, 2018-2030)
- Android
- IOS
- Windows
- Rest of Europe Tablet PC, By Distribution Channel (USD Million, 2018-2030)
- Supermarkets/ Hypermarkets
- Independent Retailers
- Online Sales
- Rest of Europe Tablet PC, By End-User (USD Million, 2018-2030)
- Individual User
- Corporate User
- School & Colleges
- Others
- Asia-Pacific Outlook (USD Million, 2018-2030)
- Asia-Pacific Tablet PC, By Operating System Outlook (USD Million, 2018-2030)
- Android
- IOS
- Windows
- Asia-Pacific Tablet PC, By Distribution Channel (USD Million, 2018-2030)
- Supermarkets/ Hypermarkets
- Independent Retailers
- Online Sales
- Asia-Pacific Tablet PC, By End-User (USD Million, 2018-2030)
- Individual User
- Corporate User
- School & Colleges
- Others
- China Outlook (USD Million, 2018-2030)
- China Tablet PC, By Operating System Outlook (USD Million, 2018-2030)
- Android
- IOS
- Windows
- China Tablet PC, By Distribution Channel (USD Million, 2018-2030)
- Supermarkets/ Hypermarkets
- Independent Retailers
- Online Sales
- China Tablet PC, By End-User (USD Million, 2018-2030)
- Individual User
- Corporate User
- School & Colleges
- Others
- India Outlook (USD Million, 2018-2030)
- India Tablet PC, By Operating System Outlook (USD Million, 2018-2030)
- Android
- IOS
- Windows
- India Tablet PC, By Distribution Channel (USD Million, 2018-2030)
- Supermarkets/ Hypermarkets
- Independent Retailers
- Online Sales
- India Tablet PC, By End-User (USD Million, 2018-2030)
- Individual User
- Corporate User
- School & Colleges
- Others
- Japan Outlook (USD Million, 2018-2030)
- Japan Tablet PC, By Operating System Outlook (USD Million, 2018-2030)
- Android
- IOS
- Windows
- Japan Tablet PC, By Distribution Channel (USD Million, 2018-2030)
- Supermarkets/ Hypermarkets
- Independent Retailers
- Online Sales
- Japan Tablet PC, By End-User (USD Million, 2018-2030)
- Individual User
- Corporate User
- School & Colleges
- Others
- South Korea Outlook (USD Million, 2018-2030)
- South Korea Tablet PC, By Operating System Outlook (USD Million, 2018-2030)
- Android
- IOS
- Windows
- South Korea Tablet PC, By Distribution Channel (USD Million, 2018-2030)
- Supermarkets/ Hypermarkets
- Independent Retailers
- Online Sales
- South Korea Tablet PC, By End-User (USD Million, 2018-2030)
- Individual User
- Corporate User
- School & Colleges
- Others
- Australia Outlook (USD Million, 2018-2030)
- Australia Tablet PC, By Operating System Outlook (USD Million, 2018-2030)
- Android
- IOS
- Windows
- Australia Tablet PC, By Distribution Channel (USD Million, 2018-2030)
- Supermarkets/ Hypermarkets
- Independent Retailers
- Online Sales
- Australia Tablet PC, By End-User (USD Million, 2018-2030)
- Individual User
- Corporate User
- School & Colleges
- Others
- Rest of Asia-Pacific Outlook (USD Million, 2018-2030)
- Rest of Asia-Pacific Tablet PC, By Operating System Outlook (USD Million, 2018-2030)
- Android
- IOS
- Windows
- Rest of Asia-Pacific Tablet PC, By Distribution Channel (USD Million, 2018-2030)
- Supermarkets/ Hypermarkets
- Independent Retailers
- Online Sales
- Rest of Asia-Pacific Tablet PC, By End-User (USD Million, 2018-2030)
- Individual User
- Corporate User
- School & Colleges
- Others
- Rest of the World Tablet PC, By Operating System Outlook (USD Million, 2018-2030)
- Android
- IOS
- Windows
- Rest of the World Tablet PC, By Distribution Channel (USD Million, 2018-2030)
- Supermarkets/ Hypermarkets
- Independent Retailers
- Online Sales
- Rest of the World Tablet PC, By End-User (USD Million, 2018-2030)
- Individual User
- Corporate User
- School & Colleges
- Others
- Middle East & Africa Outlook (USD Million, 2018-2030)
- Middle East & Africa Tablet PC, By Operating System Outlook (USD Million, 2018-2030)
- Android
- IOS
- Windows
- Middle East & Africa Tablet PC, By Distribution Channel (USD Million, 2018-2030)
- Supermarkets/ Hypermarkets
- Independent Retailers
- Online Sales
- Middle East & Africa Tablet PC, By End-User (USD Million, 2018-2030)
- Individual User
- Corporate User
- School & Colleges
- Others
- South America Outlook (USD Million, 2018-2030)
- South America Tablet PC, By Operating System Outlook (USD Million, 2018-2030)
- Android
- IOS
- Windows
- South America Tablet PC, By Distribution Channel (USD Million, 2018-2030)
- Supermarkets/ Hypermarkets
- Independent Retailers
- Online Sales
- South America Tablet PC, By End-User (USD Million, 2018-2030)
- Individual User
- Corporate User
- School & Colleges
- Others

Free Sample Request
Kindly complete the form below to receive a free sample of this Report
Customer Strories
“I am very pleased with how market segments have been defined in a relevant way for my purposes (such as "Portable Freezers & refrigerators" and "last-mile"). In general the report is well structured. Thanks very much for your efforts.”
Leave a Comment