Telecom Power System Market (2026 - 2035)

Telecom Power System Market Size, Share and Research Report By Component (Rectifiers, Converters, Controllers & Monitoring, Fuel Cells), By Power Source (Grid-Connected, Diesel Generator, Hybrid Solar-Diesel, Hybrid Solar-Battery), By Energy Storage Technology (VRLA Battery, Lithium-Ion, Supercapacitors), By Network Generation (4G/LTE, 5G NR, Legacy (2G/3G)), By System Architecture (DC Power Systems, AC Power Systems, Hybrid AC/DC), By Power Range (Low (20 kW)), By Output Power Configuration (Less Than 2 kW, 2–10 kW, 10–20 kW, More Than 20 kW) and By Region (North America, Europe, Asia-Pacific, South America, Middle East & Africa) – Industry Forecast to 2035.
ID: MRFR/SEM/1755-HCR
100 Pages
Ankit Gupta
Last Updated: July 24, 2026
Telecom Power System Market
Market Size
Forecast Period2026-2035
CAGR (2026-2035)7.60%
2025 Market SizeUSD 5.72 Billion
2035 Market SizeUSD 11.91 Billion
Key Players
Vertiv
Huawei Digital Power
Delta Electronics
Eaton
ZTE
Schneider Electric
Opportunities
  • Hydrogen Fuel Cells for Zero-Emission Backup
  • Energy-as-a-Service Models for Tower Companies
  • Emerging-Market Leapfrog Through Solar-Hybrid Kits

Telecom Power System Market Summary

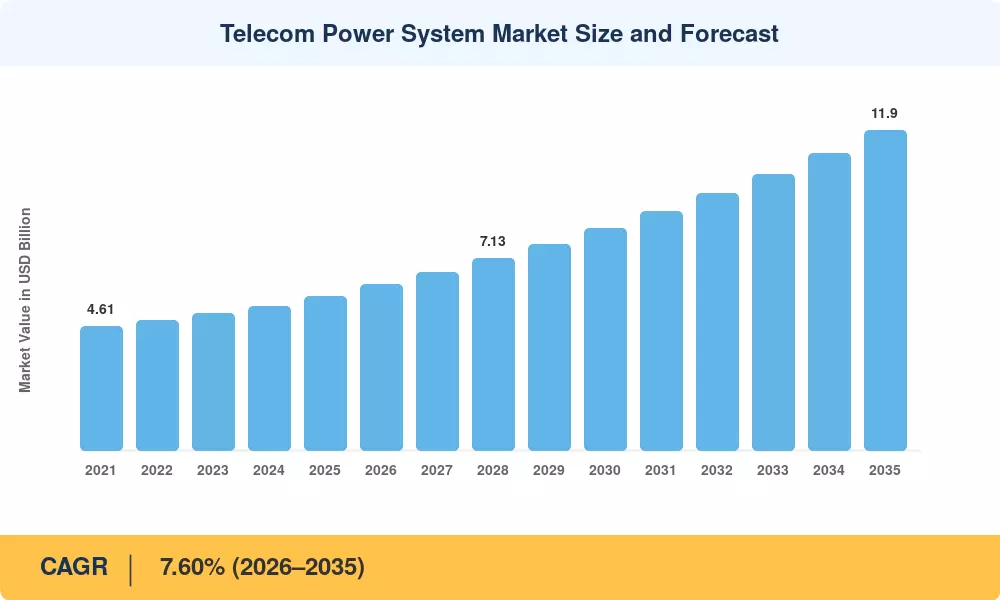
The Telecom Power System Market reached a valuation of USD 5.72 Billion in 2025, driven by an unprecedented cycle of network densification and energy-efficiency mandates reshaping operator capital expenditure. Starting from USD 6.16 Billion in 2026, the Telecom Power System Market is projected to climb to USD 11.91 Billion by 2035, registering a CAGR of 7.60% across the forecast period. The rollout of 5G standalone architectures — each macro site drawing roughly double the power of its 4G predecessor — has forced operators worldwide to rethink their power infrastructure from the ground up [1].

The Telecom Power System Market is under a marked technological transformation. Traditional valve-regulated lead-acid (VRLA) battery banks and individual diesel generators are gradually being replaced by lithium-ion energy storage and hybrid solar-diesel systems. The GSMA estimates that the mobile industry consumed approximately 250 TWh of electricity in 2024, which represents about 0.6% of global electricity use, and operators have collectively committed to halve absolute emissions by 2030 [2]. These commitments are already beginning to translate into procurement changes: higher-efficiency rectifiers, modular DC power plants and intelligent energy-management controllers are now standard line items for new site builds, and legacy site retrofits alike.

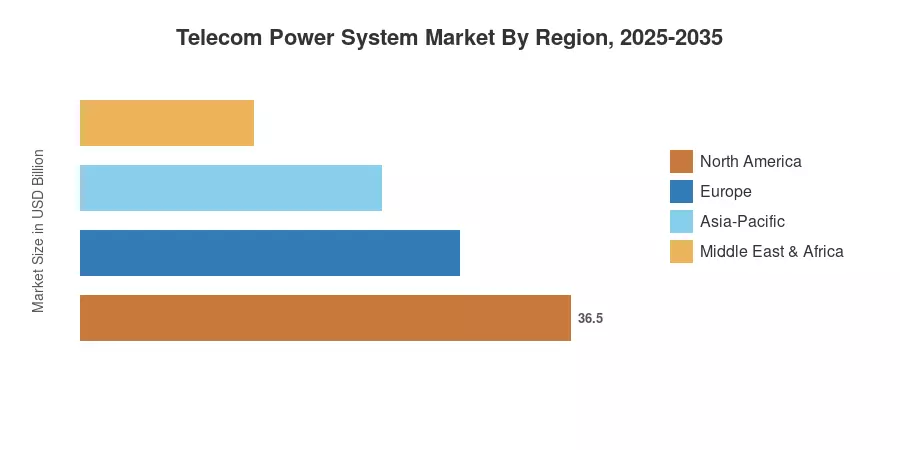
Asia-Pacific Telecom Power System Market is 37.6% market share owing to large rural connection initiatives in India and quick implementation of the 5G roadmap in China, South Korea and Japan. The region also witnesses the fastest development trajectory with a CAGR of 8.90% until 2035. In North America, which accounts for approximately 24.8% of 2025 revenue, investment in grid-resilience and climate-hardened power solutions is growing as extreme weather events become more frequent. The next decade will be shaped by the confluence of telecom power and edge computing infrastructure, creating new design paradigms for the whole value chain.


Key Report Takeaways

• By Component

  • Rectifiers accounted for 25.7% of the Telecom Power System Market in 2025, reflecting the critical role of AC-to-DC conversion in every macro and small-cell deployment.
  • Lithium-ion energy storage is positioned to expand at a 14.7% CAGR through 2035 as operators migrate away from VRLA platforms for lower lifecycle cost and higher energy density.
  • DC power plants held USD 3.20 billion in revenue during 2025, underscoring operator preference for simplified, high-efficiency architectures.

• By Network Generation

  • 4G/LTE networks retained 52.3% of Telecom Power System Market revenue in 2025, though that share will erode as 5G NR deployments accelerate at a 15.8% CAGR.


• By Power source

  • Grid-connected solutions captured the largest power-source share in 2025 at 50.8%, while hybrid solar-diesel configurations are gaining ground at a 12.7% CAGR.

• By Region

  • Asia-Pacific generated USD 2.15 Billion in 2025 revenue, reflecting the scale of India's BharatNet program and China's tower-sharing expansion.
  • North America's Telecom Power System Market is projected to reach a 7.30% CAGR through 2035, driven by wildfire-resilience retrofits and edge-site proliferation.


Market Size and Forecast (2021–2035)

Market Research Future constructed this forecast using a hybrid bottom-up/top-down methodology, triangulating operator capital expenditure filings, component-level shipment data from OEM annual reports, and macroeconomic telecom investment indices from the ITU and World Bank [3][4].
Telecom Power System Market Size and Forecast
Our Impact
Enabled $4.3B Revenue Impact for Fortune 500 and Leading Multinationals
Partnering with 2000+ Global Organizations Each Year
30K+ Citations by Top-Tier Firms in the Industry

Driver Impact Analysis

Driver ~% Impact on CAGR Geographic Relevance Impact Timeline
5G NR Densification & Macro Site Power Uplift 25–30% Global Short-term (≤2 yr)
Rural Electrification & Off-Grid Expansion 15–20% Asia-Pacific, Africa Medium-term (2–4 yr)
Lithium-Ion Battery Migration 12–15% Global Medium-term (2–4 yr)
Edge Computing & Micro Data Center Build-outs 10–14% North America, Europe Medium-term (2–4 yr)
Carbon-Reduction Mandates & ESG Reporting 8–12% Europe, North America Long-term (≥4 yr)
Hybrid Renewable Power Adoption 8–10% Africa, South America, ASEAN Long-term (≥4 yr)
Network Sharing & Tower-Company Consolidation 5–8% Global Short-term (≤2 yr)


5G NR Densification and Power Demand Escalation

A single 5G massive-MIMO radio device can consume 3–4 kW at peak load, approximately 2× the consumption of a 4G panel of similar capacity [1]. GSMA Intelligence expects that by 2028, the number of 5G base stations worldwide will exceed 15 million, and as a result, operators are purchasing higher-capacity rectifiers, larger battery reserves, and more powerful cooling systems at each macro and small-cell site [2]. The telecom power system market is driven by this power demand step-change, which is the single biggest near-term factor affecting component mix, site dimensioning and energy procurement strategy simultaneously.


Rural Connectivity and Off-Grid Deployments

India’s BharatNet Phase III program seeks to provide fiber and wireless broadband to over 640,000 villages, many of which do not have stable grid energy [6]. Similar initiatives in Sub-Saharan Africa, including the World Bank’s Digital Economy for Africa program, are fueling demand for self-contained solar-hybrid and fuel-cell power plants designed for isolated telecom sites. These installations require integrated energy management, remote monitoring and extended-autonomy battery banks, creating a unique product category in the Telecom Power System Market.


Lithium-Ion Battery Transition

VRLA batteries still dominate the installed base, yet lithium-ion's 8–10 year service life versus 3–5 years for VRLA is shifting new-site procurement decisively. BloombergNEF data indicates lithium-ion pack prices fell below USD 130/kWh in 2024, narrowing the upfront cost gap against VRLA to less than 20% while delivering 40–50% lower total cost of ownership over the system lifetime [7]. This economic crossover is expanding lithium-ion's share in the Telecom Power System Market at an accelerating rate.

Edge Computing and Micro Data Center Power Requirements

Operators deploying multi-access edge computing (MEC) nodes at cell-site aggregation points are adding 5–15 kW of IT load to locations originally dimensioned for radio equipment only [9]. The Open Compute Project's telecom-edge reference designs specify 48V DC power feeds, advanced thermal management, and dual-path redundancy — requirements that directly expand the addressable Telecom Power System Market for higher-kW-class power shelves and integrated cooling solutions.


Restraints Impact Analysis

The restraint impacts below are directional estimates representing headwinds that temper growth. They do not subtract linearly from the published CAGR.

Restraint ~% Negative Impact on CAGR Geographic Relevance Impact Timeline
Grid Instability and Volatile Energy Costs –8 to –12% Africa, South Asia Medium-term
Supply Chain Bottlenecks for Semiconductors –5 to –8% Global Short-term
High Upfront Cost of Hybrid/Renewable Systems –4 to –7% Emerging Markets Medium-term
Regulatory Fragmentation in Permitting –3 to –5% Europe, Latin America Long-term
Legacy Site Retrofit Complexity –2 to –4% Global Long-term


Grid Instability and Volatile Energy Costs

In markets such as Nigeria, Pakistan, and Bangladesh, grid availability at tower sites can fall below 8 hours per day, forcing operators to rely on diesel generators that account for up to 30% of network operating expenditure [13]. Diesel price volatility further erodes return-on-investment calculations for new deployments, causing some operators to delay site builds or accept lower redundancy levels. This dynamic constrains the addressable Telecom Power System Market in regions where demand potential is otherwise substantial.

Semiconductor and Component Supply Disruptions

Power rectifiers, DC-DC converters, and battery management systems depend on specialized power semiconductor devices — IGBTs, SiC MOSFETs, and GaN transistors — whose production capacity remains concentrated in a handful of foundries [14]. Lead times for custom telecom power modules extended to 26–40 weeks during 2022–2023 and have only partially normalized. Extended lead times increase project costs and slow site deployments, capping near-term volume growth in the Telecom Power System Market.

High Upfront Capital for Renewable-Hybrid Systems

While solar-diesel and solar-battery hybrid systems deliver compelling 7–10 year payback profiles, their upfront capital requirement can be 40–60% higher than a conventional grid-plus-diesel configuration [11]. In price-sensitive emerging markets, towercos and operators often lack the balance-sheet capacity or financing instruments to absorb the incremental cost, limiting adoption despite favorable lifecycle economics.


Telecom Power System Market Opportunities

Hydrogen Fuel Cells for Zero-Emission Backup

Fuel cell systems using green hydrogen or methanol reformers are emerging as a viable path to eliminate diesel dependency at critical and urban sites where noise and emission regulations are tightening. Several European operators are piloting 5–10 kW proton-exchange membrane (PEM) fuel cells, and the European Clean Hydrogen Alliance targets 6 GW of electrolyzer capacity by 2030, potentially lowering hydrogen costs enough to make telecom fuel-cell deployments commercially routine [17].

Energy-as-a-Service Models for Tower Companies

Independent tower companies — controlling over 60% of global tower inventory — are increasingly bundling power procurement and management as a service, creating a subscription-based revenue layer atop equipment sales. This model shifts risk from mobile operators to towercos and opens the Telecom Power System Market to financial investors seeking stable, infrastructure-grade returns[12].

Emerging-Market Leapfrog Through Solar-Hybrid Kits

Sub-Saharan Africa and Southeast Asia, where over 40% of tower sites still depend on diesel-only power, represent a greenfield opportunity for modular solar-hybrid kits that bundle PV panels, lithium-ion storage, and intelligent controllers in containerized form factors [11]. The World Bank's USD 2 Billion Digital Economy for Africa initiative is co-financing telecom infrastructure in 30+ countries, directly supporting power-system upgrades at rural and peri-urban sites[18].

AI-Driven Energy Management and Predictive Maintenance

Machine-learning algorithms analyzing real-time load profiles, weather data, and grid-availability patterns can optimize generator run-time, battery cycling, and renewable-energy harvest — cutting energy costs by 15–25% at pilot sites [9]. This intelligence layer creates a software-value tier within the Telecom Power System Market, allowing equipment vendors to capture recurring licensing revenue alongside hardware sales.

Convergence of Telecom Power and Edge Infrastructure

As operators co-locate MEC servers with radio equipment, integrated power-and-cooling cabinets that serve both workloads are displacing siloed telecom and IT power systems. Vendors offering converged solutions — combining 48V DC distribution, UPS-grade battery backup, and precision cooling in a single rack — can address a combined telecom-plus-edge addressable market that Market Research Future estimates is 20–25% larger than the telecom-only segment[9].


Telecom Power System Market Future Outlook

AI-Optimized Autonomous Power Management

By 2030, most Tier-1 operators will deploy AI-based site energy controllers capable of dynamically balancing grid draw, battery discharge, solar harvest, and generator run-time without human intervention. Pilot programs by Vodafone and Telefónica have demonstrated 18–22% energy-cost reduction using reinforcement-learning algorithms that adapt to real-time tariff structures and weather forecasts [9]. This autonomy layer will become a standard feature expectation in the Telecom Power System Market.

Electrification Supercycle and Grid-Edge Convergence

The IEA projects global electricity demand to grow by 75% between 2024 and 2040, creating grid-capacity constraints that will push telecom operators toward on-site generation, storage, and demand-response participation [4]. Operators managing large tower portfolios will increasingly function as distributed energy resources, selling stored energy back to utilities during peak demand — a business model already being trialed by independent towercos in India and Germany.

Modular and Containerized Power Architectures

Standardized, factory-assembled power containers — integrating rectifiers, batteries, solar charge controllers, and thermal management in a single ISO-format enclosure — are reducing site deployment time from weeks to days [16]. This modular approach aligns with the Telecom Power System Market's shift toward rapid, repeatable edge-site builds and enables operators to scale capacity incrementally as traffic demand grows.

ESG Reporting and Scope 2 Emission Reduction

Scope 2 electricity emissions account for 70–80% of a typical mobile operator's carbon footprint [10]. As mandatory climate-disclosure frameworks — including the EU's Corporate Sustainability Reporting Directive and the SEC's proposed climate-risk rules — take effect, operators face financial incentives to document and reduce energy consumption at every tower site. This regulatory momentum will sustain demand for high-efficiency and renewable-integrated systems across the Telecom Power System Market through 2035 and beyond.


Telecom Power System Market Segmentation

By Component

Segment Key Metric Primary Demand Driver
Rectifiers 25.7% share (2025) Core AC-to-DC conversion for every site type
Converters USD 0.92 Billion (2025) DC-DC step-down for radio and IT loads
Controllers & Monitoring 8.80% CAGR Remote energy management and predictive maintenance
Fuel Cells 13.7% CAGR Zero-emission backup at regulated urban sites


Rectifiers remain the backbone of the Telecom Power System Market because every grid-connected and hybrid-powered site requires efficient AC-to-DC conversion. The migration toward higher-power 5G radios is driving demand for rectifier modules rated at 4–6 kW per unit, up from the 2–3 kW modules common in 4G deployments. Fuel cells, while still a niche component, are attracting significant R&D investment as hydrogen infrastructure matures and operators seek to eliminate diesel dependency at noise- and emission-sensitive locations.

By Power Source

Segment Key Metric Primary Demand Driver
Grid-Connected 50.8% share (2025) Default choice where reliable grid exists
Diesel Generator USD 0.97 Billion (2025) Backup and primary power in grid-unstable regions
Hybrid Solar-Diesel 12.7% CAGR Cost optimization and emission reduction at off-grid sites
Hybrid Solar-Battery 13.2% CAGR Fully diesel-free operation in emerging markets


Grid-connected power remains dominant, but hybrid configurations are the fastest-growing category within the Telecom Power System Market as operators balance reliability requirements against carbon-reduction pledges. Solar-diesel hybrids reduce fuel consumption by 50–70% compared to diesel-only operation, while solar-battery systems eliminate fuel logistics entirely — a compelling proposition for the estimated 400,000+ off-grid tower sites across Africa and South Asia [11].

By Energy Storage Technology

Segment Key Metric Primary Demand Driver
VRLA Battery 58.6% share (2025) Low upfront cost and established supply chain
Lithium-Ion 14.7% CAGR Superior cycle life and total cost of ownership
Supercapacitors 9.20% CAGR Ride-through bridging for ultra-short outages


The Telecom Power System Market's storage segment is in the midst of a generational transition. VRLA batteries still account for the majority of installed capacity due to their lower initial price point, but lithium-ion is winning nearly all competitive evaluations for new deployments thanks to 3x longer cycle life, 30–40% smaller footprint, and integrated battery-management intelligence [7].

By Network Generation

Segment Key Metric Primary Demand Driver
4G/LTE 52.3% share (2025) Continued global coverage expansion
5G NR 15.8% CAGR Higher per-site power requirements and densification
Legacy (2G/3G) USD 0.31 Billion (2025) Sunset-phase maintenance and migration


The network generation segment is driven by continuous coverage expansion, densification, and sunset-phase maintenance. The dominating segment is 4G/LTE, holding a market share of 52.3% in 2025 due to ongoing global coverage expansion. Meanwhile, the fastest-growing segment is 5G NR, registering a robust 15.8% CAGR, propelled by higher per-site power requirements and densification. Legacy 2g/3g networks account for USD 0.31 billion in 2025.


By System Architecture

Segment Key Metric Primary Demand Driver
DC Power Systems 55.9% share (2025) Industry-standard –48V DC distribution for radio and transport
AC Power Systems USD 1.18 Billion (2025) Legacy sites and grid-direct configurations
Hybrid AC/DC 11.8% CAGR Edge-computing convergence requiring both AC and DC feeds


The system architecture segment focuses on DC distribution, grid-direct legacy configurations, and edge-computing convergence. The dominating segment is DC Power Systems, capturing a 55.9% share in 2025, driven by industry-standard -48V DC distribution for radio and transport. The fastest-growing segment is Hybrid AC/DC, expanding at an 11.8% CAGR fueled by edge-computing convergence requiring both power types, alongside AC Power Systems valued at USD 1.18 billion in 2025.

Regional Market Share Analysis

Region Key Metric Primary Investment Themes
Asia-Pacific 37.6% share (2025) Rural electrification, 5G densification, tower-sharing expansion
North America USD 1.42 Billion (2025) Grid resilience, edge computing power, carbon compliance
Europe 7.80% CAGR (2026–2035) Renewable-hybrid mandates, fuel-cell pilots, energy efficiency
South America USD 0.49 Billion (2025) 4G coverage extension, solar-hybrid kits, towerco consolidation
Middle East & Africa 8.40% CAGR (2026–2035) Off-grid solar-diesel, rural connectivity, spectrum auctions

The Telecom Power System Market exhibits significant regional variation, shaped by the maturity of mobile networks, grid reliability, regulatory posture on emissions, and the pace of 5G rollout.


North America

Country Key Metric Key Driver
US 68.5% of regional share Edge-site buildout and wildfire-resilient power upgrades [19]
Canada 7.20% CAGR Northern connectivity programs and First Nations broadband [20]
Mexico USD 0.11 Billion (2025) Shared-network expansion under IFT regulatory framework [15]


The US Telecom Power System Market is driven by operator investments in climate-hardened sites following the 2023–2024 wildfire and hurricane seasons that exposed grid-dependency risks. The FCC's 72-hour backup-power mandate for cell sites remains a key procurement driver, while Tier-1 operators are piloting 48V lithium-iron-phosphate batteries at scale to replace aging VRLA banks [19].

Europe

Country Key Metric Key Driver
Germany 22.8% of regional share Energiewende-aligned renewable telecom power mandates [10]
UK 7.90% CAGR Shared Rural Network and Open RAN power requirements [20]
France USD 0.14 Billion (2025) ARCEP energy-efficiency targets for mobile operators [15]
Italy 6.80% CAGR 5G densification in urban corridors [1]
Spain USD 0.09 Billion (2025) Solar-hybrid adoption in southern tower portfolios [11]
Nordic Countries 7.40% CAGR Arctic-hardened power solutions for remote sites [16]
Russia USD 0.08 Billion (2025) Rural 4G extension across Federal Districts
Rest of Europe 6.50% CAGR Mixed 4G/5G power upgrade cycles


European operators face binding carbon-reduction targets under the European Green Deal, with several national regulators linking spectrum-renewal conditions to energy-efficiency commitments. The EU's Energy Efficiency Directive now covers telecommunications infrastructure, pushing operators toward renewable-hybrid power systems and high-efficiency rectifiers that cut per-site energy consumption by 20–30% [10].

Asia-Pacific

Country Key Metric Key Driver
China 42.3% of regional share China Tower Corporation's massive 5G site rollout [6]
India 9.50% CAGR BharatNet Phase III and 5G SA spectrum awards [6]
Japan USD 0.22 Billion (2025) NTT and KDDI green-network commitments [2]
South Korea 7.80% CAGR Dense urban 5G mmWave small-cell power requirements [1]
ASEAN 8.60% CAGR Tower-company expansion and rural 4G infill [12]
Rest of Asia-Pacific USD 0.15 Billion (2025) Mixed greenfield and brownfield site deployments


Asia-Pacific dominates the Telecom Power System Market because the region hosts the world's largest mobile subscriber base and the most aggressive 5G build schedules. China Tower Corporation alone manages over 2.1 million tower sites. It is systematically upgrading power systems to support dual 4G/5G loads, while Indian towercos are deploying solar-hybrid solutions at over 50,000 sites per year to reduce diesel consumption [6][12].

South America

Country Key Metric Key Driver
Brazil 58.2% of regional share Anatel coverage obligations tied to 5G spectrum auction [15]
Argentina 7.10% CAGR Rural connectivity expansion under ENACOM programs
Rest of South America USD 0.08 Billion (2025) Gradual 4G coverage extension


Brazil anchors the South American Telecom Power System Market, with Anatel's 3.5 GHz auction conditions requiring operators to extend coverage to underserved municipalities by 2028. Towercos such as American Tower and SBA Communications are investing in solar-hybrid power plants at rural tower sites where grid availability averages 12–16 hours per day, compressing diesel costs while meeting coverage obligations [15].

Middle East & Africa

Country Key Metric Key Driver
Saudi Arabia 28.4% of regional share NEOM and Vision 2030 telecom infrastructure [18]
UAE 7.60% CAGR Smart-city 5G deployments and sustainability mandates
South Africa USD 0.06 Billion (2025) Load-shedding mitigation and tower backup upgrades [13]
Egypt 8.10% CAGR Population growth and 4G densification
Rest of MEA USD 0.12 Billion (2025) NGO and World Bank co-financed connectivity programs [18]


The Middle East & Africa Telecom Power System Market is bifurcated: Gulf states invest in premium 5G-ready power infrastructure, while Sub-Saharan Africa confronts chronic grid unreliability that makes diesel and solar-hybrid systems essential rather than optional. South Africa's sustained load-shedding crisis has prompted operators like MTN and Vodacom to invest over USD 200 million in battery and generator upgrades since 2022 [13].


Telecom Power System Market By Region, 2025-2035

Competitive Benchmarking

The Telecom Power System Market exhibits medium concentration, with the top five vendors commanding an estimated 45–55% of global revenue. The competitive field spans vertically integrated power-electronics conglomerates, telecom-specialist OEMs, and battery/fuel-cell pure plays. Strategic differentiation increasingly hinges on software-defined energy management, lifecycle-service contracts, and the ability to deliver pre-integrated, containerized solutions that compress deployment timelines. The estimated Herfindahl-Hirschman Index (HHI) falls in the 800–1,200 range, consistent with a moderately competitive structure.

Company Est. Revenue Share Range Key Offerings Strategic Positioning
Vertiv 12–15% NetSure rectifiers, Liebert thermal, SmartCabinet Broadest integrated portfolio for indoor/outdoor sites
Huawei Digital Power 10–13% iSitePower, SmartLi, blade power supplies Scale advantages in Asia-Pacific and emerging markets
Delta Electronics 8–11% InfraSuite, Eltek rectifier modules, outdoor cabinets Strong in hybrid and solar-integrated architectures
Eaton 6–9% DC power systems, lithium UPS, grid-interactive inverters North America and Europe enterprise-grade focus
ZTE 5–8% UniSite, modular DC power, solar-hybrid kits Vertically integrated radio-plus-power bundles
Schneider Electric 4–7% Galaxy UPS, EcoStruxure IT, modular data centers Software-defined energy management differentiation
Cummins 3–6% Diesel and gas generators, fuel-cell backup, PowerCommand Generator dominance, expanding into hydrogen fuel cells
ABB 3–5% Rectifiers, switchgear, grid-edge inverters Utility-grade power conversion for large sites
EnerSys 2–4% Telecom batteries (VRLA and Li-ion), Purcell systems Battery-specialist positioning across all chemistries
Emerson Electric 2–4% Outdoor power shelters, DC conversion modules Legacy installed-base presence and retrofit services


Recent News & Developments

Pace Digitek(July 2026)–expanded strategic cooperation with MEGMEET Electrical India for AI data center power infrastructure.

Delta Electronics–(July 2025)–launched its compact SMART PDU I-Type power distribution unit designed for telecom and data center operators.


  • CyberPower(June, 2026)–won the ESX Innovation Award for its Smart App Online UPS system in power supplies.


Telecom Power System Market Report Scope

Parameter Detail
Market Scope Global Telecom Power System Market covering power electronics, energy storage, generation, and management systems for mobile and fixed-wireless network infrastructure
Study Period 2021–2035
CAGR 7.60% (2026–2035)
Base Year Market Size USD 5.72 Billion (2025)
Forecast Endpoint USD 11.91 Billion (2035)
Fastest Growing Segments Lithium-Ion Storage (14.7% CAGR); 5G NR Network Generation (15.8% CAGR)
Companies Profiled Vertiv, Huawei Digital Power, Delta Electronics, Eaton, ZTE, Schneider Electric, Cummins, ABB, EnerSys, Emerson Electric
Valuation Currency USD Billion


FAQs

How do lithium-ion and VRLA batteries compare on total cost of ownership for a typical macro site?
Lithium-ion delivers 35–45% lower ten-year TCO than VRLA due to its 8–10 year lifespan versus 3–5 years, despite a 15–20% higher upfront price. Fewer replacements and lower cooling requirements drive the savings [7].
What redundancy configurations are most common in the Telecom Power System Market for mission-critical sites?
Most Tier-1 operators specify N+1 rectifier redundancy and dual-battery-string architectures at mission-critical sites. Some carriers add a secondary generator or fuel cell for sites classified as critical infrastructure [19].
How does 5G mmWave small-cell power differ from macro-site requirements?
Small cells typically draw 0.5–1.5 kW per node, well below macro-site loads, but deploy in clusters of 10–50 units per square kilometer. Aggregate power management across dense clusters creates unique distribution challenges [1].
What financing mechanisms are available for off-grid telecom power upgrades in emerging markets?
Development finance institutions like the IFC and AfDB offer blended-finance facilities covering 40–60% of solar-hybrid capex. Several towercos also use power-purchase agreements that shift upfront cost to third-party energy providers [18].
How are towercos approaching Scope 2 emission measurement across their site portfolios?
Leading towercos deploy per-site smart meters and cloud-based dashboards to track kWh consumption, diesel liters burned, and renewable contribution ratios in real time. These systems feed directly into annual ESG disclosures [10].
What role do GaN and SiC semiconductors play in next-generation rectifier design?
GaN and SiC power devices enable rectifiers to achieve 97–98% conversion efficiency at higher power densities, reducing heat dissipation and allowing smaller enclosures. Adoption is accelerating as device costs decline [14].
How does the Telecom Power System Market address cybersecurity risks in remote energy management systems?
Vendors increasingly embed TLS-encrypted communications and role-based access controls in site controllers. Operators in North America and Europe require compliance with IEC 62443 industrial cybersecurity standards for all remotely managed power equipment [19].    
Author
Author
Author Profile
Ankit Gupta LinkedIn
Team Lead - Research
Ankit Gupta is a seasoned market intelligence and strategic research professional with over six plus years of experience in the ICT and Semiconductor industries. With academic roots in Telecom, Marketing, and Electronics, he blends technical insight with business strategy. Ankit has led 200+ projects, including work for Fortune 500 clients like Microsoft and Rio Tinto, covering market sizing, tech forecasting, and go-to-market strategies. Known for bridging engineering and enterprise decision-making, his insights support growth, innovation, and investment planning across diverse technology markets.

Research Approach


Secondary Research

The secondary research process involved comprehensive analysis of regulatory databases, industry white papers, technical standards documentation, and authoritative telecommunications organizations. Key sources included the International Telecommunication Union (ITU), Federal Communications Commission (FCC), European Telecommunications Standards Institute (ETSI), IEEE Standards Association, U.S. Department of Energy (DOE), International Energy Agency (IEA), GSMA Intelligence, CTIA – The Wireless Association, Telecommunications Industry Association (TIA), European Commission DG CONNECT, International Renewable Energy Agency (IRENA), Environmental Protection Agency (EPA) Energy Star Program, U.S. Energy Information Administration (EIA), World Bank Energy Data, OECD Digital Economy Outlook, and national telecommunications regulatory authority reports from key markets including China's Ministry of Industry and Information Technology (MIIT), India's Department of Telecommunications (DoT), and Brazil's National Telecommunications Agency (ANATEL). These sources were utilized to collect 5G deployment statistics, energy efficiency regulations, power system standards, renewable energy adoption rates, and infrastructure investment trends for DC power systems, AC power systems, hybrid power systems, UPS systems, and power distribution units across telecom service providers, data centers, and network equipment manufacturers.


Primary Research

In order to gather both qualitative and quantitative insights, supply-side and demand-side stakeholders were interviewed during the primary research process. CEOs, VPs of Product Development, CTOs, heads of regulatory compliance, and commercial directors from telecom power system manufacturers, energy solution providers, and OEMs were examples of supply-side sources. Chief technology officers, network infrastructure directors, procurement leads from tier-1 telecom service providers, data center operations managers, and sustainability executives from large telecom companies were among the demand-side sources. Primary research verified 5G infrastructure deployment schedules, validated market segmentation across power source categories (renewable energy, grid power, hybrid energy, backup generators), and acquired information on energy efficiency regulations, CAPEX planning cycles, and total cost of ownership models for rectifiers, inverters, batteries, and cooling systems.

Primary Respondent Breakdown:

By Designation: C-level Primaries (42%), Director Level (31%), Others (27%)

By Region: North America (32%), Europe (30%), Asia-Pacific (35%), Rest of World (3%)

Download Free Sample

Kindly complete the form below to receive a free sample of this Report

Download PDF ×

We do not share your information with anyone. However, we may send you emails based on your report interest from time to time. You may contact us at any time to opt-out.
















