Download Free Sample
Kindly complete the form below to receive a free sample of this Report
Television Commercial Production Services Market Size, Share and Trends Analysis Research Report Information By Application (Television Commercials, Digital Advertising, Social Media Campaigns, Promotional Videos), By Client Type (Corporate Clients, Advertising Agencies, Non-Profit Organizations, Government Entities), And By Region (North America, Europe, Asia-Pacific, And Rest Of The World) – Market Forecast Till 2035.
As per MRFR analysis, the Television Commercial Production Services Market was estimated at 30.0 USD Billion in 2024. The Television Commercial Production Services industry is projected to grow from 31.43 USD Billion in 2025 to 50.0 USD Billion by 2035, exhibiting a compound annual growth rate (CAGR) of 4.75% during the forecast period 2025 - 2035.
The Television Commercial Production Services Market is experiencing dynamic growth driven by technological advancements and evolving consumer preferences.
| 2024 Market Size | 30.0 (USD Billion) |
| 2035 Market Size | 50.0 (USD Billion) |
| CAGR (2025 - 2035) | 4.75% |
WPP (GB), Omnicom Group (US), Publicis Groupe (FR), Interpublic Group (US), Dentsu (JP), Havas Group (FR), Grey Group (US), BBDO (US), Saatchi & Saatchi (GB)
Our Impact
Enabled $4.3B Revenue Impact for Fortune 500 and Leading Multinationals
Partnering with 2000+ Global Organizations Each Year
30K+ Citations by Top-Tier Firms in the Industry
The Television Commercial Production Services Market is currently experiencing a dynamic evolution, driven by the increasing demand for high-quality visual content across various platforms. As brands seek to engage consumers more effectively, the emphasis on creativity and innovation in commercial production has intensified. This market appears to be influenced by advancements in technology, particularly in areas such as digital media and virtual reality, which are reshaping how advertisements are conceptualized and executed. Furthermore, the rise of social media platforms has created new avenues for brands to reach their target audiences, thereby altering traditional advertising strategies. In addition, the growing importance of sustainability and ethical practices in production processes is becoming more pronounced. Companies are increasingly prioritizing environmentally friendly methods and socially responsible messaging in their campaigns. This shift not only reflects changing consumer preferences but also aligns with broader societal trends towards sustainability. As the Television Commercial Production Services Market continues to adapt to these evolving demands, it is likely to witness further transformations in production techniques and creative approaches, ensuring that it remains relevant in a rapidly changing landscape.
The integration of advanced technologies into the production process is reshaping the Television Commercial Production Services Market. Innovations such as artificial intelligence and augmented reality are enhancing creative possibilities, allowing for more engaging and interactive advertisements. This trend suggests that production companies may increasingly adopt these technologies to stay competitive.
There is a noticeable shift towards sustainable practices within the Television Commercial Production Services Market. Production companies are exploring eco-friendly materials and methods, reflecting a growing consumer demand for environmentally conscious advertising. This trend indicates that sustainability may become a key differentiator for brands in their marketing strategies.
The demand for diverse and inclusive content is rising within the Television Commercial Production Services Market. Brands are recognizing the importance of representing various demographics and perspectives in their advertisements. This trend suggests that production services may increasingly focus on creating content that resonates with a broader audience, fostering a sense of connection and relevance.
Technological advancements play a crucial role in shaping the Television Commercial Production Services Market. The integration of cutting-edge tools and software has revolutionized the production process, enabling creators to produce high-quality commercials more efficiently. Innovations such as 4K and 8K video resolution, drone cinematography, and virtual reality are becoming increasingly prevalent in commercial production. These technologies not only enhance the visual appeal of advertisements but also allow for more creative storytelling techniques. Furthermore, the rise of artificial intelligence in editing and post-production processes streamlines workflows, reducing time and costs associated with traditional methods. As production companies embrace these advancements, they are better equipped to meet the evolving demands of clients and audiences alike. Therefore, the continuous evolution of technology serves as a significant driver for the Television Commercial Production Services Market.
Regulatory changes and compliance requirements are emerging as influential factors in the Television Commercial Production Services Market. As governments implement stricter advertising regulations, production companies must adapt their practices to ensure compliance. This includes adhering to guidelines related to content, representation, and advertising standards. The need for transparency and ethical advertising is becoming increasingly paramount, prompting brands to seek production services that prioritize compliance. Additionally, the rise of consumer protection laws necessitates that commercials are not only engaging but also truthful and responsible. As a result, production companies that can navigate these regulatory landscapes effectively are likely to gain a competitive advantage. Thus, regulatory changes and compliance considerations represent a critical driver for the Television Commercial Production Services Market.
The shift towards digital advertising significantly influences the Television Commercial Production Services Market. As traditional media consumption declines, advertisers are reallocating budgets to digital platforms, which offer targeted reach and measurable results. Data suggests that digital advertising expenditures have surpassed those of traditional television, prompting production companies to adapt their strategies accordingly. This transition necessitates the creation of commercials that are optimized for online viewing, often requiring shorter formats and engaging content. Additionally, the rise of social media platforms as advertising channels has led to an increased demand for creative and shareable video content. Consequently, production services that specialize in digital formats are likely to thrive, as they cater to the changing preferences of both brands and consumers. Thus, the shift towards digital advertising emerges as a key driver for the Television Commercial Production Services Market.
The Television Commercial Production Services Market experiences a notable surge in demand for video content across various platforms. As consumers increasingly gravitate towards visual media, brands are compelled to invest in high-quality television commercials to capture audience attention. Recent data indicates that video advertising spending has risen significantly, with projections suggesting a continued upward trajectory. This trend is driven by the need for businesses to enhance their online presence and engage consumers effectively. Consequently, production companies are adapting to this demand by offering innovative solutions that cater to diverse client needs. The emphasis on storytelling and creativity in commercials further fuels this growth, as brands seek to differentiate themselves in a crowded marketplace. Thus, the increasing demand for video content serves as a pivotal driver for the Television Commercial Production Services Market.
The growing importance of brand storytelling is reshaping the Television Commercial Production Services Market. In an era where consumers seek authentic connections with brands, storytelling has become a vital component of effective advertising. Companies are increasingly recognizing that compelling narratives can foster emotional engagement and brand loyalty. This trend is reflected in the production of commercials that prioritize storytelling elements, often featuring relatable characters and real-life scenarios. As a result, production companies are focusing on developing creative concepts that resonate with audiences on a deeper level. Furthermore, data indicates that advertisements that tell a story are more likely to be remembered and shared, enhancing their overall impact. Therefore, the emphasis on brand storytelling serves as a significant driver for the Television Commercial Production Services Market.
The Television Commercial Production Services Market showcases a dynamic distribution among its key application segments. Television commercials continue to dominate the landscape, holding a substantial share due to their longstanding influence and effectiveness in reaching a wide audience. In contrast, digital advertising, while not yet holding the largest market presence, is rapidly gaining traction as advertisers increasingly pivot towards online platforms to engage with consumers. This shift underscores an evolving market in which traditional and digital strategies coexist, catering to diverse viewer preferences. Growth trends within the application segment reveal a transformative environment driven primarily by technological advancements and changing consumer behaviors. Advertisers are leveraging social media campaigns and promotional videos to create more interactive and engaging content, targeting specific demographics effectively. The rise of digital platforms has made it essential for brands to adapt their marketing strategies to capture attention in a crowded online space, pushing digital advertising as the fastest-growing segment in the market. This evolution reflects a broader trend of integrating multimedia approaches to enhance audience engagement and drive brand awareness.
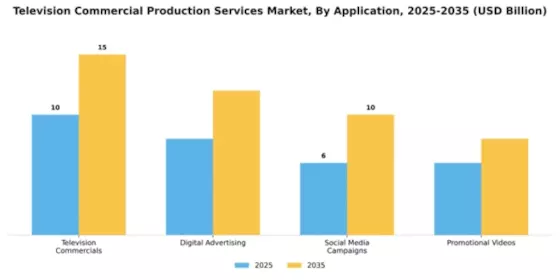
Television Commercials (Dominant) vs. Promotional Videos (Emerging)
Television commercials have established themselves as the dominant force within the Television Commercial Production Services Market, recognized for their extensive reach and impact. This traditional approach leverages high production values to capture viewer attention and convey compelling narratives, ultimately fostering brand recognition. In contrast, promotional videos are emerging as a creative alternative aimed at niche markets. These shorter, often more informal videos focus on delivering concise messages that resonate with specific audiences, a strategy compounded by the prevalence of social media channels. As brands seek innovative ways to engage consumers, the adaptability and cost-effectiveness of promotional videos position them as a significant contender in the evolving landscape, reflecting the dynamic interplay between traditional and digital marketing methodologies.
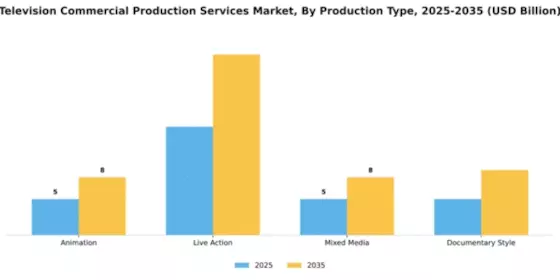
In the Television Commercial Production Services Market, the segment of Production Type is predominantly led by Animation, which captures a significant portion of market activity due to its adaptability in engaging audiences. Live Action follows closely, gaining traction as brands increasingly invest in authentic storytelling to connect with viewers. Mixed Media and Documentary Style, while important, hold a smaller share, catering to niche markets seeking unique and experiential content. Growth trends within this segment indicate that Live Action is the fastest-growing category, fueled by advancements in technology and changing consumer preferences towards realism and relatability in advertisements. Animation remains relevant, leveraging its versatility and appeal among various demographics, while Mixed Media and Documentary Style have carved out dedicated spaces within specific advertising strategies, appealing to brands looking to differentiate their messaging.
Animation (Dominant) vs. Documentary Style (Emerging)
Animation, as the dominant force in the Television Commercial Production Services Market, showcases a wide array of styles and techniques, making it a preferred choice for brands aiming for creativity and visual engagement. It allows for imaginative storytelling that transcends the limitations of live-action productions. On the other hand, Documentary Style is emerging as a compelling segment, focusing on authenticity and real-life narratives that resonate with audiences. This style often evokes emotional connections, making it attractive for brands that wish to convey their values and missions genuinely. While Animation leads with its creative flexibility, Documentary Style is rapidly gaining ground, reflecting changing audience preferences towards sincerity and relatability in marketing messages.
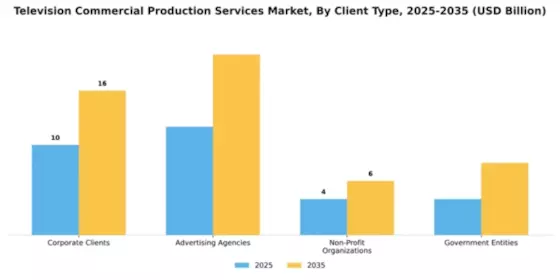
In the Television Commercial Production Services Market, Advertising Agencies hold the largest market share as they extensively engage with production services to create compelling commercials for their campaigns. These agencies prioritize unique storytelling and professional production quality, leveraging advanced techniques to captivate audiences and facilitate successful advertising campaigns. Corporate Clients, on the other hand, have emerged as the fastest-growing segment as businesses increasingly recognize the value of television advertising in enhancing brand visibility and customer engagement. Their expanding budgets for promotional content have led to a rise in demand for tailored commercial production services.
Clients: Advertising Agencies (Dominant) vs. Corporate Clients (Emerging)
Advertising Agencies dominate the Television Commercial Production Services Market due to their established relationships with production teams and deep understanding of audience targeting. Their expertise in crafting narratives that resonate with viewers ensures high-quality outputs that align with varying campaign objectives. On the other hand, Corporate Clients represent an emerging segment as they begin to invest more heavily in television commercials to complement their digital marketing efforts. This shift reflects a growing acknowledgment of television as a powerful medium for reaching wide audiences, positioning Corporate Clients to significantly alter dynamics within this market as they become more involved in custom commercial productions.
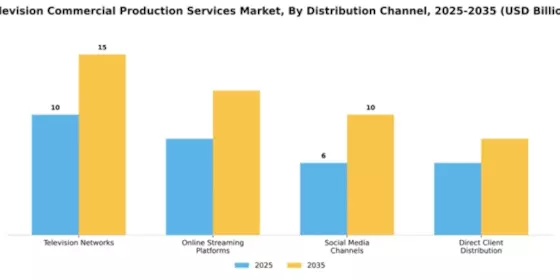
In the Television Commercial Production Services Market, the distribution of channels reflects a diverse landscape. Television Networks dominate the segment with a significant market share, benefiting from established audience bases and traditional advertising revenue models. In contrast, Online Streaming Platforms have emerged as a formidable force, driven by changing viewing habits and the increasing consumption of content on demand, positioning them as the fastest-growing segment in the market.
Television Networks (Dominant) vs. Online Streaming Platforms (Emerging)
Television Networks have long been the backbone of the commercial production landscape, offering stability and broad reach through traditional advertising formats. They maintain a dominant position due to their established frameworks, high-profile content, and trusted viewership. On the other hand, Online Streaming Platforms represent an emerging segment characterized by innovative approaches to content delivery and advertising. These platforms attract younger audiences who prefer streaming over traditional viewing options, thus reshaping the commercial production strategy. As they continue to grow, both segments will likely coexist, each appealing to distinct audience preferences.
Get more detailed insights about Television Commercial Production Services Market Request Free Sample
North America continues to lead the Television Commercial Production Services market, holding a significant share of 15.0 in 2024. The region's growth is driven by high demand for innovative advertising solutions, technological advancements, and a robust entertainment industry. Regulatory support for creative industries further enhances market dynamics, fostering an environment conducive to growth and investment. The competitive landscape is characterized by major players such as WPP, Omnicom Group, and Publicis Groupe, which dominate the market. The United States, in particular, is a hub for creative talent and production facilities, attracting global brands seeking high-quality commercial content. This concentration of resources and expertise solidifies North America's position as the leading region in this sector.
Europe's Television Commercial Production Services market is valued at 8.0, reflecting a growing demand for diverse and localized content. The region benefits from a rich cultural landscape and increasing investment in digital advertising, which drives the need for high-quality production services. Regulatory frameworks supporting creative industries are also pivotal in fostering innovation and competition within the market. Leading countries such as the UK, Germany, and France are at the forefront of this growth, with key players like Publicis Groupe and Havas Group establishing a strong presence. The competitive landscape is evolving, with a mix of established firms and emerging startups, enhancing the region's ability to cater to varied consumer preferences and advertising needs. The European market is poised for further expansion as brands increasingly recognize the value of localized content.
The Asia-Pacific region, with a market size of 5.0, is rapidly emerging as a significant player in the Television Commercial Production Services market. The growth is fueled by increasing consumer spending, a burgeoning middle class, and the rise of digital platforms. Countries like China, India, and Japan are witnessing a surge in demand for high-quality commercial content, supported by favorable regulatory environments that encourage investment in media and entertainment. The competitive landscape is diverse, with both local and international players vying for market share. Dentsu and Grey Group are among the key players making strides in this region. The presence of a young, tech-savvy population further drives innovation in advertising, making Asia-Pacific a dynamic and competitive market for television commercial production services.
The Middle East and Africa region, with a market size of 2.0, is witnessing gradual growth in the Television Commercial Production Services sector. Factors such as increasing urbanization, rising disposable incomes, and a growing appetite for digital content are driving demand. Regulatory initiatives aimed at promoting local content production are also contributing to the market's development, creating opportunities for both local and international players. Countries like South Africa and the UAE are leading the charge, with a mix of established firms and new entrants in the market. The competitive landscape is evolving, with key players beginning to recognize the potential of this region. As the market matures, it is expected to attract more investment and talent, further enhancing its growth prospects.
The Television Commercial Production Services Market is characterized by a dynamic competitive landscape, driven by rapid technological advancements and evolving consumer preferences. Major players such as WPP (GB), Omnicom Group (US), and Publicis Groupe (FR) are at the forefront, each adopting distinct strategies to enhance their market positioning. WPP (GB) has focused on digital transformation, integrating advanced analytics and AI into its production processes, thereby improving efficiency and targeting capabilities. Meanwhile, Omnicom Group (US) emphasizes strategic partnerships, collaborating with tech firms to leverage innovative solutions in content creation. Publicis Groupe (FR) appears to be concentrating on sustainability, aligning its production practices with eco-friendly initiatives, which resonates well with contemporary consumer values.The market structure is moderately fragmented, with a mix of large conglomerates and smaller specialized firms. Key players are increasingly localizing their operations to better cater to regional markets, optimizing supply chains to enhance responsiveness and reduce costs. This collective influence of major companies shapes a competitive environment where agility and adaptability are paramount, allowing firms to respond swiftly to market demands and consumer trends.In November WPP (GB) announced a strategic partnership with a leading AI technology firm to develop a new platform aimed at automating aspects of commercial production. This move is likely to enhance WPP's capabilities in delivering personalized content at scale, thereby positioning the company as a leader in innovative production solutions. The integration of AI is expected to streamline workflows and reduce production timelines, which could significantly impact client satisfaction and retention.In October Omnicom Group (US) launched a new initiative focused on immersive advertising experiences, utilizing augmented reality (AR) to engage consumers more effectively. This strategic pivot not only showcases Omnicom's commitment to innovation but also reflects a broader trend within the industry towards experiential marketing. By harnessing AR technology, the company aims to create memorable brand interactions, potentially increasing client engagement and driving higher conversion rates.In September Publicis Groupe (FR) unveiled its commitment to achieving carbon neutrality in its production processes by 2030. This ambitious goal underscores the company's strategic focus on sustainability, which is becoming increasingly vital in attracting environmentally conscious clients. By prioritizing eco-friendly practices, Publicis is likely to enhance its brand reputation and appeal to a growing segment of consumers who value corporate responsibility.As of December the competitive trends within the Television Commercial Production Services Market are heavily influenced by digitalization, sustainability, and the integration of AI technologies. Strategic alliances are becoming more prevalent, enabling companies to pool resources and expertise to navigate the complexities of modern production demands. Looking ahead, competitive differentiation is expected to evolve, shifting from traditional price-based competition to a focus on innovation, technological advancements, and supply chain reliability. This transition may redefine success in the market, as companies that prioritize these elements are likely to gain a competitive edge.






The Television Commercial Production Services Market is projected to grow at a 4.75% CAGR from 2025 to 2035, driven by technological advancements, increased digital advertising, and evolving consumer preferences.
New opportunities lie in:
By 2035, the market is expected to be robust, reflecting dynamic growth and innovation.
| MARKET SIZE 2024 | 30.0(USD Billion) |
| MARKET SIZE 2025 | 31.43(USD Billion) |
| MARKET SIZE 2035 | 50.0(USD Billion) |
| COMPOUND ANNUAL GROWTH RATE (CAGR) | 4.75% (2025 - 2035) |
| REPORT COVERAGE | Revenue Forecast, Competitive Landscape, Growth Factors, and Trends |
| BASE YEAR | 2024 |
| Market Forecast Period | 2025 - 2035 |
| Historical Data | 2019 - 2024 |
| Market Forecast Units | USD Billion |
| Key Companies Profiled | WPP (GB), Omnicom Group (US), Publicis Groupe (FR), Interpublic Group (US), Dentsu (JP), Havas Group (FR), Grey Group (US), BBDO (US), Saatchi & Saatchi (GB) |
| Segments Covered | Application, Production Type, Client Type, Distribution Channel |
| Key Market Opportunities | Integration of advanced digital technologies enhances creativity and efficiency in the Television Commercial Production Services Market. |
| Key Market Dynamics | Rising demand for high-quality content drives innovation and competition in television commercial production services. |
| Countries Covered | North America, Europe, APAC, South America, MEA |
The market valuation reached 30.0 USD Billion in 2024.
The market is expected to grow to 50.0 USD Billion by 2035.
The market is projected to experience a CAGR of 4.75% from 2025 to 2035.
Key segments include Television Commercials, Digital Advertising, Social Media Campaigns, and Promotional Videos.
Television Commercials may reach 15.0 USD Billion, while Digital Advertising could grow to 12.0 USD Billion.
Prominent players include WPP, Omnicom Group, Publicis Groupe, and Interpublic Group.
The market features Animation, Live Action, Mixed Media, and Documentary Style productions.
Live Action production is projected to grow to 25.0 USD Billion by 2035.
Major client types include Corporate Clients, Advertising Agencies, Non-Profit Organizations, and Government Entities.
Distribution channels encompass Television Networks, Online Streaming Platforms, Social Media Channels, and Direct Client Distribution.


Kindly complete the form below to receive a free sample of this Report

“This is really good guys. Excellent work on a tight deadline. I will continue to use you going forward and recommend you to others. Nice job”


“Thanks. It’s been a pleasure working with you, please use me as reference with any other Intel employees.”


“Thanks for sending the report it gives us a good global view of the Betaïne market.”


“Thank you, this will be very helpful for OQS.”


“We found the report very insightful! we found your research firm very helpful. I'm sending this email to secure our future business.”


“I am very pleased with how market segments have been defined in a relevant way for my purposes (such as "Portable Freezers & refrigerators" and "last-mile"). In general the report is well structured. Thanks very much for your efforts.”


“I have been reading the first document or the study, ,the Global HVAC and FP market report 2021 till 2026. Must say, good info! I have not gone in depth at all parts, but got a good indication of the data inside!”


“We got the report in time, we really thank you for your support in this process. I also thank to all of your team as they did a great job.”


“The Automotive 48V ECU Components Procurement Intelligence Study” was a complex project, but the Market Research Future (MRFR) team handled it with quality, agility, and customer-centricity. They delivered all requested data on time and within the agreed scope. The team, including Shubhendra Anand and Rahul Gotadki, was always readily available to clarify questions and swiftly implement necessary adjustments, driving the project to a successful conclusion within a very demanding timeframe.
I would also like to specifically commend Akshay Agarwal for his responsiveness and support at every stage—from our initial inquiry on May 6th through to final delivery on June 18th. His dedication made the entire process seamless.”



