• Cat-intel
  • MedIntelliX
  • Resources
  • About Us
  • Hero Background
    English
    Chinese
    French
    Japanese
    Korean
    German
    Spanish

    Tortilla Market Trends

    ID: MRFR/F-B & N/1789-CR
    186 Pages
    Varsha More
    February 2021

    Tortilla Market Research Report Information By Type (Industrial, and Artisanal), by Processing Type (Fresh and Frozen), Product Type (Tortilla Mix, Pre-Cooked Tortilla, Tostadas, Tortilla Chips, Taco Shell, and Others), By Nature (Organic and Conventional), By Source (Corn and Wheat), By Category (Standard/Regular, and Gluten-Free), By Distribution Channel (B2B, and B2C), And By Region (North A...

    Share:
    Download PDF ×

    We do not share your information with anyone. However, we may send you emails based on your report interest from time to time. You may contact us at any time to opt-out.

    Tortilla Market Infographic
    $ 4,950.0
    $ 5,950.0
    $ 7,250.0

    Market Trends

    Key Emerging Trends in the Tortilla Market

    The tortilla market is undergoing dynamic changes, reflecting shifting consumer preferences and a growing appetite for diverse and international cuisines. One prominent trend shaping this market is the increasing demand for healthier alternatives. The increasing awareness among the consumers due to health concerns has led to a visible trend toward whole-grain and multigrain tortillas as well as those made with alternative flours such as the almond, chickpea, and cassava flours. The focus on clean labels, free of artificial additives and preservatives, makes tortillas popular among consumers oriented on contemporary dietary trends. The gluten free movement culture is slowly spreading in the tortilla market because of gluten sensitive consumer or those consumers who practice glutenfree diet. And there is an increase in the use of tortillas that are prepared from gluten-free grains such as corn, rice, and quinoa which is beneficial to celiac patients, or individuals intolerant to gluten. This is in line with the gluten-free movement advocated for by the food for sector the trend therefore is inclusive of the tortilla products. The trend and convenience continue as a major driving force in the tortilla market; there is a growing demand for the ready-to-eat and easy-to-use types of products. The craze for wraps, burritos, and tacos for on-the-go meals is subsequently triggering manufacturers to launch tortillas in convenient models, inclusive of pre-minimize, pre-cooked, and individual wraps. Such a tendency corresponds to the ever-increasing fast-paced lifestyles aimed at convenient and flexible meal solutions. An observed influence in the tortilla market is flavor innovation, specifically the development of tastes that are novel as well as strong. There are many flavors of tortilla you can find ranging from spicy jalapeño to savory garlic and herb flavored tortillas that have made various dishes present anecdotal idea. Furthermore, the change of color of tortillas through the integration of natural materials such as spinach, beet, and turmeric provides both visual aesthetic appeal as well as authentic color appeal targeting consumer’s requirements that looks bright and natural. The sustainability revolution hence influences the tortilla market whereby consumers are now concerned with the environmental impact of their food options. As a result the demand for tortillas which are sourced and produced from sustainability and ethically is on the increase. Digital platforms and social media have been gerenalizing the market trends of the tortilla market. Food influencers and bloggers showcase innovative recipes and creative uses of tortillas, influencing consumer preferences and driving experimentation in home kitchens. The visual appeal of tortilla-based dishes on social media platforms contributes to their popularity and encourages consumers to try new and exciting variations.

    Market Summary

    As per Market Research Future Analysis, the global Tortilla Market was valued at USD 45,196.34 million in 2023 and is projected to reach USD 66,464.53 million by 2032, growing at a CAGR of 4.41% from 2024 to 2032. The market is driven by increasing demand for gluten-free and healthy alternatives, with a notable shift towards innovative flavors and fillings. The industrial segment dominates with a 72.27% market share, while fresh tortillas account for 72.91% of the processing type. The organic segment is expected to grow at the highest CAGR of 5.56%.

    Key Market Trends & Highlights

    Key trends shaping the tortilla market include innovation in flavors and health-conscious options.

    • Industrial tortillas accounted for 72.27% market share in 2023. Fresh tortillas held 72.91% of the processing type market in 2023. The organic segment is projected to grow at a CAGR of 5.56% during the forecast period. Tostadas are expected to witness the highest growth with a CAGR of 7.16%.

    Market Size & Forecast

    2023 Market Size USD 45,196.34 million
    2032 Market Size USD 66,464.53 million
    CAGR (2024-2032) 4.41%
    Largest Market Share in 2023 North America (73.04%).

    Major Players

    <p>Key companies include Paulig Group, General Mills Inc., Grupo Bimbo S.A.B. de C.V., Tyson Foods Inc., and GRUMA S.A.B. DE C.V.</p>

    Market Trends

    Introduction of innovative flavors and fillings

    The introduction of revolutionary flavors and fillings is revolutionizing the tortilla market, using customer hobbies, and expanding its culinary appeal. Businesses are experimenting with specific flavors to cater to evolving customer tastes and choices for adventurous consumption experiences. For instance, in February 2024, Garden Veggie Snacks unveiled its Flavour Burst Nacho Cheese and Zesty Ranch Flavoured Tortilla Chips. By integrating popular flavors into their products, Garden Veggie Snacks is appealing to health-conscious consumers who seek indulgent yet nutritious options. Similarly, Mission Foods, Inc., a subsidiary of Gruma Corp., introduced sweet Hawaiian flour tortillas in June 2024.

    These 4.5-inch tortillas, part of Mission’s “super soft” line, come in a 10-count package, emphasizing convenience and versatility. The sweet Hawaiian flavor taps into the trend of fusion cuisine, mixing familiar tortilla codes with exclusive candy notes that can supplement a spread of fillings, from savory to sweet. Further, those improvements include adding new flavors and improving the overall eating experience. With the aid of incorporating diverse and sudden flavors, manufacturers are broadening the tortilla market place’s appeal, attracting both traditional clients and people looking for novel culinary adventures.

    This trend highlights the enterprise's dedication to creativity and meeting the dynamic demands of food enthusiasts.

    <p>The global tortilla market is experiencing a notable shift towards healthier and more diverse product offerings, reflecting changing consumer preferences and dietary trends.</p>

    U.S. Department of Agriculture

    Tortilla Market Market Drivers

    Market Growth Projections

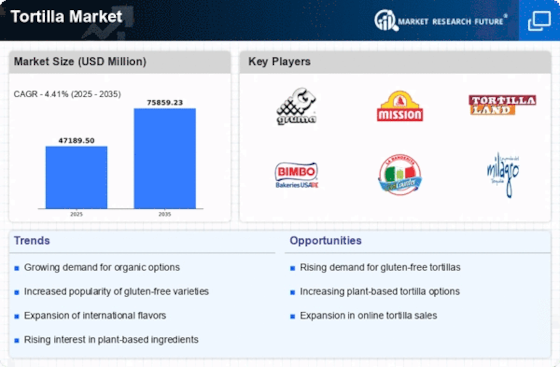
    The Global Tortilla Market Industry is poised for substantial growth, with projections indicating a market size of 46.7 USD Billion in 2024 and an anticipated increase to 75.7 USD Billion by 2035. The compound annual growth rate (CAGR) is estimated at 4.49% for the period from 2025 to 2035. This growth trajectory reflects the increasing popularity of tortillas across various demographics and regions. Factors contributing to this expansion include the rising demand for convenience foods, health-conscious choices, and the globalization of culinary practices. As the market evolves, it is likely to present new opportunities for innovation and diversification.

    Health and Wellness Trends

    The Global Tortilla Market Industry is significantly influenced by the rising health and wellness trends among consumers. There is an increasing awareness regarding dietary choices, leading to a demand for healthier tortilla options, such as whole grain and gluten-free varieties. This shift aligns with the broader trend of consumers prioritizing nutrition and ingredient transparency. As a result, manufacturers are reformulating products to include organic and non-GMO ingredients, appealing to health-conscious consumers. The market's growth trajectory suggests that by 2035, it could reach 75.7 USD Billion, indicating a robust response to the health-oriented preferences of the global population.

    Rising Demand for Convenience Foods

    The Global Tortilla Market Industry experiences a notable surge in demand for convenience foods, driven by changing consumer lifestyles. As individuals increasingly seek quick meal solutions, tortillas serve as versatile options for wraps, tacos, and quesadillas. This trend is particularly pronounced in urban areas where busy schedules limit cooking time. The market is projected to reach 46.7 USD Billion in 2024, reflecting a growing preference for ready-to-eat and easy-to-prepare meals. Consequently, manufacturers are innovating with pre-packaged tortillas and ready-to-use products, catering to the evolving needs of consumers seeking convenience without compromising on taste.

    Cultural Influence and Globalization

    The Global Tortilla Market Industry benefits from the cultural influence and globalization of food trends. As culinary practices from different regions gain popularity, tortillas have transcended their traditional roots, becoming staples in various cuisines worldwide. This phenomenon is particularly evident in regions outside of Latin America, where tortillas are increasingly incorporated into diverse dishes. The fusion of flavors and culinary experimentation encourages consumers to explore new ways of enjoying tortillas, thus expanding the market. The projected CAGR of 4.49% from 2025 to 2035 indicates a sustained interest in tortillas as a versatile ingredient in global cuisine.

    Technological Advancements in Production

    The Global Tortilla Market Industry is experiencing transformative technological advancements in production processes. Innovations in machinery and automation enhance efficiency, allowing manufacturers to produce high-quality tortillas at scale. These advancements not only improve production speed but also ensure consistency in product quality, meeting the rising consumer expectations. Additionally, technology facilitates the development of new tortilla varieties, including those with unique flavors and textures. As the market evolves, these technological improvements are likely to play a crucial role in maintaining competitiveness and meeting the growing demand for diverse tortilla products.

    Sustainability and Eco-Friendly Practices

    The Global Tortilla Market Industry is increasingly influenced by sustainability and eco-friendly practices. Consumers are becoming more environmentally conscious, prompting manufacturers to adopt sustainable sourcing and production methods. This includes utilizing organic ingredients, reducing packaging waste, and implementing energy-efficient processes. Brands that prioritize sustainability are likely to resonate with consumers who value ethical consumption. As the market adapts to these expectations, it may witness a shift in purchasing behavior, with consumers favoring brands that demonstrate a commitment to environmental responsibility. This trend could further enhance the market's growth potential in the coming years.

    Market Segment Insights

    Segment Insights

    Tortilla Type Insights

    <p>Based on Type, the Tortilla Market has been segmented into Industrial, and Artisanal. The industrial segment accounted for the largest market share of 72.27% in 2023 and is likely to register a CAGR of 4.08% during the projected period. Industrial tortillas are mass-produced flatbreads that cater to the high demand for convenient, <a href="https://www.marketresearchfuture.com/reports/ready-to-eat-meals-market-1979">ready-to-eat food</a> products. There are two primary types of industrial tortillas: flour tortillas and corn tortillas, each with distinct characteristics and applications. Flour tortillas are made from wheat flour, these tortillas are soft, flexible, and slightly chewy.</p>

    <p>They typically include ingredients like water, fat (often lard or vegetable shortening), <a href="https://www.marketresearchfuture.com/reports/baking-powder-mixes-market-12581">baking powder</a>, and salt. Industrial flour tortillas are popular due to their versatility and long shelf life. They are commonly used in various dishes, including burritos, quesadillas, wraps, and fajitas. Their mild flavor complements a wide range of fillings, from savory to sweet, making them a staple in many cuisines beyond traditional Mexican food. Corn tortillas are made from masa harina, a type of corn flour treated with lime (calcium hydroxide) through a process called nixtamalization. This process enhances the nutritional value and flavor of corn.</p>

    <p>Industrial corn tortillas are a staple in Mexican cuisine, known for their distinct corn flavor and slightly firmer texture compared to flour tortillas.</p>

    Tortilla Processing Type Insights

    <p>Based on Processing Type, the Tortilla Market has been segmented into Fresh and Frozen. The fresh segment accounted for the largest market share of 72.91% in 2023 and is likely to register a CAGR of 4.28% during the projected period. Fresh tortillas are a fundamental component of many cuisines worldwide, particularly in regions like Latin America and the southwestern United States, where they serve as a staple food item. These tortillas are typically made with simple ingredients such as corn or wheat flour, water, salt, and sometimes fat, depending on regional variations and preferences.</p>

    <p>What distinguishes fresh tortillas is their immediate availability and soft, pliable texture, which enhances their versatility in various culinary applications. The production process for fresh tortillas often involves traditional methods such as hand-pressing or machine-pressing dough balls into thin, round shapes, which are then cooked on a hot griddle or Comal. These tortillas are then promptly distributed to grocery stores, restaurants, and households, ensuring consumers can enjoy them at their peak freshness.</p>

    <p>Figure 2: Tortilla Market, by processing type, 2023 &amp; 2032 (USD Million)</p>

    Tortilla Product Type Insights

    <p>Based on Product Type, the Tortilla Market has been segmented into tortilla mix, pre-cooked tortilla, tostadas, tortilla chips, taco shell, and others. The tostadas segment is expected to witness the highest growth and is likely to register a CAGR of 7.16% during the projected period. Tostadas are a popular type of tortilla product and are versatile and beloved in Mexican cuisine. Essentially a fried or toasted version of the traditional tortilla, tostadas offer a crispy and sturdy base for a variety of toppings.</p>

    <p>Their preparation begins with a simple corn tortilla, which is either deep-fried or baked until it achieves a golden, crunchy texture. This transformation enhances the tortilla’s flavor and provides a satisfying crunch, making it a perfect vessel for an array of <a href="https://www.marketresearchfuture.com/reports/savory-ingredients-market-1818">savory ingredients</a>. The simplicity of tostadas belies their culinary versatility. They serve as a canvas for an infinite variety of toppings, ranging from refried beans, shredded chicken, and beef to fresh seafood like ceviche. Vegetables, lettuce, avocado, cheese, salsa, and sour cream often complete the ensemble, creating a harmonious balance of flavors and textures.</p>

    <p>The crispiness of the tostada contrasts beautifully with the softness of the toppings, offering a delightful eating experience with each bite. Tostadas are not only a testament to the ingenuity of Mexican cuisine but also an excellent example of how traditional foods can be adapted to modern tastes and lifestyles.</p>

    Tortilla Nature Insights

    <p>Based on Nature, the Tortilla Market has been segmented into organic and conventional. The conventional segment accounted for the 74.13% market share of in 2023 and is likely to register a CAGR of 3.98% during the projected period. The organic segment will likely register the highest CAGR of 5.56% during the projected period. The organic tortilla industry segment has experienced a notable surge in recent years, driven primarily by increasing consumer awareness regarding health and sustainability. Organic tortillas are produced from ingredients that are grown without the use of synthetic pesticides, <a href="https://www.marketresearchfuture.com/reports/green-fertilizers-market-31753">fertilizers</a>, or genetically modified organisms (GMOs).</p>

    <p>This segment appeals to health-conscious consumers who prioritize natural and minimally processed food options. One of the key drivers behind the growth of the organic market of tortilla is the rising demand for organic products due to concerns about the potential health risks associated with chemical residues in conventional farming practices. Consumers are becoming more discerning about the quality and safety of the food they consume, leading to a shift towards organic alternatives.</p>

    <p>Additionally, there is a growing preference for organic tortillas among environmentally conscious consumers who are concerned about the impact of conventional farming methods on soil health, water quality, and biodiversity.</p>

    Tortilla Source Insights

    <p>Based on Source, the Tortilla Market has been segmented into Corn and Wheat. The corn segment accounted for the 67.95% market share of in 2023 and is likely to register a CAGR of 4.54% during the projected period. Corn tortillas are a staple in many Latin American cuisines, particularly in Mexico, where they have been a dietary staple for thousands of years. Made primarily from masa harina, a type of corn flour, corn tortillas offer a distinct flavor and texture that is cherished by many.</p>

    <p>The process of making corn tortillas involves nixtamalization, where dried maize is soaked and cooked in an alkaline solution, usually lime water, which enhances its nutritional value and flavor. After this process, the corn is ground into masa, which is then used to make tortillas. One of the key characteristics of corn tortillas is their versatility. They can be used in a wide range of dishes, from tacos and Enchilada to tostadas and quesadillas.</p>

    <p>Figure 5: Tortilla Market, by source, 2023 &amp; 2032 (USD Million)</p>

    Tortilla Category Insights

    <p>Based on Category, the Tortilla Market has been segmented into standard/regular, and gluten-free. The standard/regular segment accounted for the market share of 76.57% in 2023 and is likely to register a CAGR of 4.30% during the projected period. The standard/regular tortilla is typically prepared from corn or wheat and serves as a versatile base for a range of dishes. Corn tortillas are rooted deeply in ancient Mesoamerica culture, and are traditionally crafted from masa harina, a specially treated corn flour that gives them their distinctive flavor and texture.</p>

    <p>Wheat tortillas, on the other hand, have a softer, more pliable texture and are a staple in northern Mexico and the southwestern US. Whether tortillas are folded around savory fillings in tacos, rolled into Enchilada, or used as a wrap in modern fusion cuisine, their role is both foundational and flexible. The texture of a well-made tortilla, whether slightly chewy or delicately crisped on the edges, complements an array of fillings and toppings, from rich, slow-cooked meats to fresh, vibrant vegetables and tangy salsas.</p>

    <p>Figure 6: Tortilla Market, by category, 2023 &amp; 2032 (USD Million)</p>

    Tortilla Distribution Channel Insights

    <p>Based on Distribution Channel, the Tortilla Market has been segmented into B2B, and B2C. The B2B segment accounted for the market share of 50.67% in 2023 and is likely to register a CAGR of 4.06% during the projected period. The B2B mode of distribution in the tortilla industry is a critical segment that significantly impacts the overall supply chain and market dynamics. This distribution channel involves the sale of tortillas from manufacturers to other businesses, such as restaurants, hotels, <a href="https://www.marketresearchfuture.com/reports/catering-services-market-23311">catering services</a>, and food retailers, which then resell or use the tortillas in their offerings.</p>

    <p>This mode is essential for ensuring a consistent and large-scale supply of tortillas to various points of consumption. The primary advantage of the B2B distribution channel is its ability to handle bulk orders efficiently, ensuring that large quantities of tortillas are delivered timely and with minimal logistical disruptions.</p>

    Get more detailed insights about Tortilla Market Research Report - Forecast till 2032

    Regional Insights

    By Region, the study segments the market into North America, Europe, Asia Pacific, Middle East & Africa, and South America. North America Tortilla market accounts for the largest market share 73.04% in 2023 and is expected to exhibit a 4.17% CAGR. The North American market of tortilla stands at the intersection of tradition and innovation, reflecting a dynamic landscape shaped by cultural heritage and evolving consumer preferences. With a market size of over $23.4 billion, it remains a cornerstone of the region's culinary identity, driven primarily by the United States, Mexico, and Canada.

    While traditional corn tortillas continue to enjoy steadfast popularity, the market has witnessed a surge in demand for wheat-based tortillas, spurred by their versatility and adaptability to a variety of cuisines.

    Figure 8: Tortilla Market, by region, 2023 & 2032 (USD Million)

    Tortilla Market, by region, 2023 & 2032

    Source: Secondary Research, Primary Research, Market Research Future Database and Analyst Review

    The tortilla market in Europe has witnessed significant growth in recent years, driven by several key factors. Firstly, the increasing multiculturalism and globalization have led to a rise in the demand for diverse cuisines, including Mexican and Tex-Mex dishes, where tortillas serve as a staple ingredient. Moreover, the growing popularity of convenience foods and snacks has further fueled the demand for tortilla products across the region. Manufacturers have capitalized on this trend by introducing a variety of tortilla-based snacks, such as tortilla chips and wraps, catering to the evolving preferences of European consumers.

    The Asia Pacific tortilla market has witnessed significant growth in recent years, primarily driven by the increasing popularity of Mexican cuisine, growing urbanization, and changing consumer preferences towards healthier alternatives. The region's tortilla industry encompasses various types, including corn tortillas, flour tortillas, and specialty tortillas, each catering to diverse consumer tastes and preferences. Key players in the market are constantly innovating to introduce new flavors, textures, and healthier ingredients to capture a larger market share. Additionally, the rising trend of home cooking and the availability of ready-to-eat tortilla products further fuel market growth.

    The South American tortilla industry is a diverse and dynamic landscape shaped by unique regional preferences, cultural influences, and economic factors. Unlike Mexico, where corn tortillas dominate, South America showcases a blend of corn and wheat-based tortillas, reflecting the continent's varied culinary traditions and consumption habits.

    The Middle East and Africa (MEA) tortilla market is experiencing dynamic growth, primarily driven by evolving consumer preferences, urbanization, and increasing adoption of Western food trends. While traditionally not a staple in MEA diets, tortillas are gaining popularity due to their versatility, convenience, and perceived health benefits. The market is witnessing a shift in consumption patterns, with a growing demand for Mexican and Tex-Mex cuisine across the region.

    Further, the major countries studied are: The U.S, Canada, Mexico, Germany, France, UK, Spain, Italy, China, India, Japan, South Korea, Australia & New Zealand, Brazil, Argentina, Turkey.

    Key Players and Competitive Insights

    The Tortilla Market is characterized by the presence of many global, regional, and local vendors. The market is highly competitive, with all the players competing to gain maximum market share. Intense competition, frequent changes in government policies, and regulations are key factors that impact market growth. The vendors compete based on cost, product quality, reliability, and aftermarket services. The vendors must provide cost-efficient and high-quality tortilla to sustain their presence in an intensely competitive market environment. Furthermore, the gluten-free trend has gained significant traction, driven by the rising prevalence of gluten intolerance and preferences for gluten-free diets.

    Manufacturers are responding by developing gluten-free tortilla varieties, expanding their market reach to cater to this specific consumer segment. The shift towards whole grains, multigrains, and gluten-free ingredients in tortillas reflects a broader consumer movement towards healthier eating habits. This trend presents significant opportunities for manufacturers to innovate and expand their product lines, meeting the evolving needs and preferences of health-conscious consumers worldwide.

    Key Companies in the Tortilla Market market include

    Industry Developments

    February 2024: The Company has announced a new partnership with Paniflower and Bat Agrar to significantly reduce the climate impact of the wheat used in its tortillas by 35%.

    October 2023: Paulig has launched a new line of Santa Maria tortillas with up to 50% lower climate impact compared to their standard tortillas.

    Future Outlook

    Tortilla Market Future Outlook

    <p>The Global Tortilla Market is projected to grow at a 4.49% CAGR from 2024 to 2035, driven by increasing consumer demand for <a href="https://www.marketresearchfuture.com/reports/convenience-food-retail-market-22604">convenience foods</a> and health-conscious options.</p>

    New opportunities lie in:

    • <p>Expand product lines to include gluten-free and organic tortillas to capture health-focused consumers. Leverage e-commerce platforms for direct-to-consumer sales, enhancing market reach and customer engagement. Invest in sustainable packaging solutions to appeal to environmentally conscious buyers and reduce carbon footprint.</p>

    <p>By 2035, the Tortilla Market is expected to achieve robust growth, reflecting evolving consumer preferences and innovative product offerings.</p>

    Market Segmentation

    Tortilla Type Outlook

    • Industrial
    • Artisanal

    Tortilla Nature Outlook

    • Organic
    • Conventional

    Tortilla Source Outlook

    • Corn
    • Wheat

    Tortilla Category Outlook

    • Standard/regular
    • Gluten-free

    Tortilla Regional Outlook

    • {"North America"=>["US"
    • "Canada"
    • "Mexico"]}
    • {"Europe"=>["Netherlands"
    • "Germany"
    • "France"
    • "UK"
    • "Spain"
    • "Italy"
    • "Rest of Europe"]}
    • {"Asia-Pacific"=>["China"
    • "India"
    • "Japan"
    • "South Korea"
    • "Australia & New Zealand"
    • "Thailand"
    • "Rest of Asia-Pacific"]}
    • {"South America"=>["Brazil"
    • "Argentina"
    • "Rest of South America"]}
    • {"Middle East & Africa"=>["GCC Countries"
    • "Turkey"
    • "Northern Africa"
    • "Southern Africa"]}

    Tortilla Product Type Outlook

    • Tortilla mix
    • Pre-cooked tortilla
    • Tostadas
    • Tortilla chips
    • Taco shell
    • Others

    Tortilla Processing Type Outlook

    • Fresh
    • Frozen

    Tortilla Distribution Channel Outlook

    • B2B
    • B2C

    Report Scope

    Attribute/MetricDetails
    Market Size 2023USD 45,196.34 million
    Market Size 2032USD 66,464.53 million
    Compound Annual Growth Rate (CAGR)4.41% (2024-2032)
    Base Year2023
    Forecast Period2024-2032
    Historical Data2018-2022
    Forecast UnitsValue (USD Million)
    Report CoverageRevenue Forecast, Competitive Landscape, Growth Factors, and Trends
    Segments CoveredType, Processing Type, Product Type, Nature, Source, Category, Distribution Channel, Region
    Geographies CoveredNorth America, Europe, Asia Pacific, South America, and Middle East & Africa
    Countries CoveredThe U.S, Canada, Mexico, Germany, France, UK, Italy, Spain, Netherlands, China, Japan, India, South Korea, Australia & New Zealand, Brazil, Argentina, Turkey
    Key Companies ProfiledPaulig Group (Finland), Signature Flatbreads Ltd (London), General Mills Inc. (USA), Grupo Bimbo S.A.B. de C.V. (Mexico), Tyson Foods Inc (US), GRUMA S.A.B. DE C.V (Mexico), Dona Cholita (Australia), Aranda’s Tortilla Company Inc. (US), PepsiCo Inc. (US), Ole Mexican Foods Inc. (Georgia), Easy Foods Inc. (US), Catallia Mexican Foods (US), La Tortilleria (Australia) among others.
    Key Market Opportunities·       Expansion of online retail and e-commerce ·       Health and wellness trends
    Key Market Dynamics·       Surging applications pushing the growth ·       Increasing demand for organic products ·       Growing popularity of ethnic cuisines

    Market Highlights

    Author

    Varsha More
    Research Analyst

    She holds an experience of about 6+ years in market research and business consulting, working under the spectrum of information communication technology, telecommunications and semiconductor domains. aarti conceptualizes and implements a scalable business strategy and provides strategic leadership to the clients. her expertise lies in market estimation, competitive intelligence, pipeline analysis, customer assessment, etc.

    Leave a Comment

    Latest Comments

    John Doe
    john@example.com

    This is a great article! Really helped me understand the topic better.

    Posted on July 23, 2025, 10:15 AM
    Jane Smith
    jane@domain.com

    Thanks for sharing this. I’ve bookmarked it for later reference.

    Posted on July 22, 2025, 7:45 PM

    FAQs

    How much is the Tortilla market in 2024?

    The Tortilla market accounted for USD 47,063.93 million.

    What is the key driving factor for the Tortilla market?

    Surging applications pushing the growth, increasing demand for organic products, growing popularity of ethnic cuisines are the key driving factor for the Tortilla market.

    What is the growth rate of the Tortilla market?

    The growth rate of the Tortilla market is 4.41% CAGR.

    Which region held the largest `market share in the Tortilla market?

    North America region held the largest market share in the Tortilla market.

    Who are the key players in the Tortilla market?

    Paulig Group (Finland), Signature Flatbreads Ltd (London), General Mills Inc. (USA), Grupo Bimbo S.A.B. de C.V. (Mexico), Tyson Foods Inc (US), GRUMA S.A.B. DE C.V (Mexico), Dona Cholita (Australia), Aranda’s Tortilla Company Inc. (US), PepsiCo Inc. (US), Ole Mexican Foods Inc. (Georgia), Easy Foods Inc. (US), Catallia Mexican Foods (US), La Tortilleria (Australia) among others.

    1. --- 'Table of Contents
    2. Executive Summary 30
      1. MARKET ATTRACTIVENESS ANALYSIS 31
        1. GLOBAL TORTILLA MARKET, BY TYPE 32
        2. GLOBAL TORTILLA MARKET, BY PROCESSING TYPE 33
        3. GLOBAL TORTILLA MARKET, BY PRODUCT TYPE 34
        4. GLOBAL TORTILLA MARKET, BY NATURE 35
        5. GLOBAL TORTILLA MARKET, BY SOURCE 36
        6. GLOBAL TORTILLA MARKET, BY CATEGORY 37
        7. GLOBAL TORTILLA MARKET, BY DISTRIBUTION CHANNEL 38
    3. Market Introduction 40
      1. DEFINITION 40
      2. Scope of the Study 40
      3. RESEARCH OBJECTIVE 40
      4. MARKET STRUCTURE 41
    4. Research Methodology 42
      1. OVERVIEW 42
      2. DATA FLOW 44
        1. DATA MINING PROCESS 44
      3. PURCHASED DATABASE: 45
      4. SECONDARY SOURCES: 46
        1. SECONDARY RESEARCH DATA FLOW: 47
      5. PRIMARY RESEARCH: 48
        1. PRIMARY RESEARCH DATA FLOW: 49
        2. PRIMARY RESEARCH: NUMBER OF INTERVIEWS CONDUCTED 50
        3. PRIMARY RESEARCH: REGIONAL COVERAGE 50
      6. APPROACHES FOR MARKET SIZE ESTIMATION: 51
        1. CONSUMPTION & NET TRADE APPROACH 51
        2. REVENUE ANALYSIS APPROACH 51
      7. DATA FORECASTING 52
        1. DATA FORECASTING TECHNIQUE 52
      8. DATA MODELING 53
        1. MICROECONOMIC FACTOR ANALYSIS: 53
        2. DATA MODELING: 54
      9. TEAMS AND ANALYST CONTRIBUTION 56
      10. TEAMS AND ANALYST CONTRIBUTION 57
    5. MARKET DYNAMICS 59
      1. INTRODUCTION 59
      2. DRIVERS 60
        1. SURGING APPLICATIONS PUSHING THE GROWTH 60
        2. INCREASING DEMAND FOR ORGANIC PRODUCTS 61
        3. GROWING POPULARITY OF ETHNIC CUISINES 61
      3. RESTRAINTS 63
        1. PRICE VOLATILITY 63
        2. AVAILABILITY OF SUBSTITUTES 63
      4. OPPORTUNITY 65
        1. EXPANSION OF ONLINE RETAIL AND E-COMMERCE 65
        2. HEALTH AND WELLNESS TRENDS 65
      5. CHALLENGES 66
        1. STRINGENT GOVERNMENT REGULATIONS 66
        2. MAINTAINING PRODUCT QUALITY AND CONSISTENCY 66
      6. STRATEGIC INSIGHTS 67
        1. TECHNOLOGY UPDATE 67
        2. REGIONAL MARKETS TO LOOKOUT FOR 68
      7. REGULATORY UPDATE 68
      8. MARKET TRENDS 69
        1. INTRODUCTION OF INNOVATIVE FLAVORS AND FILLINGS 69
        2. INCREASING ADOPTION OF PLANT-BASED DIETS 69
      9. IMPACT ANALYSIS OF COVID-19 70
        1. IMPACT ON OVERALL FOOD INDUSTRY 70
        2. IMPACT ON GLOBAL TORTILLA MARKET 71
        3. IMPACT ON SUPPLY CHAIN OF TORTILLA 71
        4. IMPACT ON MARKET DEMAND OF TORTILLA 71
        5. IMPACT ON PRICING OF PRICING OF TORTILLA 72
        6. CONSUMER BEHAVIOR ANALYSIS 73
    6. MARKET FACTOR ANALYSIS 74
      1. VALUE CHAIN ANALYSIS 74
        1. RAW MATERIALS 74
        2. OPERATIONS 74
        3. PACKING 75
      2. SUPPLY CHAIN ANALYSIS 75
        1. PARTICIPANTS (AT DIFFERENT NODES) 76
        2. INTEGRATION LEVELS 77
        3. KEY ISSUES ADDRESSED (KEY SUCCESS FACTORS) 77
      3. PORTER’S FIVE FORCES MODEL 78
        1. BARGAINING POWER OF SUPPLIERS 78
        2. BARGAINING POWER OF BUYERS 79
        3. THREAT OF NEW ENTRANTS 79
        4. THREAT OF SUBSTITUTES 79
        5. INTENSITY OF RIVALRY 79
      4. PRICING ANALYSIS 80
      5. CROSS SEGMENTATION ANALYSIS, BY TYPE (SOURCE), BY REGION (VALUE & VOLUME) 81
      6. CROSS SEGMENTATION ANALYSIS, BY TYPE (CATEGORY), BY REGION (VALUE & VOLUME) 85
      7. ANALYSIS OF SELF LIFE OF INDUSTRIAL TORTILLA, AT GLOBAL LEVEL 89
      8. ANALYSIS ON SHELF LIFE OF PRODUCTS, BY BRAND 89
    7. GLOBAL TORTILLA MARKET, BY TYPE 93
      1. INTRODUCTION 93
      2. INDUSTRIAL 94
        1. HOT-PRESSING 95
        2. DIE-CUTTING 95
        3. HAND-STRETCHING 95
      3. ARTISANAL 96
    8. GLOBAL TORTILLA MARKET, BY PROCESSING TYPE 98
      1. INTRODUCTION 98
      2. FRESH 99
      3. FROZEN 100
    9. GLOBAL TORTILLA MARKET, BY PRODUCT TYPE 102
      1. INTRODUCTION 102
      2. TORTILLA MIX 104
      3. PRE-COOKED TORTILLA 105
      4. TOSTADAS 106
      5. TORTILLA CHIPS 107
      6. TACO SHELL 108
      7. OTHERS 109
    10. GLOBAL TORTILLA MARKET, BY NATURE 110
      1. INTRODUCTION 110
      2. ORGANIC 111
      3. CONVENTIONAL 112
    11. GLOBAL TORTILLA MARKET, BY SOURCE 114
      1. INTRODUCTION 114
      2. CORN 115
      3. WHEAT 116
    12. GLOBAL TORTILLA MARKET, BY CATEGORY 118
      1. INTRODUCTION 118
      2. STANDARD/REGULAR 119
      3. GLUTEN-FREE 120
    13. GLOBAL TORTILLA MARKET, BY DISTRIBUTION CHANNEL 122
      1. INTRODUCTION 122
      2. B2B 123
        1. RESTAURANTS 124
        2. CAFES 124
        3. OTHERS 124
      3. B2C 125
        1. SUPERMARKETS 126
        2. SPECIALTY STORES 126
        3. ONLINE 126
        4. OTHERS 126
    14. GLOBAL TORTILLA MARKET, BY REGION 128
      1. OVERVIEW 128
      2. NORTH AMERICA 129
        1. US 136
        2. CANADA 140
        3. MEXICO 145
      3. EUROPE 150
        1. NETHERLAND 157
        2. GERMANY 162
        3. FRANCE 166
        4. UK 170
        5. SPAIN 174
        6. ITALY 178
        7. REST OF EUROPE 183
      4. ASIA PACIFIC 187
        1. CHINA 195
        2. INDIA 199
        3. JAPAN 203
        4. SOUTH KOREA 208
        5. AUSTRALIA & NEW ZEALAND 212
        6. REST OF ASIA PACIFIC 216
      5. SOUTH AMERICA 221
        1. BRAZIL 228
        2. ARGENTINA 233
        3. REST OF SOUTH AMERICA 237
      6. MIDDLE EAST & AFRICA 243
        1. GCC COUNTRIES 250
        2. TURKEY 254
        3. NORTHERN AFRICA 258
        4. SOUTHERN AFRICA 263
    15. Competitive Landscape 270
      1. INTRODUCTION 270
      2. COMPETITION DASHBOARD 270
        1. PRODUCT PORTFOLIO 272
        2. REGIONAL PRESENCE 272
        3. STRATEGIC ALLIANCES 272
        4. INDUSTRY EXPERIENCES 272
      3. MARKET SHARE ANALYSIS, 2023 272
      4. WHO ARE THE MAJOR DISRUPTORS & INNOVATORS 273
      5. WHAT STRATEGIES ARE BEING ADOPTED BY MARKET LEADERS 273
      6. COMPARATIVE ANALYSIS: KEY PLAYERS FINANCIAL 273
      7. LIST OF KEY PLAYERS/BRANDS, BY REGION 274
      8. KEY DEVELOPMENTS & GROWTH STRATEGIES 274
        1. PRODUCT LAUNCH 274
    16. COMPANY PROFILES 277
      1. PAULIG GROUP 277
        1. COMPANY OVERVIEW 277
        2. FINANCIAL OVERVIEW 278
        3. PRODUCTS OFFERED 278
        4. KEY DEVELOPMENTS 279
        5. SWOT ANALYSIS 280
        6. KEY STRATEGIES 280
      2. SIGNATURE FLATBREADS LTD 281
        1. COMPANY OVERVIEW 281
        2. FINANCIAL OVERVIEW 281
        3. PRODUCTS OFFEREDS 282
        4. KEY DEVELOPMENTS 282
        5. SWOT ANALYSIS 282
        6. KEY STRATEGIESS 283
      3. GENERAL MILLS INC 284
        1. COMPANY OVERVIEW 284
        2. FINANCIAL OVERVIEW 285
        3. KEY DEVELOPMENTS 286
        4. SWOT ANALYSIS 287
        5. KEY STRATEGIES 287
      4. GRUPO BIMBO SAB DE CV 288
        1. COMPANY OVERVIEW 288
        2. FINANCIAL OVERVIEW 289
        3. PRODUCTS OFFERED 289
        4. KEY DEVELOPMENTS 290
        5. SWOT ANALYSIS 291
        6. KEY STRATEGIES 291
      5. TYSON FOODS, INC 293
        1. COMPANY OVERVIEW 293
        2. FINANCIAL OVERVIEW 294
        3. PRODUCTS OFFERED 294
        4. KEY DEVELOPMENTS 295
        5. SWOT ANALYSIS 295
        6. KEY STRATEGIES 296
      6. GRUMA, S.A.B. DE C.V 297
        1. COMPANY OVERVIEW 297
        2. FINANCIAL OVERVIEW 298
        3. PRODUCTS OFFERED 299
        4. KEY DEVELOPMENTS 299
        5. SWOT ANALYSIS 300
        6. KEY STRATEGIES 300
      7. DONA CHOLITA 301
        1. COMPANY OVERVIEW 301
        2. FINANCIAL OVERVIEW 301
        3. PRODUCTS OFFERED 302
        4. KEY DEVELOPMENTS 302
        5. KEY STRATEGIES 302
      8. AZTECA FOODS 303
        1. COMPANY OVERVIEW 303
        2. FINANCIAL OVERVIEW 303
        3. PRODUCTS OFFERED 303
        4. KEY DEVELOPMENTS 304
        5. KEY STRATEGIES 304
      9. ARANDA''S TORTILLA COMPANY INC 305
        1. COMPANY OVERVIEW 305
        2. FINANCIAL OVERVIEW 305
        3. PRODUCTS OFFERED 305
        4. KEY DEVELOPMENTS 305
        5. KEY STRATEGIES 306
      10. PEPSICO INC. 307
        1. COMPANY OVERVIEW 307
        2. FINANCIAL OVERVIEW 308
        3. PRODUCTS OFFERED 308
        4. KEY DEVELOPMENTS 309
        5. SWOT ANALYSIS 310
        6. KEY STRATEGIES 310
      11. OLE MEXICAN FOODS INC 311
        1. COMPANY OVERVIEW 311
        2. FINANCIAL OVERVIEW 311
        3. PRODUCTS OFFERED 312
        4. KEY DEVELOPMENTS 312
        5. KEY STRATEGIES 312
      12. EASY FOODS INC 313
        1. COMPANY OVERVIEW 313
        2. FINANCIAL OVERVIEW 313
        3. PRODUCTS OFFERED 313
        4. KEY DEVELOPMENTS 314
        5. KEY STRATEGIES 314
      13. CATALLIA MEXICAN FOODS 315
        1. COMPANY OVERVIEW 315
        2. FINANCIAL OVERVIEW 315
        3. PRODUCTS OFFERED 315
        4. KEY DEVELOPMENTS 316
        5. SWOT ANALYSIS 316
        6. KEY STRATEGIES 317
      14. LA TORTILLERIA 318
        1. COMPANY OVERVIEW 318
        2. FINANCIAL OVERVIEW 318
        3. PRODUCTS OFFERED 318
        4. KEY DEVELOPMENTS 319
        5. KEY STRATEGIES 319
      15. DATA CITATIONS 321
    17. List of Tables and Figures
      1. LIST OF TABLES
      2. TABLE 1 QFD MODELING FOR MARKET SHARE ASSESSMENT 54
      3. TABLE 1 GLOBAL TORTILLA MARKET, BY TYPE (SOURCE), 2018-2032 (KILO TONS) 81
      4. TABLE 2 GLOBAL TORTILLA MARKET, BY TYPE (SOURCE), 2018-2032 (USD MILLION) 81
      5. TABLE 3 NORTH AMERICA TORTILLA MARKET, BY TYPE (SOURCE), 2018-2032 (KILO TONS) 81
      6. TABLE 4 NORTH AMERICA TORTILLA MARKET, BY TYPE (SOURCE), 2018-2032 (USD MILLION) 82
      7. TABLE 5 EUROPE TORTILLA MARKET, BY TYPE (SOURCE), 2018-2032 (KILO TONS) 82
      8. TABLE 6 EUROPE TORTILLA MARKET, BY TYPE (SOURCE), 2018-2032 (USD MILLION) 82
      9. TABLE 7 ASIA-PACIFIC TORTILLA MARKET, BY TYPE (SOURCE), 2018-2032 (KILO TONS) 83
      10. TABLE 8 ASIA-PACIFIC TORTILLA MARKET, BY TYPE (SOURCE), 2018-2032 (USD MILLION) 83
      11. TABLE 9 SOUTH AMERICA TORTILLA MARKET, BY TYPE (SOURCE), 2018-2032 (KILO TONS) 83
      12. TABLE 10 SOUTH AMERICA TORTILLA MARKET, BY TYPE (SOURCE), 2018-2032 (USD MILLION) 84
      13. TABLE 11 MIDDLE EAST & AFRICA TORTILLA MARKET, BY TYPE (SOURCE), 2018-2032 (KILO TONS) 84
      14. TABLE 12 MIDDLE EAST & AFRICA TORTILLA MARKET, BY TYPE (SOURCE), 2018-2032 (USD MILLION) 84
      15. TABLE 13 GLOBAL TORTILLA MARKET, BY TYPE (CATEGORY), 2018-2032 (KILO TONS) 85
      16. TABLE 14 GLOBAL TORTILLA MARKET, BY TYPE (CATEGORY), 2018-2032 (USD MILLION) 85
      17. TABLE 15 NORTH AMERICA TORTILLA MARKET, BY TYPE (CATEGORY), 2018-2032 (KILO TONS) 85
      18. TABLE 16 NORTH AMERICA TORTILLA MARKET, BY TYPE (CATEGORY), 2018-2032 (USD MILLION) 86
      19. TABLE 17 EUROPE TORTILLA MARKET, BY TYPE (CATEGORY), 2018-2032 (KILO TONS) 86
      20. TABLE 18 EUROPE TORTILLA MARKET, BY TYPE (CATEGORY), 2018-2032 (USD MILLION) 86
      21. TABLE 19 ASIA-PACIFIC TORTILLA MARKET, BY TYPE (CATEGORY), 2018-2032 (KILO TONS) 87
      22. TABLE 20 ASIA-PACIFIC TORTILLA MARKET, BY TYPE (CATEGORY), 2018-2032 (USD MILLION) 87
      23. TABLE 21 SOUTH AMERICA TORTILLA MARKET, BY TYPE (CATEGORY), 2018-2032 (KILO TONS) 87
      24. TABLE 22 SOUTH AMERICA TORTILLA MARKET, BY TYPE (CATEGORY), 2018-2032 (USD MILLION) 88
      25. TABLE 23 MIDDLE EAST & AFRICA TORTILLA MARKET, BY TYPE (CATEGORY), 2018-2032 (KILO TONS) 88
      26. TABLE 24 MIDDLE EAST & AFRICA TORTILLA MARKET, BY TYPE (CATEGORY), 2018-2032 (USD MILLION) 88
      27. TABLE 25 GLOBAL TORTILLA MARKET, BY TYPE, 2018-2032 (USD MILLION) 93
      28. TABLE 26 GLOBAL TORTILLA MARKET, BY TYPE, 2018-2032 (KILO TON) 94
      29. TABLE 27 GLOBAL TORTILLA MARKET ESTIMATES & FORECAST, BY INDUSTRIAL, 2018-2032 (USD MILLION) 96
      30. TABLE 28 GLOBAL TORTILLA MARKET ESTIMATES & FORECAST, BY INDUSTRIAL, 2018-2032 (KILO TON) 96
      31. TABLE 29 GLOBAL TORTILLA MARKET ESTIMATES & FORECAST, BY ARTISANAL, 2018-2032 (USD MILLION) 97
      32. TABLE 30 GLOBAL TORTILLA MARKET ESTIMATES & FORECAST, BY ARTISANAL, 2018-2032 (KILO TON) 97
      33. TABLE 31 GLOBAL TORTILLA MARKET, BY PROCESSING TYPE, 2018-2032 (USD MILLION) 98
      34. TABLE 32 GLOBAL TORTILLA MARKET, BY PROCESSING TYPE, 2018-2032 (KILO TON) 98
      35. TABLE 33 GLOBAL TORTILLA MARKET ESTIMATES & FORECAST, BY FRESH, 2018-2032 (USD MILLION) 99
      36. TABLE 34 GLOBAL TORTILLA MARKET ESTIMATES & FORECAST, BY FRESH, 2018-2032 (KILO TON) 100
      37. TABLE 35 GLOBAL TORTILLA MARKET ESTIMATES & FORECAST, BY FROZEN, 2018-2032 (USD MI'

    Tortilla Market Segmentation

    Tortilla Type Outlook (USD Million, 2018-2032)

    Industrial

    Artisanal

    Tortilla Processing Type Outlook (USD Million, 2018-2032)

    Fresh

    Frozen

    Tortilla Product Type Outlook (USD Million, 2018-2032)

    Tortilla mix

    Pre-cooked tortilla

    Tostadas

    Tortilla chips

    Taco shell

    Others

    Tortilla Nature Outlook (USD Million, 2018-2032)

    Organic

    Conventional

    Tortilla Source Outlook (USD Million, 2018-2032)

    Corn

    Wheat

    Tortilla Category Outlook (USD Million, 2018-2032)

    Standard/regular

    Gluten-free

    Tortilla Distribution Channel Outlook (USD Million, 2018-2032)

    B2B

    B2C

    Tortilla Regional Outlook (USD Million, 2018-2032)

    North America Outlook (USD Million, 2018-2032)

    North America Tortilla by Type

    Industrial

    Artisanal

    North America Tortilla by Processing Type

    Fresh

    Frozen

    North America Tortilla by Product Type

    Tortilla mix

    Pre-cooked tortilla

    Tostadas

    Tortilla chips

    Taco shell

    Others

    North America Tortilla by Nature

    Organic

    Conventional

    North America Tortilla by Source

    Corn

    Wheat

    North America Tortilla by Category

    Standard/regular

    Gluten-free

    North America Tortilla by Distribution Channel

    B2B

    B2C

    US Outlook (USD Million, 2018-2032)

    US Tortilla by Type

    Industrial

    Artisanal

    US Tortilla by Processing Type

    Fresh

    Frozen

    US Tortilla by Product Type

    Tortilla mix

    Pre-cooked tortilla

    Tostadas

    Tortilla chips

    Taco shell

    Others

    US Tortilla by Nature

    Organic

    Conventional

    US Tortilla by Source

    Corn

    Wheat

    US Tortilla by Category

    Standard/regular

    Gluten-free

    US Tortilla by Distribution Channel

    B2B

    B2C

    Canada Outlook (USD Million, 2018-2032)

    Canada Tortilla by Type

    Industrial

    Artisanal

    Canada Tortilla by Processing Type

    Fresh

    Frozen

    Canada Tortilla by Product Type

    Tortilla mix

    Pre-cooked tortilla

    Tostadas

    Tortilla chips

    Taco shell

    Others

    Canada Tortilla by Nature

    Organic

    Conventional

    Canada Tortilla by Source

    Corn

    Wheat

    Canada Tortilla by Category

    Standard/regular

    Gluten-free

    Canada Tortilla by Distribution Channel

    B2B

    B2C

    Mexico Outlook (USD Million, 2018-2032)

    Mexico Tortilla by Type

    Industrial

    Artisanal

    Mexico Tortilla by Processing Type

    Fresh

    Frozen

    Mexico Tortilla by Product Type

    Tortilla mix

    Pre-cooked tortilla

    Tostadas

    Tortilla chips

    Taco shell

    Others

    Mexico Tortilla by Nature

    Organic

    Conventional

    Mexico Tortilla by Source

    Corn

    Wheat

    Mexico Tortilla by Category

    Standard/regular

    Gluten-free

    Mexico Tortilla by Distribution Channel

    B2B

    B2C

    Europe Outlook (USD Million, 2018-2032)

    Europe Tortilla by Type

    Industrial

    Artisanal

    Europe Tortilla by Processing Type

    Fresh

    Frozen

    Europe Tortilla by Product Type

    Tortilla mix

    Pre-cooked tortilla

    Tostadas

    Tortilla chips

    Taco shell

    Others

    Europe Tortilla by Nature

    Organic

    Conventional

    Europe Tortilla by Source

    Corn

    Wheat

    Europe Tortilla by Category

    Standard/regular

    Gluten-free

    Europe Tortilla by Distribution Channel

    B2B

    B2C

    Netherlands Outlook (USD Million, 2018-2032)

    Netherlands Tortilla by Type

    Industrial

    Artisanal

    Netherlands Tortilla by Processing Type

    Fresh

    Frozen

    Netherlands Tortilla by Product Type

    Tortilla mix

    Pre-cooked tortilla

    Tostadas

    Tortilla chips

    Taco shell

    Others

    Netherlands Tortilla by Nature

    Organic

    Conventional

    Netherlands Tortilla by Source

    Corn

    Wheat

    Netherlands Tortilla by Category

    Standard/regular

    Gluten-free

    Netherlands Tortilla by Distribution Channel

    B2B

    B2C

    Germany Outlook (USD Million, 2018-2032)

    Germany Tortilla by Type

    Industrial

    Artisanal

    Germany Tortilla by Processing Type

    Fresh

    Frozen

    Germany Tortilla by Product Type

    Tortilla mix

    Pre-cooked tortilla

    Tostadas

    Tortilla chips

    Taco shell

    Others

    Germany Tortilla by Nature

    Organic

    Conventional

    Germany Tortilla by Source

    Corn

    Wheat

    Germany Tortilla by Category

    Standard/regular

    Gluten-free

    Germany Tortilla by Distribution Channel

    B2B

    B2C

    France Outlook (USD Million, 2018-2032)

    France Tortilla by Type

    Industrial

    Artisanal

    France Tortilla by Processing Type

    Fresh

    Frozen

    France Tortilla by Product Type

    Tortilla mix

    Pre-cooked tortilla

    Tostadas

    Tortilla chips

    Taco shell

    Others

    France Tortilla by Nature

    Organic

    Conventional

    France Tortilla by Source

    Corn

    Wheat

    France Tortilla by Category

    Standard/regular

    Gluten-free

    France Tortilla by Distribution Channel

    B2B

    B2C

    UK Outlook (USD Million, 2018-2032)

    UK Tortilla by Type

    Industrial

    Artisanal

    UK Tortilla by Processing Type

    Fresh

    Frozen

    UK Tortilla by Product Type

    Tortilla mix

    Pre-cooked tortilla

    Tostadas

    Tortilla chips

    Taco shell

    Others

    UK Tortilla by Nature

    Organic

    Conventional

    UK Tortilla by Source

    Corn

    Wheat

    UK Tortilla by Category

    Standard/regular

    Gluten-free

    UK Tortilla by Distribution Channel

    B2B

    B2C

    Spain Outlook (USD Million, 2018-2032)

    Spain Tortilla by Type

    Industrial

    Artisanal

    Spain Tortilla by Processing Type

    Fresh

    Frozen

    Spain Tortilla by Product Type

    Tortilla mix

    Pre-cooked tortilla

    Tostadas

    Tortilla chips

    Taco shell

    Others

    Spain Tortilla by Nature

    Organic

    Conventional

    Spain Tortilla by Source

    Corn

    Wheat

    Spain Tortilla by Category

    Standard/regular

    Gluten-free

    Spain Tortilla by Distribution Channel

    B2B

    B2C

    Italy Outlook (USD Million, 2018-2032)

    Italy Tortilla by Type

    Industrial

    Artisanal

    Italy Tortilla by Processing Type

    Fresh

    Frozen

    Italy Tortilla by Product Type

    Tortilla mix

    Pre-cooked tortilla

    Tostadas

    Tortilla chips

    Taco shell

    Others

    Italy Tortilla by Nature

    Organic

    Conventional

    Italy Tortilla by Source

    Corn

    Wheat

    Italy Tortilla by Category

    Standard/regular

    Gluten-free

    Italy Tortilla by Distribution Channel

    B2B

    B2C

    Rest of Europe Outlook (USD Million, 2018-2032)

    Rest of Europe Tortilla by Type

    Industrial

    Artisanal

    Rest of Europe Tortilla by Processing Type

    Fresh

    Frozen

    Rest of Europe Tortilla by Product Type

    Tortilla mix

    Pre-cooked tortilla

    Tostadas

    Tortilla chips

    Taco shell

    Others

    Rest of Europe Tortilla by Nature

    Organic

    Conventional

    Rest of Europe Tortilla by Source

    Corn

    Wheat

    Rest of Europe Tortilla by Category

    Standard/regular

    Gluten-free

    Rest of Europe Tortilla by Distribution Channel

    B2B

    B2C

    Asia-Pacific Outlook (USD Million, 2018-2032)

    Asia-Pacific Tortilla by Type

    Industrial

    Artisanal

    Asia-Pacific Tortilla by Processing Type

    Fresh

    Frozen

    Asia-Pacific Tortilla by Product Type

    Tortilla mix

    Pre-cooked tortilla

    Tostadas

    Tortilla chips

    Taco shell

    Others

    Asia-Pacific Tortilla by Nature

    Organic

    Conventional

    Asia-Pacific Tortilla by Source

    Corn

    Wheat

    Asia-Pacific Tortilla by Category

    Standard/regular

    Gluten-free

    Asia-Pacific Tortilla by Distribution Channel

    B2B

    B2C

    China Outlook (USD Million, 2018-2032)

    China Tortilla by Type

    Industrial

    Artisanal

    China Tortilla by Processing Type

    Fresh

    Frozen

    China Tortilla by Product Type

    Tortilla mix

    Pre-cooked tortilla

    Tostadas

    Tortilla chips

    Taco shell

    Others

    China Tortilla by Nature

    Organic

    Conventional

    China Tortilla by Source

    Corn

    Wheat

    China Tortilla by Category

    Standard/regular

    Gluten-free

    China Tortilla by Distribution Channel

    B2B

    B2C

    India Outlook (USD Million, 2018-2032)

    India Tortilla by Type

    Industrial

    Artisanal

    India Tortilla by Processing Type

    Fresh

    Frozen

    India Tortilla by Product Type

    Tortilla mix

    Pre-cooked tortilla

    Tostadas

    Tortilla chips

    Taco shell

    Others

    India Tortilla by Nature

    Organic

    Conventional

    India Tortilla by Source

    Corn

    Wheat

    India Tortilla by Category

    Standard/regular

    Gluten-free

    India Tortilla by Distribution Channel

    B2B

    B2C

    Japan Outlook (USD Million, 2018-2032)

    Japan Tortilla by Type

    Industrial

    Artisanal

    Japan Tortilla by Processing Type

    Fresh

    Frozen

    Japan Tortilla by Product Type

    Tortilla mix

    Pre-cooked tortilla

    Tostadas

    Tortilla chips

    Taco shell

    Others

    Japan Tortilla by Nature

    Organic

    Conventional

    Japan Tortilla by Source

    Corn

    Wheat

    Japan Tortilla by Category

    Standard/regular

    Gluten-free

    Japan Tortilla by Distribution Channel

    B2B

    B2C

    South Korea Outlook (USD Million, 2018-2032)

    South Korea Tortilla by Type

    Industrial

    Artisanal

    South Korea Tortilla by Processing Type

    Fresh

    Frozen

    South Korea Tortilla by Product Type

    Tortilla mix

    Pre-cooked tortilla

    Tostadas

    Tortilla chips

    Taco shell

    Others

    South Korea Tortilla by Nature

    Organic

    Conventional

    South Korea Tortilla by Source

    Corn

    Wheat

    South Korea Tortilla by Category

    Standard/regular

    Gluten-free

    South Korea Tortilla by Distribution Channel

    B2B

    B2C

    Australia & New Zealand Outlook (USD Million, 2018-2032)

    Australia & New Zealand Tortilla by Type

    Industrial

    Artisanal

    Australia & New Zealand Tortilla by Processing Type

    Fresh

    Frozen

    Australia & New Zealand Tortilla by Product Type

    Tortilla mix

    Pre-cooked tortilla

    Tostadas

    Tortilla chips

    Taco shell

    Others

    Australia & New Zealand Tortilla by Nature

    Organic

    Conventional

    Australia & New Zealand Tortilla by Source

    Corn

    Wheat

    Australia & New Zealand Tortilla by Category

    Standard/regular

    Gluten-free

    Australia & New Zealand Tortilla by Distribution Channel

    B2B

    B2C

    Thailand Outlook (USD Million, 2018-2032)

    Thailand Tortilla by Type

    Industrial

    Artisanal

    Thailand Tortilla by Processing Type

    Fresh

    Frozen

    Thailand Tortilla by Product Type

    Tortilla mix

    Pre-cooked tortilla

    Tostadas

    Tortilla chips

    Taco shell

    Others

    Thailand Tortilla by Nature

    Organic

    Conventional

    Thailand Tortilla by Source

    Corn

    Wheat

    Thailand Tortilla by Category

    Standard/regular

    Gluten-free

    Thailand Tortilla by Distribution Channel

    B2B

    B2C

    Rest of Asia-Pacific Outlook (USD Million, 2018-2032)

    Rest of Asia-Pacific Tortilla by Type

    Industrial

    Artisanal

    Rest of Asia-Pacific Tortilla by Processing Type

    Fresh

    Frozen

    Rest of Asia-Pacific Tortilla by Product Type

    Tortilla mix

    Pre-cooked tortilla

    Tostadas

    Tortilla chips

    Taco shell

    Others

    Rest of Asia-Pacific Tortilla by Nature

    Organic

    Conventional

    Rest of Asia-Pacific Tortilla by Source

    Corn

    Wheat

    Rest of Asia-Pacific Tortilla by Category

    Standard/regular

    Gluten-free

    Rest of Asia-Pacific Tortilla by Distribution Channel

    B2B

    B2C

    South America Outlook (USD Million, 2018-2032)

    South America Tortilla by Type

    Industrial

    Artisanal

    South America Tortilla by Processing Type

    Fresh

    Frozen

    South America Tortilla by Product Type

    Tortilla mix

    Pre-cooked tortilla

    Tostadas

    Tortilla chips

    Taco shell

    Others

    South America Tortilla by Nature

    Organic

    Conventional

    South America Tortilla by Source

    Corn

    Wheat

    South America Tortilla by Category

    Standard/regular

    Gluten-free

    South America Tortilla by Distribution Channel

    B2B

    B2C

    Brazil Outlook (USD Million, 2018-2032)

    Brazil Tortilla by Type

    Industrial

    Artisanal

    Brazil Tortilla by Processing Type

    Fresh

    Frozen

    Brazil Tortilla by Product Type

    Tortilla mix

    Pre-cooked tortilla

    Tostadas

    Tortilla chips

    Taco shell

    Others

    Brazil Tortilla by Nature

    Organic

    Conventional

    Brazil Tortilla by Source

    Corn

    Wheat

    Brazil Tortilla by Category

    Standard/regular

    Gluten-free

    Brazil Tortilla by Distribution Channel

    B2B

    B2C

    Argentina Outlook (USD Million, 2018-2032)

    Argentina Tortilla by Type

    Industrial

    Artisanal

    Argentina Tortilla by Processing Type

    Fresh

    Frozen

    Argentina Tortilla by Product Type

    Tortilla mix

    Pre-cooked tortilla

    Tostadas

    Tortilla chips

    Taco shell

    Others

    Argentina Tortilla by Nature

    Organic

    Conventional

    Argentina Tortilla by Source

    Corn

    Wheat

    Argentina Tortilla by Category

    Standard/regular

    Gluten-free

    Argentina Tortilla by Distribution Channel

    B2B

    B2C

    Rest of South America Outlook (USD Million, 2018-2032)

    Rest of South America Tortilla by Type

    Industrial

    Artisanal

    Rest of South America Tortilla by Processing Type

    Fresh

    Frozen

    Rest of South America Tortilla by Product Type

    Tortilla mix

    Pre-cooked tortilla

    Tostadas

    Tortilla chips

    Taco shell

    Others

    Rest of South America Tortilla by Nature

    Organic

    Conventional

    Rest of South America Tortilla by Source

    Corn

    Wheat

    Rest of South America Tortilla by Category

    Standard/regular

    Gluten-free

    Rest of South America Tortilla by Distribution Channel

    B2B

    B2C

    Middle East & Africa Outlook (USD Million, 2018-2032)

    Middle East & Africa Tortilla by Type

    Industrial

    Artisanal

    Middle East & Africa Tortilla by Processing Type

    Fresh

    Frozen

    Middle East & Africa Tortilla by Product Type

    Tortilla mix

    Pre-cooked tortilla

    Tostadas

    Tortilla chips

    Taco shell

    Others

    Middle East & Africa Tortilla by Nature

    Organic

    Conventional

    Middle East & Africa Tortilla by Source

    Corn

    Wheat

    Middle East & Africa Tortilla by Category

    Standard/regular

    Gluten-free

    Middle East & Africa Tortilla by Distribution Channel

    B2B

    B2C

    GCC Countries Outlook (USD Million, 2018-2032)

    GCC Countries Tortilla by Type

    Industrial

    Artisanal

    GCC Countries Tortilla by Processing Type

    Fresh

    Frozen

    GCC Countries Tortilla by Product Type

    Tortilla mix

    Pre-cooked tortilla

    Tostadas

    Tortilla chips

    Taco shell

    Others

    GCC Countries Tortilla by Nature

    Organic

    Conventional

    GCC Countries Tortilla by Source

    Corn

    Wheat

    GCC Countries Tortilla by Category

    Standard/regular

    Gluten-free

    GCC Countries Tortilla by Distribution Channel

    B2B

    B2C

    Turkey Outlook (USD Million, 2018-2032)

    Turkey Tortilla by Type

    Industrial

    Artisanal

    Turkey Tortilla by Processing Type

    Fresh

    Frozen

    Turkey Tortilla by Product Type

    Tortilla mix

    Pre-cooked tortilla

    Tostadas

    Tortilla chips

    Taco shell

    Others

    Turkey Tortilla by Nature

    Organic

    Conventional

    Turkey Tortilla by Source

    Corn

    Wheat

    Turkey Tortilla by Category

    Standard/regular

    Gluten-free

    Turkey Tortilla by Distribution Channel

    B2B

    B2C

    Northern Africa Outlook (USD Million, 2018-2032)

    Northern Africa Tortilla by Type

    Industrial

    Artisanal

    Northern Africa Tortilla by Processing Type

    Fresh

    Frozen

    Northern Africa Tortilla by Product Type

    Tortilla mix

    Pre-cooked tortilla

    Tostadas

    Tortilla chips

    Taco shell

    Others

    Northern Africa Tortilla by Nature

    Organic

    Conventional

    Northern Africa Tortilla by Source

    Corn

    Wheat

    Northern Africa Tortilla by Category

    Standard/regular

    Gluten-free

    Northern Africa Tortilla by Distribution Channel

    B2B

    B2C

    Southern Africa Outlook (USD Million, 2018-2032)

    Southern Africa Tortilla by Type

    Industrial

    Artisanal

    Southern Africa Tortilla by Processing Type

    Fresh

    Frozen

    Southern Africa Tortilla by Product Type

    Tortilla mix

    Pre-cooked tortilla

    Tostadas

    Tortilla chips

    Taco shell

    Others

    Southern Africa Tortilla by Nature

    Organic

    Conventional

    Southern Africa Tortilla by Source

    Corn

    Wheat

    Southern Africa Tortilla by Category

    Standard/regular

    Gluten-free

    Southern Africa Tortilla by Distribution Channel

    B2B

    B2C

    Infographic

    Free Sample Request

    Kindly complete the form below to receive a free sample of this Report

    Get Free Sample

    Customer Strories

    “I am very pleased with how market segments have been defined in a relevant way for my purposes (such as "Portable Freezers & refrigerators" and "last-mile"). In general the report is well structured. Thanks very much for your efforts.”

    Victoria Milne

    Founder
    Case Study
    Chemicals and Materials