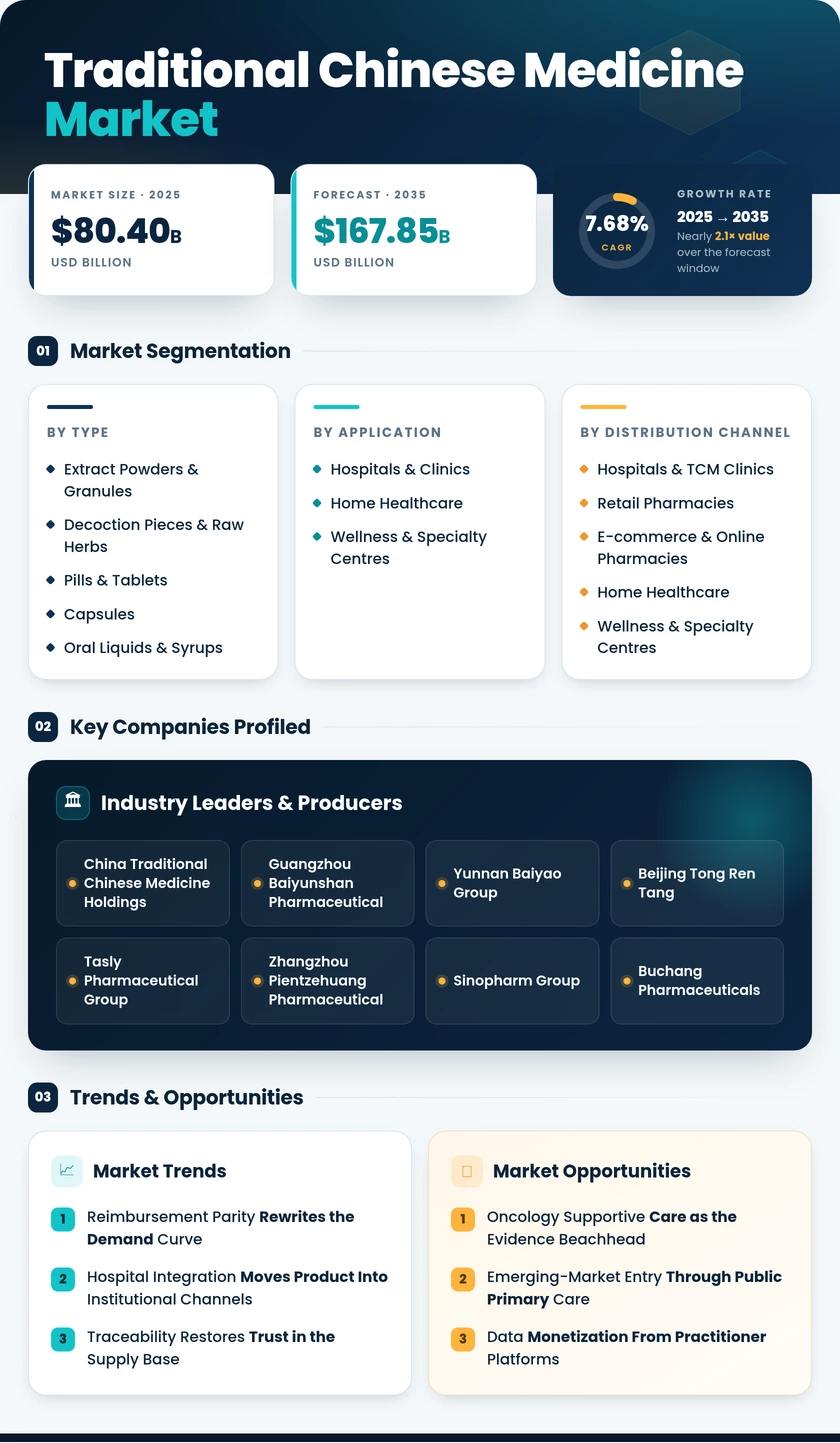
Traditional Chinese Medicine Market (2026 - 2035)

Traditional Chinese Medicine Market Research Report: By Product Type (Herbal Medicine, Acupuncture, Cupping Therapy, Moxibustion, Qigong), By Therapeutic Application (Pain Management, Respiratory Disorders, Digestive Disorders, Mental Health, Musculoskeletal Disorders), By Distribution Channel (Offline Stores, Online Stores, Pharmacies, Specialty Stores) and By Regional (North America, Europe, South America, Asia Pacific, Middle East and Africa) - Growth & Industry Forecast 2025 To 2035.

Forecast Period
2026-2035
CAGR
7.68%
2025 Market Size
USD 80.40 Billion
2035 Market Size
USD 167.85 Billion
Healthcare ● Updated August 2026 Report ID: MRFR/HC/40909-HCR | Pages: 200 | Author: Rahul Gotadki, Vikita Thakur
  1. 1 Market Summary |
    1. 1.1 Study Assumptions & Market Definition |
    2. 1.2 Scope of the Study |
    3. 1.3 Research Methodology
  2. 2 Key Report Takeaways |
    1. 2.1 By Therapy Type |
    2. 2.2 By Product Form and Application |
    3. 2.3 By Geography
  3. 3 Market Size & Forecast (2021–2035) |
    1. 3.1 Historical Market Size (2021–2025) |
    2. 3.2 Current & Forecast Market Size (2026–2035) |
    3. 3.3 Year-over-Year Growth Analysis
  4. 4 Driver Impact Analysis |
    1. 4.1 Reimbursement Parity Rewrites the Demand Curve |
    2. 4.2 Hospital Integration Moves Product Into Institutional Channels |
    3. 4.3 Traceability Restores Trust in the Supply Base |
    4. 4.4 Evidence Generation Unlocks Non-Domestic Payers
  5. 5 Restraints Impact Analysis |
    1. 5.1 Evidence Standards Remain the Export Bottleneck |
    2. 5.2 Botanical Input Costs Swing Violently |
    3. 5.3 Safety Signals Invite Disproportionate Restriction
  6. 6 Opportunities |
    1. 6.1 Oncology Supportive Care as the Evidence Beachhead |
    2. 6.2 Emerging-Market Entry Through Public Primary Care |
    3. 6.3 Data Monetization From Practitioner Platforms |
    4. 6.4 Precision Cultivation and Contract Farming |
    5. 6.5 Ready-to-Consume Formats for Younger Cohorts
  7. 7 Regional Market Share & Country-Level Analysis |
    1. 7.1 North America | |
      1. 7.1.1 US | |
      2. 7.1.2 Canada | |
      3. 7.1.3 Mexico |
    2. 7.2 Europe | |
      1. 7.2.1 Germany | |
      2. 7.2.2 UK | |
      3. 7.2.3 France | |
      4. 7.2.4 Italy | |
      5. 7.2.5 Spain | |
      6. 7.2.6 Nordic Countries | |
      7. 7.2.7 Russia | |
      8. 7.2.8 Rest of Europe |
    3. 7.3 Asia-Pacific | |
      1. 7.3.1 China | |
      2. 7.3.2 India | |
      3. 7.3.3 Japan | |
      4. 7.3.4 South Korea | |
      5. 7.3.5 ASEAN | |
      6. 7.3.6 Rest of Asia-Pacific |
    4. 7.4 South America | |
      1. 7.4.1 Brazil | |
      2. 7.4.2 Argentina | |
      3. 7.4.3 Rest of South America |
    5. 7.5 Middle East & Africa | |
      1. 7.5.1 Saudi Arabia | |
      2. 7.5.2 UAE | |
      3. 7.5.3 South Africa | |
      4. 7.5.4 Egypt | |
      5. 7.5.5 Rest of Middle East & Africa
  8. 8 Future Outlook (2026–2035) |
    1. 8.1 AI-Assisted Syndrome Differentiation |
    2. 8.2 Platform Economics in Distribution |
    3. 8.3 Sustainable Sourcing Becomes a License to Operate |
    4. 8.4 Demographic Pull From Aging Populations
  9. 9 Market Segmentation Analysis |
    1. 9.1 By Therapy Type | |
      1. 9.1.1 Herbal Medicine | |
      2. 9.1.2 Acupuncture | |
      3. 9.1.3 Cupping Therapy | |
      4. 9.1.4 Aroma Therapy | |
      5. 9.1.5 Compounding Therapy | |
      6. 9.1.6 Magneto Therapy |
    2. 9.2 By Product Form | |
      1. 9.2.1 Extract Powders & Granules | |
      2. 9.2.2 Decoction Pieces & Raw Herbs | |
      3. 9.2.3 Pills & Tablets | |
      4. 9.2.4 Capsules | |
      5. 9.2.5 Oral Liquids & Syrups | |
      6. 9.2.6 Topicals & Patches |
    3. 9.3 By Application | |
      1. 9.3.1 Pain Management | |
      2. 9.3.2 Osteoarthritis & Musculoskeletal | |
      3. 9.3.3 Respiratory, Cold & Flu | |
      4. 9.3.4 Digestive Disorders | |
      5. 9.3.5 Oncology Supportive Care | |
      6. 9.3.6 Women's Health & Fertility | |
      7. 9.3.7 Other Applications |
    4. 9.4 By End User | |
      1. 9.4.1 Hospitals & Clinics | |
      2. 9.4.2 Home Healthcare | |
      3. 9.4.3 Wellness & Specialty Centres |
    5. 9.5 By Distribution Channel | |
      1. 9.5.1 Hospitals & TCM Clinics | |
      2. 9.5.2 Retail Pharmacies | |
      3. 9.5.3 E-commerce & Online Pharmacies | |
      4. 9.5.4 Home Healthcare | |
      5. 9.5.5 Wellness & Specialty Centres
  10. 10 Competitive Landscape |
    1. 10.1 Market Concentration Analysis (2026) |
    2. 10.2 Competitive Benchmarking Matrix |
    3. 10.3 Company Profiles | |
      1. 10.3.1 China Traditional Chinese Medicine Holdings | |
      2. 10.3.2 Guangzhou Baiyunshan Pharmaceutical | |
      3. 10.3.3 Yunnan Baiyao Group | |
      4. 10.3.4 Beijing Tong Ren Tang | |
      5. 10.3.5 Tasly Pharmaceutical Group | |
      6. 10.3.6 Zhangzhou Pientzehuang Pharmaceutical | |
      7. 10.3.7 Sinopharm Group | |
      8. 10.3.8 Buchang Pharmaceuticals | |
      9. 10.3.9 Shanghai Pharmaceuticals Holding | |
      10. 10.3.10 Dong-E-E-Jiao | |
      11. 10.3.11 Jiangzhong Pharmaceutical
  11. 11 Recent News & Developments
  12. 12 Report Scope & Methodology |
    1. 12.1 Study Period & Base Year |
    2. 12.2 Valuation Currency & Assumptions |
    3. 12.3 Abbreviations
  13. 13 Detailed Sources & Citations
  14. 14 Frequently Asked Questions
  15. 15 LIST OF TABLES |
  16. TABLE 1 Global Traditional Chinese Medicine Market Size & Forecast, by Revenue (USD Billion), 2021–2035 |
  17. TABLE 2 Global Traditional Chinese Medicine Market – Year-over-Year Growth Analysis, 2021–2035 |
  18. TABLE 3 Driver Impact Analysis Matrix, 2026–2035 |
  19. TABLE 4 Restraint Impact Analysis Matrix, 2026–2035 |
  20. TABLE 5 Global Market Size, by Region, 2021–2035 (USD Billion) |
  21. TABLE 6 North America Market Size, by Country, 2021–2035 (USD Billion) |
  22. TABLE 7 Europe Market Size, by Country, 2021–2035 (USD Billion) |
  23. TABLE 8 Asia-Pacific Market Size, by Country, 2021–2035 (USD Billion) |
  24. TABLE 9 South America Market Size, by Country, 2021–2035 (USD Billion) |
  25. TABLE 10 Middle East & Africa Market Size, by Country, 2021–2035 (USD Billion) |
  26. TABLE 11 Global Market Size, by Therapy Type, 2021–2035 (USD Billion) |
  27. TABLE 12 Global Market Size, by Product Form, 2021–2035 (USD Billion) |
  28. TABLE 13 Global Market Size, by Application, 2021–2035 (USD Billion) |
  29. TABLE 14 Global Market Size, by End User, 2021–2035 (USD Billion) |
  30. TABLE 15 Global Market Size, by Distribution Channel, 2021–2035 (USD Billion) |
  31. TABLE 16 North America Market Size, by Therapy Type, 2021–2035 (USD Billion) |
  32. TABLE 17 North America Market Size, by Application, 2021–2035 (USD Billion) |
  33. TABLE 18 Europe Market Size, by Therapy Type, 2021–2035 (USD Billion) |
  34. TABLE 19 Europe Market Size, by Product Form, 2021–2035 (USD Billion) |
  35. TABLE 20 Asia-Pacific Market Size, by Therapy Type, 2021–2035 (USD Billion) |
  36. TABLE 21 Asia-Pacific Market Size, by Distribution Channel, 2021–2035 (USD Billion) |
  37. TABLE 22 South America Market Size, by Application, 2021–2035 (USD Billion) |
  38. TABLE 23 Middle East & Africa Market Size, by End User, 2021–2035 (USD Billion) |
  39. TABLE 24 Competitive Benchmarking Matrix, 2026 |
  40. TABLE 25 Company Profiles – Key Players |
  41. TABLE 26 Recent Developments & Strategic Announcements, 2023–2025 |
  42. TABLE 27 Report Scope & Methodology Summary |
  43. TABLE 28 Detailed Sources & Citations
  44. 16 LIST OF FIGURES |
  45. FIGURE 1 Market Dynamics – Drivers, Restraints, Opportunities and Challenges |
  46. FIGURE 2 Industry Value Chain Analysis – Cultivation to Dispensing |
  47. FIGURE 3 Porter's Five Forces Analysis |
  48. FIGURE 4 Global Market Size Trend & Forecast, 2021–2035 (USD Billion) |
  49. FIGURE 5 Year-over-Year Growth Rate Trend, 2022–2035 (%) |
  50. FIGURE 6 Market Share by Therapy Type, 2025 vs 2035 (%) |
  51. FIGURE 7 Market Share by Product Form, 2025 (%) |
  52. FIGURE 8 Market Share by Application, 2025 (%) |
  53. FIGURE 9 Market Share by End User, 2025 (%) |
  54. FIGURE 10 Market Share by Distribution Channel, 2025 vs 2035 (%) |
  55. FIGURE 11 Regional Market Share, 2025 (%) |
  56. FIGURE 12 Regional CAGR Comparison, 2026–2035 (%) |
  57. FIGURE 13 Asia-Pacific Country-Level Share Breakdown, 2025 (%) |
  58. FIGURE 14 Europe Country-Level Share Breakdown, 2025 (%) |
  59. FIGURE 15 Competitive Landscape – Revenue Share Positioning Map, 2026 |
  60. FIGURE 16 Strategic Developments Heatmap, 2023–2025
Share::
Request Free Sample

Segmentation Quick Reference

DimensionSub-SegmentsDominant SegmentFastest Growing Segment
By Therapy TypeAcupuncture; Cupping Therapy; Herbal Medicine; Aroma Therapy; Compounding Therapy; Magneto TherapyHerbal MedicineAcupuncture
By Product FormExtract Powders & Granules; Decoction Pieces & Raw Herbs; Pills & Tablets; Capsules; Oral Liquids & Syrups; Topicals & PatchesExtract Powders & GranulesTopicals & Patches
By ApplicationPain Management; Osteoarthritis & Musculoskeletal; Respiratory, Cold & Flu; Digestive Disorders; Oncology Supportive Care; Women's Health & Fertility; Other ApplicationsPain ManagementOncology Supportive Care
By End UserHospitals & Clinics; Home Healthcare; Wellness & Specialty CentresHospitals & ClinicsHome Healthcare
By Distribution ChannelHospitals & TCM Clinics; Retail Pharmacies; E-commerce & Online Pharmacies; Home Healthcare; Wellness & Specialty CentresHospitals & TCM ClinicsE-commerce & Online Pharmacies
By GeographyNorth America; Europe; Asia-Pacific; South America; Middle East & AfricaAsia-PacificAsia-Pacific


Market Segmentation Overview

By Therapy Type

Sub-SegmentKey Trend
AcupunctureInsurer coverage for chronic pain converts sessions into billable, repeatable care episodes
Cupping TherapyAthletic endorsement and sports recovery clinics normalize the modality outside Asia
Herbal MedicineStandardized granules displace hand-prepared decoctions in institutional dispensing
Aroma TherapyRetail wellness channels blur the line between therapeutic and lifestyle purchasing
Compounding TherapyTertiary hospitals invest in automated compounding for personalized prescriptions
Magneto TherapyFalling device costs push adoption into home self-care


Therapy mix is bifurcating. Product-led herbal revenue scales with manufacturing capacity, while service-led modalities scale only with trained practitioner supply — which is why acupuncture growth tracks credentialing policy more closely than consumer demand.

By Product Form

Sub-SegmentKey Trend
Extract Powders & GranulesAutomated dispensing cabinets cut hospital pharmacy labor and create auditable batch records
Decoction Pieces & Raw HerbsTraditional prescribing persists in rural and county-level practice on price advantage
Pills & TabletsFamiliar dosage forms drive retail self-medication and export acceptance
CapsulesPreferred format for Western markets where supplement conventions govern presentation
Oral Liquids & SyrupsPediatric and geriatric compliance advantages sustain steady demand
Topicals & PatchesMusculoskeletal self-care and opioid-sparing protocols lift volumes


Format is now a competitive weapon. Producers who can deliver certified-potency granules and convenience-first consumer formats capture both the tender channel and the wellness shelf without splitting their manufacturing base.

By Application

Sub-SegmentKey Trend
Pain ManagementOpioid-alternative protocols embed TCM into mainstream pain pathways
Osteoarthritis & MusculoskeletalAging demographics expand the treated population year after year
Respiratory, Cold & FluSeasonal OTC purchasing provides a stable but low-value volume base
Digestive DisordersFunctional gastrointestinal diagnoses drive repeat prescribing
Oncology Supportive CareAdjunct trials position the segment for payer recognition
Women's Health & FertilityIVF adjunct protocols create high-value, protocol-driven demand
Other ApplicationsSleep, dermatology, and metabolic support absorb wellness spend


Indication mix is migrating up the value curve. Chronic and adjunct applications carry longer treatment courses and higher per-patient revenue than the acute self-limiting conditions that historically defined category volume.

By End User

Sub-SegmentKey Trend
Hospitals & ClinicsDepartmental mandates and tender procurement lock in institutional volume
Home HealthcareChronic self-management and subscription refills build recurring demand
Wellness & Specialty CentresPreventive and lifestyle budgets fund treatment outside insurance systems


Institutional buyers set quality standards that eventually cascade to retail. Once hospitals require fingerprint chromatogram data, consumers begin expecting equivalent certification on the pharmacy shelf.

By Distribution Channel

Sub-SegmentKey Trend
Hospitals & TCM ClinicsReimbursed dispensing keeps this the largest and most defensible channel
Retail PharmaciesWalk-in OTC purchasing anchors brand-led competition
E-commerce & Online PharmaciesTeleconsultation-linked fulfilment converts one-off buyers into subscribers
Home HealthcareRefill automation and adherence prompts extend treatment duration
Wellness & Specialty CentresBundled service-and-product packages raise transaction value


Channel economics are being rewritten by platforms that own the consultation, the prescription, and the fulfilment in one transaction — a structure that shifts margin away from manufacturers unless they secure direct-to-consumer positions of their own.




Share::
Request Free Sample
Download PDF ×

We do not share your information with anyone. However, we may send you emails based on your report interest from time to time. You may contact us at any time to opt-out.