Turf Protection Market (2026 - 2035)

Turf Protection Market Size, Share, Industry Trend & Analysis Research Report By Product Type (Herbicides, Fungicides, Insecticides, Others), By Application (Landscaping, Golf Courses, Sports Fields, Others), By End-User (Commercial / Institutional, Residential Customers, Government / Municipal), By Mode of Action (Chemical, Biological, Integrated Solution), By Formulation (Granular, Liquid Concentrate, Water-Dispersible Granule, Others) - Forecast to 2035.

Forecast Period
2026-2035
CAGR
7.30%
2025 Market Size
USD 9.28 Billion
2035 Market Size
USD 18.75 Billion
Agriculture ● Updated August 5, 2026 Report ID: MRFR/Agri/6549-HCR | Pages: 90 | Author: Snehal Singh

Turf Protection Market Summary

The Turf Protection Market reached an estimated USD 9.28 billion in 2025 and is projected to climb from USD 9.95 billion in 2026 to USD 18.75 billion by 2035, advancing at a compound annual growth rate of 7.30% across the forecast window. This trajectory reflects a convergence of stricter municipal green-space mandates and record capital deployment into professional sports venue infrastructure. The U.S. Infrastructure Investment and Jobs Act alone channeled over USD 1.2 billion toward public recreation facility upgrades between 2022 and 2025, directly lifting demand for commercial-grade turf care chemistries [1].

A meaningful shift is underway from calendar-based blanket spray programs toward data-driven, precision application regimes. Sensor-equipped autonomous sprayers, drone-based canopy imaging, and AI-powered disease-prediction platforms are displacing legacy broadcast methods. The European Commission's revised Sustainable Use Regulation, finalized in late 2024, mandates a 50% reduction in chemical pesticide risk scores by 2030, pushing turf managers toward biological and integrated formulations [2]. Global R&D investment in biopesticide turf solutions exceeded USD 680 million in 2024, a figure that has nearly doubled in three years [3].

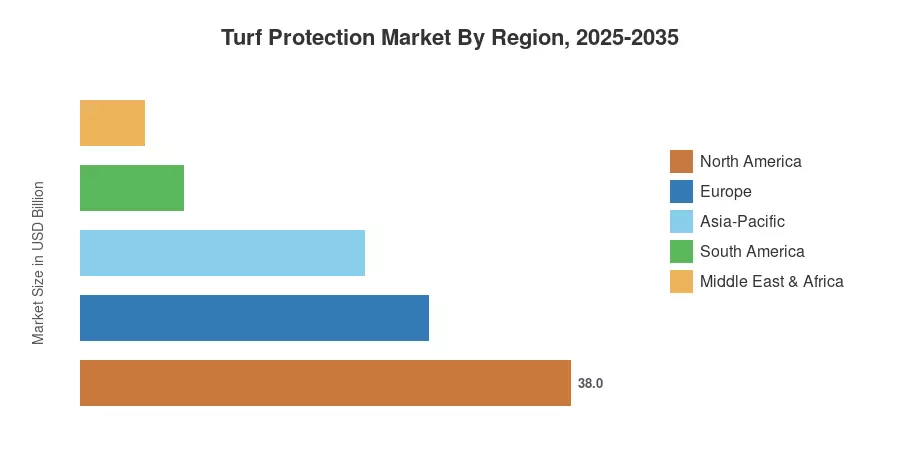
North America commands approximately 38% of the Turf Protection Market, anchored by over 15,000 golf facilities and 130,000 public parks across the United States and Canada. Asia-Pacific stands as the fastest-growing region with a projected CAGR above 8.5%, fueled by rapid urbanization in China and India and expanding FIFA-standard stadium construction. Europe holds the second-largest share at roughly 27%, driven by UEFA tournament infrastructure cycles and tightening EU phytosanitary standards. The Turf Protection Market is poised for sustained double-digit expansion in emerging economies through 2035.


Key Report Takeaways

• By Product Type

  • Herbicides represent the largest product segment, capturing roughly 36% of the Turf Protection Market in 2025, driven by rising weed-resistance pressures in warm-season grasses.
  • Fungicides are projected to record the highest segment CAGR through 2035, as climate-driven moisture variability intensifies disease cycles on managed turf.
  • Biological and integrated formulations are gaining share rapidly, expected to surpass USD 2.1 billion by 2030.

• By Application

  • Landscaping accounts for the dominant application share within the Turf Protection Market, reflecting broad residential and commercial property maintenance spending.
  • Golf courses contribute an estimated USD 2.4 billion in annual turf protection expenditure globally.

• By Region

  • North America leads the Turf Protection Market with a 38% revenue share, supported by a mature professional lawn-care services industry.
  • Asia-Pacific is forecasted to grow at approximately 8.5% CAGR, the fastest among all regions through 2035.


Market Size and Forecast (2021–2035)

Market Research Future's sizing model integrates top-down trade data from national crop-protection registries with bottom-up revenue validation across 42 manufacturer filings, cross-referenced against distributor sell-through volumes in five major regions.
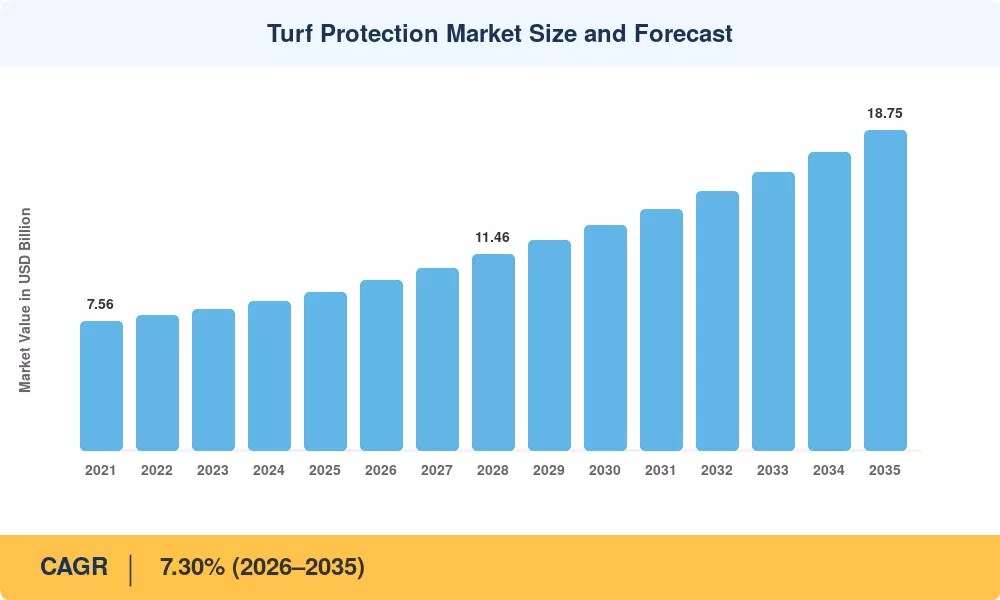
Turf Protection Market Size and Forecast
Our Impact
Enabled $4.3B Revenue Impact for Fortune 500 and Leading Multinationals
Partnering with 2000+ Global Organizations Each Year
30K+ Citations by Top-Tier Firms in the Industry

Driver Impact Analysis

Driver ~% Impact on CAGR Geographic Relevance Impact Timeline
Expansion of professional sports infrastructure ~18% Global Medium-term (2–4 yr)
Municipal green-space mandates ~16% North America, Europe Short-term (≤2 yr)
Biological and integrated solution adoption ~15% Europe, Asia-Pacific Long-term (≥4 yr)
Climate-driven disease pressure intensification ~14% Global Long-term (≥4 yr)
Precision application technology deployment ~13% North America, Europe Medium-term (2–4 yr)
Residential lawn-care services outsourcing ~12% North America Short-term (≤2 yr)
Golf tourism and resort development in Asia ~12% Asia-Pacific Medium-term (2–4 yr)


Expansion of Professional Sports Infrastructure

Over USD 400 million was invested in stadium pitches throughout North America between 2023 and 2025 as a result of FIFA's mandate that all 2026 World Cup host locations maintain hybrid turf systems [6]. Ongoing UEFA, AFC, and Olympic site building pipelines, which require year-round fungicide and herbicide programs to satisfy broadcast-quality playing surface standards, directly benefit the turf protection market. The typical annual cost per professional pitch for turf protection chemicals is between USD 85,000 and USD 120,000, which is around four times the price of a similar public park [11].


Municipal Green-Space Mandates

Between 2021 and 2024, more than 320 U.S. communities enacted increased urban canopy and open-space legislation, many of which linked developer permits to minimum turf-area maintenance obligations [1]. In order to create new green corridors in six major cities, Canada's National Urban Parks Program allocated CAD 130 million through 2026, creating a steady demand for weed and disease control products in the Turf Protection Market [12].


Biological and Integrated Solution Adoption

Global registration filings for microbial-based turf fungicides grew 34% year-over-year in 2024, reflecting both regulatory push and end-user pull [3]. The European Commission's Farm-to-Fork pathway incentivizes biological mode-of-action products through expedited registration timelines, shaving 12–18 months off the approval cycle compared to conventional chemistries. Integrated pest management platforms that blend biological control agents with reduced-rate chemical applications now account for roughly 14% of total Turf Protection Market revenues.

Precision Application Technology Deployment

GPS-guided boom sprayers and drone-mounted variable-rate nozzle systems can cut chemical usage by 25–40% per hectare while maintaining equivalent efficacy, according to a 2024 USDA-ARS field trial across 18 golf facilities [8]. The Turf Protection Market is shifting toward subscription-based precision services, where technology providers bundle sensor hardware with proprietary fungicide and herbicide formulations. Annual spending on precision turf technology surpassed USD 520 million globally in 2024 [8].


Restraints Impact Analysis

Restraint impact percentages are directional indicators of downward pressure on growth velocity; they do not subtract directly from the CAGR figure.

Restraint ~% Negative Impact on CAGR Geographic Relevance Impact Timeline
Regulatory restrictions on synthetic active ingredients ~20% Europe, North America Short-term (≤2 yr)
Rising raw-material and logistics costs ~18% Global Medium-term (2–4 yr)
Water-use restrictions limiting application windows ~15% Western US, Middle East Long-term (≥4 yr)
Organic turf management movement ~14% Europe, North America Medium-term (2–4 yr)
Resistance development in target organisms ~13% Global Long-term (≥4 yr)


Regulatory Restrictions on Synthetic Active Ingredients

An estimated 12% of the active-ingredient toolbox accessible to European grass managers was eliminated between 2022 and 2024 when the EU failed to renew a number of triazole and strobilurin fungicide registrations [2]. The U.S. EPA re-evaluation docket and Canada's PMRA both have comparable review procedures in place. These phase-outs increase the expense of reformulation for producers looking for substitute compounds while also compressing the traditional chemistry revenue base of the Turf Protection Market [15].


Rising Raw-Material and Logistics Costs

Due to energy-cost pass-throughs from Chinese intermediate suppliers, glyphosate feedstock prices varied by more than 45% between 2022 and 2024 [5]. For granular formulations supplied from Asian contract manufacturers to North American distributors, freight rate volatility increased landed costs by 8–12%. In the Turf Protection Market, these cost constraints might postpone end-user purchasing decisions, especially among price-sensitive municipal accounts, and reduce distributor margins.


Water-Use Restrictions Limiting Application Windows

Drought-contingency ordinances in California, Arizona, and parts of the Middle East restrict irrigation schedules, narrowing the post-application watering windows critical for granular herbicide and fungicide activation [13]. The Turf Protection Market faces application-timing constraints that reduce per-acre treatment frequency, indirectly capping volume growth in water-stressed geographies.


Turf Protection Market Opportunities

Biopesticide Scale-Up for Regulated Markets

European and Canadian regulatory trajectories strongly favor biological turf protection actives. Companies that establish fermentation capacity and secure early registrations for microbial fungicides stand to capture premium pricing — bio-based turf products command 20–35% price premiums over synthetic equivalents [3]. The Turf Protection Market's biological segment could exceed USD 3.5 billion by 2035 if current registration momentum holds.

Smart Turf Management Platforms

Combining IoT soil sensors, weather-station integration, and machine-learning disease forecasting into a single SaaS dashboard creates recurring revenue streams beyond product sales. Several Turf Protection Market participants are piloting subscription models priced at USD 1,200–3,000 per facility per year, bundling diagnostic analytics with recommended treatment protocols. These platforms also generate proprietary agronomic datasets with significant data-monetization potential.

Emerging-Market Golf and Urban Greening in Asia-Pacific

China added over 180 new urban parks in tier-two and tier-three cities between 2022 and 2024, while India's golf course inventory grew by 15% during the same period [10]. The Turf Protection Market in Asia-Pacific remains under-penetrated relative to North America and Europe, presenting a greenfield opportunity for manufacturers willing to localize formulations and distribution networks.

Residential Lawn-Care Services Consolidation

The U.S. professional lawn-care services industry generates over USD 40 billion annually and is consolidating rapidly through private-equity roll-ups [9]. As national service chains replace independent operators, centralized procurement drives volume contracts for turf protection chemistries. This consolidation creates a platform for manufacturers within the Turf Protection Market to secure multi-year supply agreements with guaranteed volume floors.

Climate-Adaptive Formulation Development

Warming temperatures are shifting disease-pressure maps northward, creating demand for fungicide and herbicide products reformulated for transitional turf zones [7]. The Turf Protection Market opportunity here lies in developing flexible-spectrum formulations effective across both cool-season and warm-season grasses, a niche currently underserved by existing product portfolios.


Turf Protection Market Future Outlook

AI-Powered Predictive Turf Management

Machine-learning disease-prediction models trained on multispectral drone imagery and microclimate sensor arrays are expected to become standard practice on professional turf by 2030. These platforms reduce prophylactic chemical applications by 30–50% while improving treatment timing accuracy [8]. The Turf Protection Market will increasingly reward manufacturers that integrate digital decision-support tools with their chemistry portfolios, blurring the line between product and service companies.

Biological Active-Ingredient Revolution

Fermentation-derived microbial fungicides and bioherbicides are projected to constitute over 20% of total turf protection sales by 2032, up from roughly 14% in 2025 [3]. Scale-up of commercial fermentation capacity in the U.S., Denmark, and India will compress production costs, narrowing the current price premium over synthetic alternatives and accelerating adoption across the Turf Protection Market's price-sensitive municipal and residential segments.

Climate Adaptation and Turf-Zone Migration

Rising mean temperatures are pushing the cool-season/warm-season transition zone roughly 100 miles northward per decade in North America, according to USDA climate-modeling projections [7]. This geographic shift reshapes product demand profiles within the Turf Protection Market, increasing fungicide intensity in newly humid regions and altering herbicide spectrums as warm-season weed species colonize previously temperate zones.

ESG-Driven Procurement and Sustainability Reporting

Corporate and municipal sustainability reporting frameworks — including GRI, CDP, and SASB — increasingly require disclosure of chemical input volumes for managed landscapes. The Turf Protection Market stands to benefit as organizations shift procurement toward lower-risk, certified-sustainable products that improve their ESG scores. Green procurement policies covering turf chemicals already apply to over 60% of U.S. federal facility maintenance contracts [14].


Turf Protection Market Segmentation

By Product Type

Segment Share of Turf Protection Market (2025) Primary Demand Driver
Herbicides 36% Weed-resistance management in warm-season turf
Fungicides 31% Climate-driven disease-cycle intensification
Insecticides 18% Grub and surface-feeder pressure
Others (PGRs, adjuvants) 15% Turf quality optimization


Herbicides anchor the Turf Protection Market's product-type segmentation, commanding over a third of total revenue. Pre-emergent and post-emergent weed management remains the single largest line item in professional turf care budgets, driven by the spread of herbicide-resistant crabgrass and goosegrass populations across southern U.S. states. Selective herbicide formulations tailored for warm-season bermudagrass and zoysiagrass fairways are seeing particularly strong demand growth.

Fungicides represent the fastest-growing product category within the Turf Protection Market. Dollar spot, brown patch, and anthracnose — the three costliest turfgrass diseases — are occurring earlier in the season and persisting longer as average temperatures and humidity levels rise [7]. This extended disease window expands the number of application rounds per year, driving both volume and value growth for systemic and contact fungicide products.

By Application

Segment CAGR (2026–2035) Primary Demand Driver
Landscaping 6.8% Residential and commercial property maintenance
Golf Courses 7.5% Premium playing-surface standards
Sports Fields 8.2% Stadium construction and broadcast-quality requirements
Others (cemeteries, public gardens) 6.3% Municipal budget allocations


Landscaping dominates application-level revenues within the Turf Protection Market, reflecting the sheer acreage of residential and commercial turf under professional management. Sports fields, however, record the highest growth rate as global stadium investment cycles — driven by FIFA, UEFA, AFC, and Olympic host-city requirements — intensify demand for year-round, high-frequency treatment programs.

By End-User

Segment Revenue (2025, USD B) Primary Demand Driver
Commercial / Institutional 4.35 Property management, hospitality, public facilities
Residential Customers 3.10 DIY and professional lawn-care services
Government / Municipal 1.83 Public parks, school grounds, highway medians


Commercial and institutional end-users lead the Turf Protection Market in absolute spending, driven by contractual maintenance standards that require regular chemical treatment schedules. Residential customers represent the second-largest end-user group, split between do-it-yourself homeowners purchasing retail-packaged products and subscribers to professional lawn-care service programs.

By Mode of Action

Segment Share of Turf Protection Market (2025) Primary Demand Driver
Chemical 62% Established efficacy, broad-spectrum control
Biological 14% Regulatory incentives, sustainability mandates
Integrated Solution 24% Cost optimization, resistance management


Chemical mode-of-action products still dominate the Turf Protection Market, though their share is declining as biological and integrated approaches gain traction under regulatory pressure and end-user preference shifts.

By Formulation

Segment CAGR (2026–2035) Primary Demand Driver
Granular 6.5% Ease of application, controlled release
Liquid Concentrate 7.8% Precision spray compatibility
Water-Dispersible Granule 7.4% Reduced dust, mixing convenience
Others 6.1% Specialty and seed-treatment applications


Liquid concentrate formulations are outpacing granular products in growth within the Turf Protection Market, primarily because they integrate more readily with GPS-guided and drone-mounted precision sprayer systems that require pumpable solutions [8].


Regional Market Share Analysis

Region Share of Global Revenue (2025) Primary Investment Themes
North America 38% Professional sports, municipal parks, residential services
Europe 27% EU SUR compliance, biologicals adoption, UEFA infrastructure
Asia-Pacific 22% Urban greening, golf tourism, stadium construction
South America 8% Agricultural diversification, resort development
Middle East & Africa 5% Hospitality landscaping, water-efficient turf solutions
Total 100%

The Turf Protection Market spans five major regions, each with distinct regulatory environments, turf species profiles, and end-user structures.


North America

Country CAGR (2026–2035) Key Driver
United States 6.9% Professional sports venues and residential services
Canada 7.1% National Urban Parks Program expansion
Mexico 7.8% Resort and hospitality sector growth


North America's dominance in the Turf Protection Market stems from an unmatched density of managed turf acreage: the U.S. alone maintains an estimated 40 million acres of managed turfgrass, more than any other nation [1]. Spending per acre on turf protection inputs remains the highest globally, driven by stringent aesthetic standards across homeowner associations, commercial properties, and professional sports leagues. Canada's expanding municipal green-space commitments and Mexico's growing resort economy contribute incremental growth to the region.

Europe

Country Share of European Turf Protection Market (2025) Key Driver
Germany 19% Bundesliga and municipal park systems
United Kingdom 22% Premier League venue standards
France 16% Ligue 1 and public-space mandates
Italy 12% Serie A stadium upgrades
Spain 10% La Liga facilities and tourism landscaping
Nordic Countries 8% Climate-adaptive turf management
Russia 5% Domestic league and urban renewal
Rest of Europe 8% Mixed drivers


The European Turf Protection Market is shaped by an evolving regulatory landscape that simultaneously restricts conventional chemistries and incentivizes biological alternatives. The UK, operating outside EU regulatory frameworks post-Brexit, retains a broader approved-substance list, giving British turf managers more product flexibility. Germany and France lead in integrated pest management adoption rates, reflecting national action plans aligned with the EU Green Deal [2].

Asia-Pacific

Country Projected Revenue (2035, USD B) Key Driver
China 1.52 Urban park construction, 2030 green-city initiatives
India 0.78 Golf course and cricket ground expansion
Japan 0.65 J-League stadiums, aging park infrastructure renewal
South Korea 0.42 K-League venues and urban regeneration
ASEAN 0.38 Resort landscaping and FIFA standardization
Rest of Asia-Pacific 0.37 Mixed urbanization drivers


Asia-Pacific represents the most dynamic growth frontier for the Turf Protection Market. China's "Beautiful China 2035" initiative allocates substantial municipal budgets toward urban greening, while India's expanding middle class fuels demand for professionally maintained residential communities and recreational facilities [10]. Japan's aging public park infrastructure requires intensified disease and weed management as deferred maintenance accelerates turf degradation.

South America

Country Share of South American Turf Protection Market (2025) Key Driver
Brazil 54% Copa Libertadores venues, urban parks
Argentina 26% Liga Profesional stadium upgrades
Rest of South America 20% Resort and municipal landscaping


Brazil's dominance in the South American Turf Protection Market reflects both the country's massive professional football infrastructure and its tropical climate, which creates year-round disease and weed pressure demanding continuous treatment programs. Argentina's professional league investments and Chile's expanding vineyard-adjacent landscaping add supplementary demand.

Middle East & Africa

Country CAGR (2026–2035) Key Driver
Saudi Arabia 9.2% NEOM, Vision 2030 sports city projects
UAE 8.8% Hospitality and golf resort maintenance
South Africa 6.4% Municipal and rugby venue turf programs
Egypt 7.1% New Administrative Capital green spaces
Rest of MEA 6.0% Mixed urban development


The Middle East & Africa region, while the smallest contributor to the Turf Protection Market, posts some of the highest growth rates globally. Saudi Arabia's Vision 2030 sports-city investments and the UAE's luxury resort ecosystem demand premium turf maintenance in extreme arid conditions, favoring high-value slow-release formulations and water-efficient application technologies.


Turf Protection Market By Region, 2025-2035

Competitive Benchmarking

The Turf Protection Market exhibits medium concentration, with an estimated top-five combined revenue share of 42–48% and a Herfindahl-Hirschman Index in the 900–1,100 range. The competitive field blends global agrochemical conglomerates with specialized turf-focused formulators, creating a layered market where scale advantages in active-ingredient manufacturing coexist with niche expertise in application-specific blends.

Company Est. Revenue Share Range Key Offerings for Turf Protection Market Strategic Positioning
Syngenta Group 10–14% Broad fungicide and herbicide portfolio, Acelepryn insecticide Global scale, R&D depth in systemic chemistries
BASF SE 8–12% Lexicon, Insignia fungicides; selective herbicides Innovation pipeline in SDHI fungicides
Bayer AG / Envu 7–11% Exteris Stressgard, Specticle herbicide Turf-dedicated business unit (Envu spin-off)
Corteva Agriscience 6–9% Arylex-based herbicides, biological portfolio Integration of legacy Dow and DuPont turf lines
FMC Corporation 5–8% Fame fungicide, Solitare herbicide Specialty chemistry focus
Nufarm Limited 4–7% Generic herbicide and fungicide formulations Cost-competitive positioning in mature markets
PBI-Gordon Corporation 3–5% SpeedZone herbicide, Segway fungicide U.S. professional turf specialization
AMVAC Chemical Corporation 2–4% Granular insecticides, niche herbicides Distribution strength in North America
Quali-Pro (Control Solutions) 2–4% Value-tier fungicide and herbicide generics Price-leadership in professional channel
Atticus LLC 1–3% Post-patent active-ingredient formulations Challenger brand in North American distribution


Recent News & Developments

  • Syngenta Group (March 2025): Launched Ascernity fungicide combining two novel SDHI active ingredients for dollar-spot and brown-patch control on golf course turf, targeting the North American professional channel [16].


  • BASF SE (October 2024): Received EPA registration for a next-generation SDHI fungicide with extended residual activity, expanding its Turf Protection Market portfolio for sports-field applications [18].


  • European Commission (June 2024): Published implementing guidance for the Sustainable Use Regulation's turf-specific provisions, clarifying integrated pest management requirements for public green spaces across EU member states [2].
  • FMC Corporation (April 2024): Announced a strategic partnership with a U.S. precision-agriculture technology firm to co-develop drone-compatible liquid formulations optimized for variable-rate turf application [20].
  • PBI-Gordon Corporation (November 2023): Expanded its manufacturing facility in Kansas City, adding 40% granular herbicide production capacity to serve growing municipal and residential demand [21].
  • Nufarm Limited (August 2023): Entered a distribution agreement covering six Southeast Asian countries, positioning its value-tier turf fungicide range for the region's expanding golf and resort sectors [22].


Turf Protection Market Report Scope

Parameter Detail
Market Scope Global Turf Protection Market encompassing fungicides, herbicides, insecticides, PGRs, and adjuvants across all application segments and end-users
Study Period 2021–2035
CAGR 7.30% (2026–2035)
Market Size — 2025 (Base Year) USD 9.28 Billion
Market Size — 2035 (Forecast End) USD 18.75 Billion
Fastest Growing Segment Fungicides (by product type); Sports Fields (by application); Asia-Pacific (by region)
Companies Profiled 10 (Syngenta, BASF, Envu/Bayer, Corteva, FMC, Nufarm, PBI-Gordon, AMVAC, Quali-Pro, Atticus)
Valuation Currency USD (constant 2025 dollars)


FAQs

How do turf protection purchasing patterns differ between municipal and commercial buyers?
Municipal buyers typically procure through annual bid cycles with lowest-cost mandates, while commercial property managers favor multi-year service contracts bundling products with application labor [4]. This structural difference creates distinct pricing and channel strategies for manufacturers.
What resistance-management protocols should buyers require from suppliers?
Buyers should demand documented mode-of-action rotation schedules and resistance-monitoring data from suppliers [7]. Contracts that specify alternating FRAC/HRAC group applications reduce long-term efficacy loss and total cost of ownership.
How does turf species selection influence protection product compatibility?
Warm-season species like bermudagrass tolerate broader herbicide chemistries than cool-season fescues, which are sensitive to certain post-emergent actives [11]. Buyers should match product labels to installed turf species before committing to supply agreements.
What insurance or liability considerations apply to professional turf chemical application?
Applicators in most U.S. states must carry specific pollution liability coverage, and product-damage claims against suppliers have risen 18% since 2021 [9]. Buyers should verify applicator licensing and supplier indemnification clauses.
How do water-quality regulations affect turf protection product selection near waterways?
Buffer-zone requirements under the U.S. Clean Water Act and EU Water Framework Directive restrict certain active ingredients within 15–50 meters of surface water [13]. Buyers near sensitive waterways should prioritize low-leaching granular or biological formulations.
What shelf-life and storage considerations affect turf protection inventory management?
Most liquid concentrate formulations maintain labeled efficacy for 2–3 years under controlled storage, while biological products typically require cold-chain handling and expire within 12–18 months [3]. Inventory planning must account for these differences.
How are carbon-credit programs beginning to intersect with turf management practices?
Reduced-input turf programs that lower synthetic chemical application rates are generating pilot carbon-offset credits in California and the UK [14]. Early adopters can monetize verified emission reductions while meeting sustainability procurement targets.    
Author
Author
Author Profile
Snehal Singh LinkedIn
Manager - Research
High acumen in analyzing complex macro & micro markets with more than 6 years of work experience in the field of market research. By implementing her analytical skills in forecasting and estimation into market research reports, she has expertise in Packaging, Construction, and Equipment domains. She handles a team size of 20-25 resources and ensures smooth running of the projects, associated marketing activities, and client servicing.
Share::
Request Free Sample

Research Approach


Secondary Research

The secondary research process involved comprehensive analysis of agrochemical regulatory databases, peer-reviewed agronomy journals, turfgrass science publications, and authoritative environmental agencies. Key sources included the US Environmental Protection Agency (EPA) Pesticide Registration Database, European Food Safety Authority (EFSA) Plant Health Reports, Food and Agriculture Organization (FAO) FAOSTAT Database on Pesticide Use, US Department of Agriculture (USDA) National Agricultural Statistics Service (NASS), Environment and Climate Change Canada (ECCC), Australian Pesticides and Veterinary Medicines Authority (APVMA), Health Canada Pest Management Regulatory Agency (PMRA), and national environmental protection agencies from key markets. Industry-specific sources covered the Golf Course Superintendents Association of America (GCSAA) Industry Data, Sports Turf Managers Association (STMA) Facility Benchmarking Reports, National Association of Landscape Professionals (NALP) Market Outlook, British & International Golf Greenkeepers Association (BIGGA) Turf Survey, and Asian Golf Federation (AGF) Development Reports. Academic sources included the International Turfgrass Society Research Journal, Journal of Turfgrass Management, Weed Science Society publications, and university extension research from Penn State, Ohio State, University of Florida, and UC Davis. These sources were used to collect turf area statistics, pesticide registration data, application frequency trends, sports facility construction data, golf course maintenance expenditure, and regulatory shift analysis for synthetic and biological turf protection chemistries.


Primary Research

During the primary research process, both supply-side and demand-side stakeholders were interviewed to gather qualitative and quantitative insights. Supply-side sources were CEOs, VPs of Agricultural Solutions, regulatory affairs managers, and commercial directors from companies that make agrochemicals, formulate them, and make turf-specific products. Demand-side sources included golf course superintendents, sports turf managers, groundskeepers from professional stadiums and municipalities, landscaping contractors, and procurement leads from golf resorts, sports complexes, residential estate management companies, and commercial landscaping services. Primary research confirmed assumptions about application rates, confirmed registrations for product pipelines, and gathered information on how integrated pest management is being used, when to spray in different seasons, how long it takes to switch from organic to biological products, and how flexible prices are between premium branded formulations and generic alternatives.

Primary Respondent Breakdown:

By Designation: C-level Primaries (32%), Director Level (35%), Others (33%)

By Region: North America (32%), Europe (30%), Asia-Pacific (28%), Rest of World (10%)


Market Size Estimation

Global market valuation was derived through revenue mapping and treated area analysis. The methodology included:

Identification of 50+ key manufacturers across North America, Europe, Asia-Pacific, and Latin America

Product mapping across herbicides (selective/non-selective), fungicides (systemic/contact), insecticides (organophosphates, pyrethroids, biologicals), and plant growth regulators (PGRs) specific to turf applications

Analysis of reported and modeled annual revenues specific to turf protection portfolios, excluding agricultural crop applications

Coverage of manufacturers representing 75-80% of global market share in 2024

Extrapolation using bottom-up (total maintained turf acreage × average treatment frequency × application rate × ASP by region) and top-down (manufacturer revenue validation adjusted for turf-specific product mixes) approaches to derive segment-specific valuations across residential lawns, commercial landscapes, sports fields, and golf_course maintenance verticals

Share::
Request Free Sample
Download Free Sample

Kindly complete the form below to receive a free sample of this Report

Share::
Request Free Sample
Download PDF ×

We do not share your information with anyone. However, we may send you emails based on your report interest from time to time. You may contact us at any time to opt-out.
















