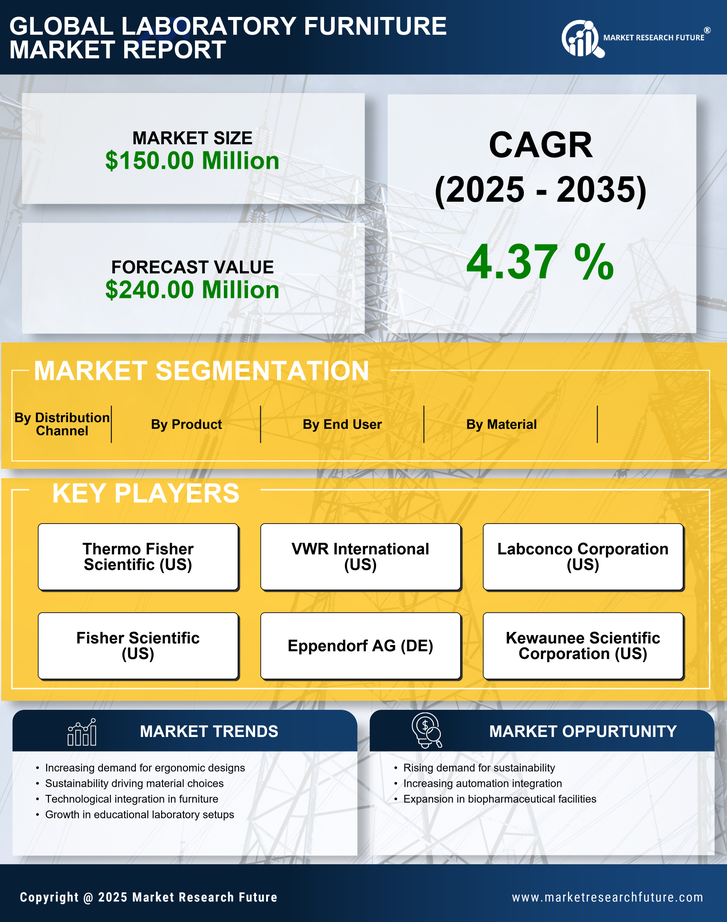
Request Free Sample ×

Kindly complete the form below to receive a free sample of this Report

* Please use a valid business email

Leading companies partner with us for data-driven Insights

clients tt-cursor
Hero Background

UK Laboratory Furniture Market

ID: MRFR/HC/48568-HCR
200 Pages
Nidhi Mandole
Last Updated: April 06, 2026
UK Laboratory Furniture Market Research Report By Product (Laboratory Tables, Laboratory Stools & Benches, Laboratory Desk & Storage Cabinets, Pedestal Laboratory Furniture, Laboratory IPS Units, Biological Safety Cabinets, Fume Hoods, Others), By Material (Plastic, Metal, Stainless Steel, Wood, Others) and By End User (School & Colleges Laboratory, Medical Laboratory) - Growth & Industry Forecast 2025 To 2035
Download PDF ×

We do not share your information with anyone. However, we may send you emails based on your report interest from time to time. You may contact us at any time to opt-out.

  1. 1 SECTION I: EXECUTIVE SUMMARY AND KEY HIGHLIGHTS
    1. 1.1 EXECUTIVE SUMMARY
      1. 1.1.1 Market Overview
      2. 1.1.2 Key Findings
      3. 1.1.3 Market Segmentation
      4. 1.1.4 Competitive Landscape
      5. 1.1.5 Challenges and Opportunities
      6. 1.1.6 Future Outlook
  2. 2 SECTION II: SCOPING, METHODOLOGY AND MARKET STRUCTURE
    1. 2.1 MARKET INTRODUCTION
      1. 2.1.1 Definition
      2. 2.1.2 Scope of the study
        1. 2.1.2.1 Research Objective
        2. 2.1.2.2 Assumption
        3. 2.1.2.3 Limitations
    2. 2.2 RESEARCH METHODOLOGY
      1. 2.2.1 Overview
      2. 2.2.2 Data Mining
      3. 2.2.3 Secondary Research
      4. 2.2.4 Primary Research
        1. 2.2.4.1 Primary Interviews and Information Gathering Process
        2. 2.2.4.2 Breakdown of Primary Respondents
      5. 2.2.5 Forecasting Model
      6. 2.2.6 Market Size Estimation
        1. 2.2.6.1 Bottom-Up Approach
        2. 2.2.6.2 Top-Down Approach
      7. 2.2.7 Data Triangulation
      8. 2.2.8 Validation
  3. 3 SECTION III: QUALITATIVE ANALYSIS
    1. 3.1 MARKET DYNAMICS
      1. 3.1.1 Overview
      2. 3.1.2 Drivers
      3. 3.1.3 Restraints
      4. 3.1.4 Opportunities
    2. 3.2 MARKET FACTOR ANALYSIS
      1. 3.2.1 Value chain Analysis
      2. 3.2.2 Porter's Five Forces Analysis
        1. 3.2.2.1 Bargaining Power of Suppliers
        2. 3.2.2.2 Bargaining Power of Buyers
        3. 3.2.2.3 Threat of New Entrants
        4. 3.2.2.4 Threat of Substitutes
        5. 3.2.2.5 Intensity of Rivalry
      3. 3.2.3 COVID-19 Impact Analysis
        1. 3.2.3.1 Market Impact Analysis
        2. 3.2.3.2 Regional Impact
        3. 3.2.3.3 Opportunity and Threat Analysis
  4. 4 SECTION IV: QUANTITATIVE ANALYSIS
    1. 4.1 Pharmaceutical, BY Product (USD Million)
      1. 4.1.1 Laboratory Tables
      2. 4.1.2 Laboratory Stools & Benches
      3. 4.1.3 Laboratory Desk & Storage Cabinets
      4. 4.1.4 Pedestal Laboratory Furniture
      5. 4.1.5 Laboratory IPS Units
      6. 4.1.6 Biological Safety Cabinets
      7. 4.1.7 Fume Hoods
      8. 4.1.8 Others
    2. 4.2 Pharmaceutical, BY Material (USD Million)
      1. 4.2.1 Plastic
      2. 4.2.2 Metal
      3. 4.2.3 Stainless Steel
      4. 4.2.4 Wood
      5. 4.2.5 Others
    3. 4.3 Pharmaceutical, BY End User (USD Million)
      1. 4.3.1 School & Colleges Laboratory
      2. 4.3.2 Medical Laboratory
    4. 4.4 Pharmaceutical, BY Distribution Channel (USD Million)
      1. 4.4.1 Offline Channels
      2. 4.4.2 Online Channels
  5. 5 SECTION V: COMPETITIVE ANALYSIS
    1. 5.1 Competitive Landscape
      1. 5.1.1 Overview
      2. 5.1.2 Competitive Analysis
      3. 5.1.3 Market share Analysis
      4. 5.1.4 Major Growth Strategy in the Pharmaceutical
      5. 5.1.5 Competitive Benchmarking
      6. 5.1.6 Leading Players in Terms of Number of Developments in the Pharmaceutical
      7. 5.1.7 Key developments and growth strategies
        1. 5.1.7.1 New Product Launch/Service Deployment
        2. 5.1.7.2 Merger & Acquisitions
        3. 5.1.7.3 Joint Ventures
      8. 5.1.8 Major Players Financial Matrix
        1. 5.1.8.1 Sales and Operating Income
        2. 5.1.8.2 Major Players R&D Expenditure. 2023
    2. 5.2 Company Profiles
      1. 5.2.1 Thermo Fisher Scientific (US)
        1. 5.2.1.1 Financial Overview
        2. 5.2.1.2 Products Offered
        3. 5.2.1.3 Key Developments
        4. 5.2.1.4 SWOT Analysis
        5. 5.2.1.5 Key Strategies
      2. 5.2.2 VWR International (US)
        1. 5.2.2.1 Financial Overview
        2. 5.2.2.2 Products Offered
        3. 5.2.2.3 Key Developments
        4. 5.2.2.4 SWOT Analysis
        5. 5.2.2.5 Key Strategies
      3. 5.2.3 Labconco Corporation (US)
        1. 5.2.3.1 Financial Overview
        2. 5.2.3.2 Products Offered
        3. 5.2.3.3 Key Developments
        4. 5.2.3.4 SWOT Analysis
        5. 5.2.3.5 Key Strategies
      4. 5.2.4 Fisher Scientific (US)
        1. 5.2.4.1 Financial Overview
        2. 5.2.4.2 Products Offered
        3. 5.2.4.3 Key Developments
        4. 5.2.4.4 SWOT Analysis
        5. 5.2.4.5 Key Strategies
      5. 5.2.5 Eppendorf AG (DE)
        1. 5.2.5.1 Financial Overview
        2. 5.2.5.2 Products Offered
        3. 5.2.5.3 Key Developments
        4. 5.2.5.4 SWOT Analysis
        5. 5.2.5.5 Key Strategies
      6. 5.2.6 Kewaunee Scientific Corporation (US)
        1. 5.2.6.1 Financial Overview
        2. 5.2.6.2 Products Offered
        3. 5.2.6.3 Key Developments
        4. 5.2.6.4 SWOT Analysis
        5. 5.2.6.5 Key Strategies
      7. 5.2.7 Haworth Inc. (US)
        1. 5.2.7.1 Financial Overview
        2. 5.2.7.2 Products Offered
        3. 5.2.7.3 Key Developments
        4. 5.2.7.4 SWOT Analysis
        5. 5.2.7.5 Key Strategies
      8. 5.2.8 Asecos GmbH (DE)
        1. 5.2.8.1 Financial Overview
        2. 5.2.8.2 Products Offered
        3. 5.2.8.3 Key Developments
        4. 5.2.8.4 SWOT Analysis
        5. 5.2.8.5 Key Strategies
      9. 5.2.9 Biobase Biodustry (CN)
        1. 5.2.9.1 Financial Overview
        2. 5.2.9.2 Products Offered
        3. 5.2.9.3 Key Developments
        4. 5.2.9.4 SWOT Analysis
        5. 5.2.9.5 Key Strategies
    3. 5.3 Appendix
      1. 5.3.1 References
      2. 5.3.2 Related Reports
  6. 6 LIST OF FIGURES
    1. 6.1 MARKET SYNOPSIS
    2. 6.2 UK MARKET ANALYSIS BY PRODUCT
    3. 6.3 UK MARKET ANALYSIS BY MATERIAL
    4. 6.4 UK MARKET ANALYSIS BY END USER
    5. 6.5 UK MARKET ANALYSIS BY DISTRIBUTION CHANNEL
    6. 6.6 KEY BUYING CRITERIA OF PHARMACEUTICAL
    7. 6.7 RESEARCH PROCESS OF MRFR
    8. 6.8 DRO ANALYSIS OF PHARMACEUTICAL
    9. 6.9 DRIVERS IMPACT ANALYSIS: PHARMACEUTICAL
    10. 6.10 RESTRAINTS IMPACT ANALYSIS: PHARMACEUTICAL
    11. 6.11 SUPPLY / VALUE CHAIN: PHARMACEUTICAL
    12. 6.12 PHARMACEUTICAL, BY PRODUCT, 2024 (% SHARE)
    13. 6.13 PHARMACEUTICAL, BY PRODUCT, 2024 TO 2035 (USD Million)
    14. 6.14 PHARMACEUTICAL, BY MATERIAL, 2024 (% SHARE)
    15. 6.15 PHARMACEUTICAL, BY MATERIAL, 2024 TO 2035 (USD Million)
    16. 6.16 PHARMACEUTICAL, BY END USER, 2024 (% SHARE)
    17. 6.17 PHARMACEUTICAL, BY END USER, 2024 TO 2035 (USD Million)
    18. 6.18 PHARMACEUTICAL, BY DISTRIBUTION CHANNEL, 2024 (% SHARE)
    19. 6.19 PHARMACEUTICAL, BY DISTRIBUTION CHANNEL, 2024 TO 2035 (USD Million)
    20. 6.20 BENCHMARKING OF MAJOR COMPETITORS
  7. 7 LIST OF TABLES
    1. 7.1 LIST OF ASSUMPTIONS
  8. 7.1.1
    1. 7.2 UK MARKET SIZE ESTIMATES; FORECAST
      1. 7.2.1 BY PRODUCT, 2025-2035 (USD Million)
      2. 7.2.2 BY MATERIAL, 2025-2035 (USD Million)
      3. 7.2.3 BY END USER, 2025-2035 (USD Million)
      4. 7.2.4 BY DISTRIBUTION CHANNEL, 2025-2035 (USD Million)
    2. 7.3 PRODUCT LAUNCH/PRODUCT DEVELOPMENT/APPROVAL
  9. 7.3.1
    1. 7.4 ACQUISITION/PARTNERSHIP
  10. 7.4.1

UK Pharmaceutical Market Segmentation

Pharmaceutical By Product (USD Million, 2025-2035)

  • Laboratory Tables
  • Laboratory Stools & Benches
  • Laboratory Desk & Storage Cabinets
  • Pedestal Laboratory Furniture
  • Laboratory IPS Units
  • Biological Safety Cabinets
  • Fume Hoods
  • Others

Pharmaceutical By Material (USD Million, 2025-2035)

  • Plastic
  • Metal
  • Stainless Steel
  • Wood
  • Others

Pharmaceutical By End User (USD Million, 2025-2035)

  • School & Colleges Laboratory
  • Medical Laboratory

Pharmaceutical By Distribution Channel (USD Million, 2025-2035)

  • Offline Channels
  • Online Channels