UK Life Sciences Market Segmentation
Life Sciences By Type (USD Million, 2025-2035)
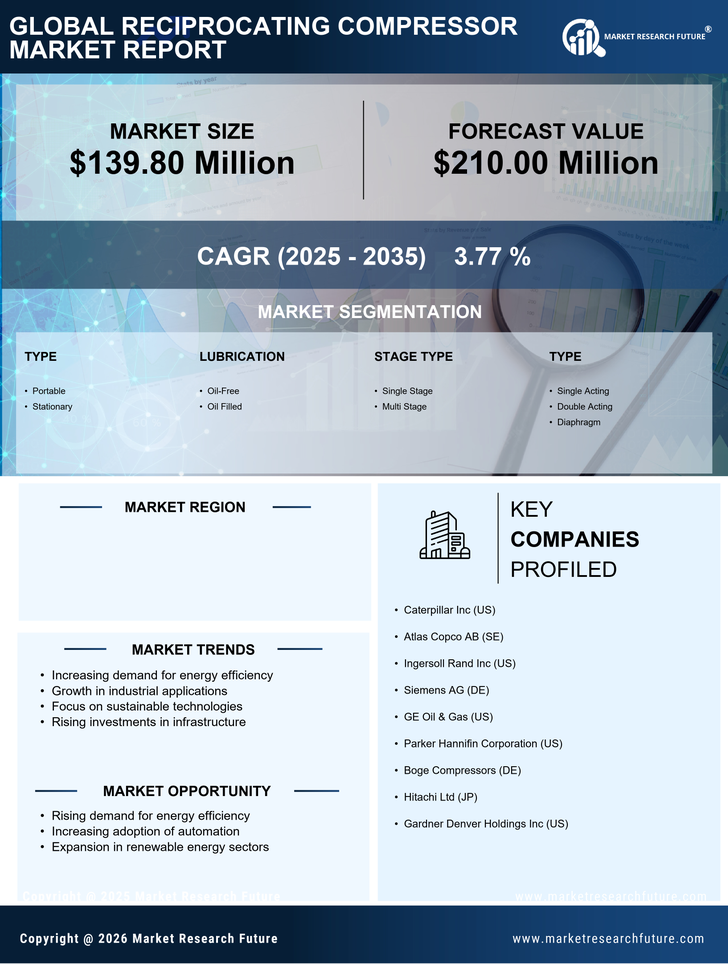
- Portable
- Stationary
Life Sciences By Lubrication (USD Million, 2025-2035)
- Oil-Free
- Oil Filled
Life Sciences By Stage Type (USD Million, 2025-2035)
- Single Stage
- Multi Stage
Life Sciences By Type (USD Million, 2025-2035)
- Single Acting
- Double Acting
- Diaphragm
Life Sciences By End User (USD Million, 2025-2035)
- Oil & Gas
- UK Reciprocating Compressor Market
- Chemical Plants
- Refrigeration Plants
- Manufacturing
- Automotive
- Others