Hero Background

UK Stevia Market

ID: MRFR/FnB/46779-HCR
128 Pages
Snehal Singh
Last Updated: April 06, 2026
UK Stevia Market Size, Share, Industry Trend & Analysis Research Report By Type (Liquid Extract, Powder Extract, Stevia Leaves), By Nature (Organic, Regular), By Application (Residential/Retail, Commercial, Dairy and Frozen Desserts, Bakery and Confectionery, Sweet and Savory Snacks, Tabletop Sweeteners, Packaged Food Products, Beverages, Dietary Supplements, Others) andBy Distribution Channel (Offline, Online)- Forecast to 2035
Download PDF ×

We do not share your information with anyone. However, we may send you emails based on your report interest from time to time. You may contact us at any time to opt-out.

  1. 1 SECTION I: EXECUTIVE SUMMARY AND KEY HIGHLIGHTS
    1. 1.1 EXECUTIVE SUMMARY
      1. 1.1.1 Market Overview
      2. 1.1.2 Key Findings
      3. 1.1.3 Market Segmentation
      4. 1.1.4 Competitive Landscape
      5. 1.1.5 Challenges and Opportunities
      6. 1.1.6 Future Outlook
  2. 2 SECTION II: SCOPING, METHODOLOGY AND MARKET STRUCTURE
    1. 2.1 MARKET INTRODUCTION
      1. 2.1.1 Definition
      2. 2.1.2 Scope of the study
        1. 2.1.2.1 Research Objective
        2. 2.1.2.2 Assumption
        3. 2.1.2.3 Limitations
    2. 2.2 RESEARCH METHODOLOGY
      1. 2.2.1 Overview
      2. 2.2.2 Data Mining
      3. 2.2.3 Secondary Research
      4. 2.2.4 Primary Research
        1. 2.2.4.1 Primary Interviews and Information Gathering Process
        2. 2.2.4.2 Breakdown of Primary Respondents
      5. 2.2.5 Forecasting Model
      6. 2.2.6 Market Size Estimation
        1. 2.2.6.1 Bottom-Up Approach
        2. 2.2.6.2 Top-Down Approach
      7. 2.2.7 Data Triangulation
      8. 2.2.8 Validation
  3. 3 SECTION III: QUALITATIVE ANALYSIS
    1. 3.1 MARKET DYNAMICS
      1. 3.1.1 Overview
      2. 3.1.2 Drivers
      3. 3.1.3 Restraints
      4. 3.1.4 Opportunities
    2. 3.2 MARKET FACTOR ANALYSIS
      1. 3.2.1 Value chain Analysis
      2. 3.2.2 Porter's Five Forces Analysis
        1. 3.2.2.1 Bargaining Power of Suppliers
        2. 3.2.2.2 Bargaining Power of Buyers
        3. 3.2.2.3 Threat of New Entrants
        4. 3.2.2.4 Threat of Substitutes
        5. 3.2.2.5 Intensity of Rivalry
      3. 3.2.3 COVID-19 Impact Analysis
        1. 3.2.3.1 Market Impact Analysis
        2. 3.2.3.2 Regional Impact
        3. 3.2.3.3 Opportunity and Threat Analysis
  4. 4 SECTION IV: QUANTITATIVE ANALYSIS
    1. 4.1 Food, Beverages & Nutrition, BY Application (USD Million)
      1. 4.1.1 Food and Beverages
      2. 4.1.2 Pharmaceuticals
      3. 4.1.3 Cosmetics
      4. 4.1.4 Nutraceuticals
      5. 4.1.5 Animal Feed
    2. 4.2 Food, Beverages & Nutrition, BY Form (USD Million)
      1. 4.2.1 Liquid
      2. 4.2.2 Powder
      3. 4.2.3 Granular
    3. 4.3 Food, Beverages & Nutrition, BY Nature (USD Million)
      1. 4.3.1 Organic
      2. 4.3.2 Conventional
    4. 4.4 Food, Beverages & Nutrition, BY Distribution Channel (USD Million)
      1. 4.4.1 Online
      2. 4.4.2 Offline
      3. 4.4.3 Modern Trade
      4. 4.4.4 Specialty Stores
  5. 5 SECTION V: COMPETITIVE ANALYSIS
    1. 5.1 Competitive Landscape
      1. 5.1.1 Overview
      2. 5.1.2 Competitive Analysis
      3. 5.1.3 Market share Analysis
      4. 5.1.4 Major Growth Strategy in the Food, Beverages & Nutrition
      5. 5.1.5 Competitive Benchmarking
      6. 5.1.6 Leading Players in Terms of Number of Developments in the Food, Beverages & Nutrition
      7. 5.1.7 Key developments and growth strategies
        1. 5.1.7.1 New Product Launch/Service Deployment
        2. 5.1.7.2 Merger & Acquisitions
        3. 5.1.7.3 Joint Ventures
      8. 5.1.8 Major Players Financial Matrix
        1. 5.1.8.1 Sales and Operating Income
        2. 5.1.8.2 Major Players R&D Expenditure. 2023
    2. 5.2 Company Profiles
      1. 5.2.1 Cargill (US)
        1. 5.2.1.1 Financial Overview
        2. 5.2.1.2 Products Offered
        3. 5.2.1.3 Key Developments
        4. 5.2.1.4 SWOT Analysis
        5. 5.2.1.5 Key Strategies
      2. 5.2.2 Nutraceutical Corporation (US)
        1. 5.2.2.1 Financial Overview
        2. 5.2.2.2 Products Offered
        3. 5.2.2.3 Key Developments
        4. 5.2.2.4 SWOT Analysis
        5. 5.2.2.5 Key Strategies
      3. 5.2.3 Pure Circle (MY)
        1. 5.2.3.1 Financial Overview
        2. 5.2.3.2 Products Offered
        3. 5.2.3.3 Key Developments
        4. 5.2.3.4 SWOT Analysis
        5. 5.2.3.5 Key Strategies
      4. 5.2.4 Stevia First Corporation (US)
        1. 5.2.4.1 Financial Overview
        2. 5.2.4.2 Products Offered
        3. 5.2.4.3 Key Developments
        4. 5.2.4.4 SWOT Analysis
        5. 5.2.4.5 Key Strategies
      5. 5.2.5 Tate & Lyle (GB)
        1. 5.2.5.1 Financial Overview
        2. 5.2.5.2 Products Offered
        3. 5.2.5.3 Key Developments
        4. 5.2.5.4 SWOT Analysis
        5. 5.2.5.5 Key Strategies
      6. 5.2.6 GLG Life Tech Corporation (CA)
        1. 5.2.6.1 Financial Overview
        2. 5.2.6.2 Products Offered
        3. 5.2.6.3 Key Developments
        4. 5.2.6.4 SWOT Analysis
        5. 5.2.6.5 Key Strategies
      7. 5.2.7 Sunwin Stevia International (CN)
        1. 5.2.7.1 Financial Overview
        2. 5.2.7.2 Products Offered
        3. 5.2.7.3 Key Developments
        4. 5.2.7.4 SWOT Analysis
        5. 5.2.7.5 Key Strategies
      8. 5.2.8 Herbochem (IN)
        1. 5.2.8.1 Financial Overview
        2. 5.2.8.2 Products Offered
        3. 5.2.8.3 Key Developments
        4. 5.2.8.4 SWOT Analysis
        5. 5.2.8.5 Key Strategies
    3. 5.3 Appendix
      1. 5.3.1 References
      2. 5.3.2 Related Reports
  6. 6 LIST OF FIGURES
    1. 6.1 MARKET SYNOPSIS
    2. 6.2 UK MARKET ANALYSIS BY APPLICATION
    3. 6.3 UK MARKET ANALYSIS BY FORM
    4. 6.4 UK MARKET ANALYSIS BY NATURE
    5. 6.5 UK MARKET ANALYSIS BY DISTRIBUTION CHANNEL
    6. 6.6 KEY BUYING CRITERIA OF FOOD, BEVERAGES & NUTRITION
    7. 6.7 RESEARCH PROCESS OF MRFR
    8. 6.8 DRO ANALYSIS OF FOOD, BEVERAGES & NUTRITION
    9. 6.9 DRIVERS IMPACT ANALYSIS: FOOD, BEVERAGES & NUTRITION
    10. 6.10 RESTRAINTS IMPACT ANALYSIS: FOOD, BEVERAGES & NUTRITION
    11. 6.11 SUPPLY / VALUE CHAIN: FOOD, BEVERAGES & NUTRITION
    12. 6.12 FOOD, BEVERAGES & NUTRITION, BY APPLICATION, 2024 (% SHARE)
    13. 6.13 FOOD, BEVERAGES & NUTRITION, BY APPLICATION, 2024 TO 2035 (USD Million)
    14. 6.14 FOOD, BEVERAGES & NUTRITION, BY FORM, 2024 (% SHARE)
    15. 6.15 FOOD, BEVERAGES & NUTRITION, BY FORM, 2024 TO 2035 (USD Million)
    16. 6.16 FOOD, BEVERAGES & NUTRITION, BY NATURE, 2024 (% SHARE)
    17. 6.17 FOOD, BEVERAGES & NUTRITION, BY NATURE, 2024 TO 2035 (USD Million)
    18. 6.18 FOOD, BEVERAGES & NUTRITION, BY DISTRIBUTION CHANNEL, 2024 (% SHARE)
    19. 6.19 FOOD, BEVERAGES & NUTRITION, BY DISTRIBUTION CHANNEL, 2024 TO 2035 (USD Million)
    20. 6.20 BENCHMARKING OF MAJOR COMPETITORS
  7. 7 LIST OF TABLES
    1. 7.1 LIST OF ASSUMPTIONS
  8. 7.1.1
    1. 7.2 UK MARKET SIZE ESTIMATES; FORECAST
      1. 7.2.1 BY APPLICATION, 2025-2035 (USD Million)
      2. 7.2.2 BY FORM, 2025-2035 (USD Million)
      3. 7.2.3 BY NATURE, 2025-2035 (USD Million)
      4. 7.2.4 BY DISTRIBUTION CHANNEL, 2025-2035 (USD Million)
    2. 7.3 PRODUCT LAUNCH/PRODUCT DEVELOPMENT/APPROVAL
  9. 7.3.1
    1. 7.4 ACQUISITION/PARTNERSHIP
  10. 7.4.1

UK Food, Beverages & Nutrition Market Segmentation

Food, Beverages & Nutrition By Application (USD Million, 2025-2035)
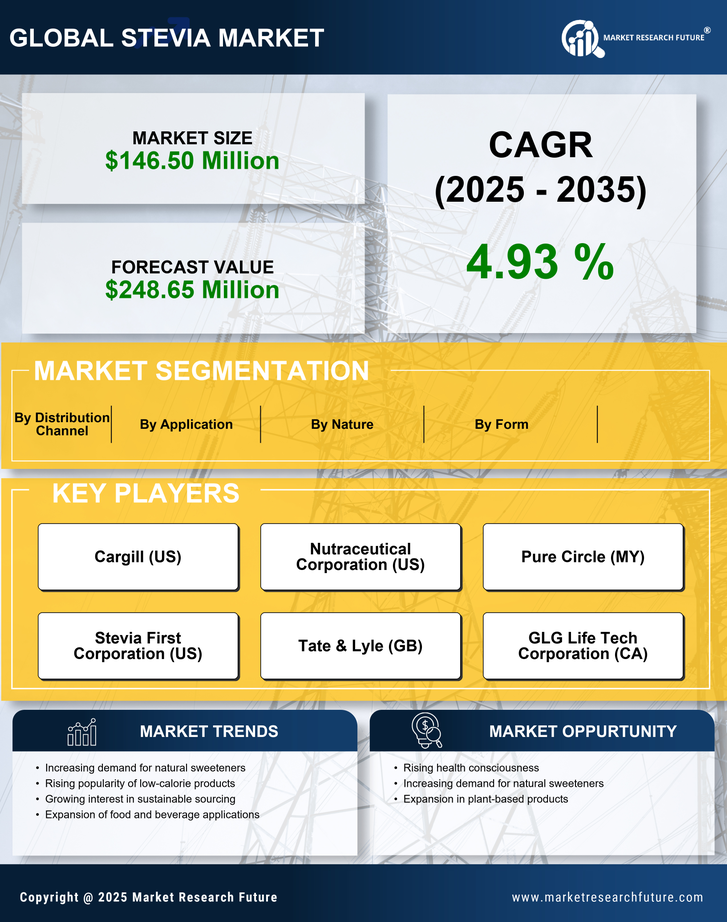
  • Food and Beverages
  • Pharmaceuticals
  • Cosmetics
  • Nutraceuticals
  • Animal Feed

Food, Beverages & Nutrition By Form (USD Million, 2025-2035)

  • Liquid
  • Powder
  • Granular

Food, Beverages & Nutrition By Nature (USD Million, 2025-2035)

  • Organic
  • Conventional

Food, Beverages & Nutrition By Distribution Channel (USD Million, 2025-2035)

  • Online
  • Offline
  • Modern Trade
  • Specialty Stores