US Automotive Brake Fluid Market Segmentation
US Automotive Brake Fluid Market By Fluid Type (USD Million, 2025-2035)
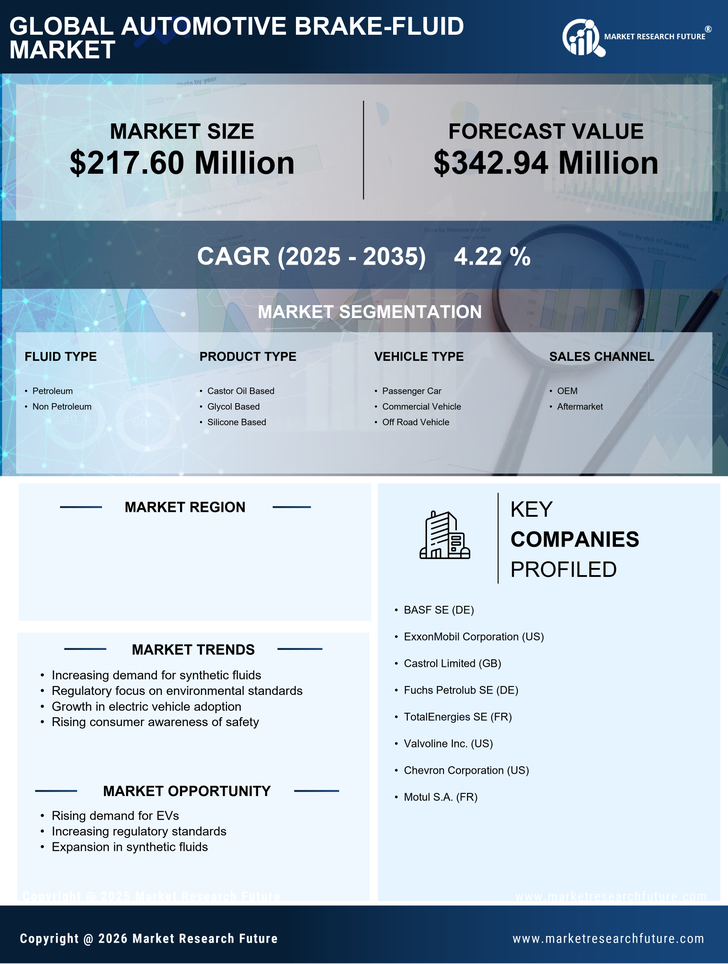
- Petroleum
- Non Petroleum
US Automotive Brake Fluid Market By Product Type (USD Million, 2025-2035)
- Castor Oil Based
- Glycol Based
- Silicone Based
US Automotive Brake Fluid Market By Vehicle Type (USD Million, 2025-2035)
- Passenger Car
- Commercial Vehicle
- Off Road Vehicle
US Automotive Brake Fluid Market By Sales Channel (USD Million, 2025-2035)
- OEM
- Aftermarket