US Ballistic Protection Market Segmentation
US Ballistic Protection Market By Type (USD Million, 2025-2035)
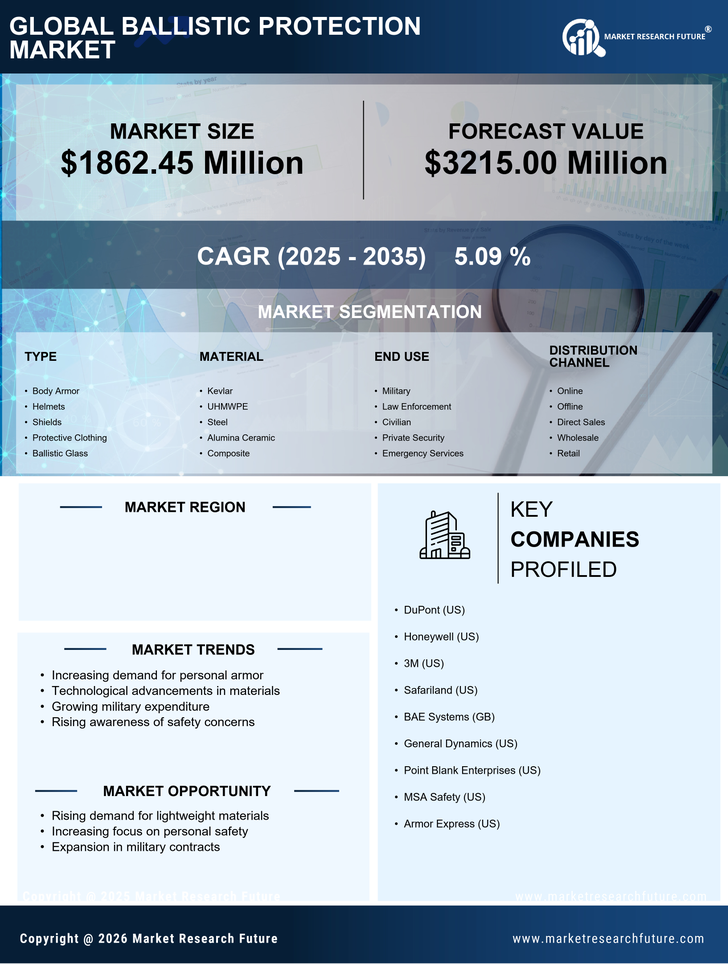
- Body Armor
- Helmets
- Shields
- Protective Clothing
- Ballistic Glass
US Ballistic Protection Market By Material (USD Million, 2025-2035)
- Kevlar
- UHMWPE
- Steel
- Alumina Ceramic
- Composite
US Ballistic Protection Market By End Use (USD Million, 2025-2035)
- Military
- Law Enforcement
- Civilian
- Private Security
- Emergency Services
US Ballistic Protection Market By Distribution Channel (USD Million, 2025-2035)
- Online
- Offline
- Direct Sales
- Wholesale
- Retail