US Chillers Market Segmentation
US Chillers Market By Type (USD Million, 2025-2035)
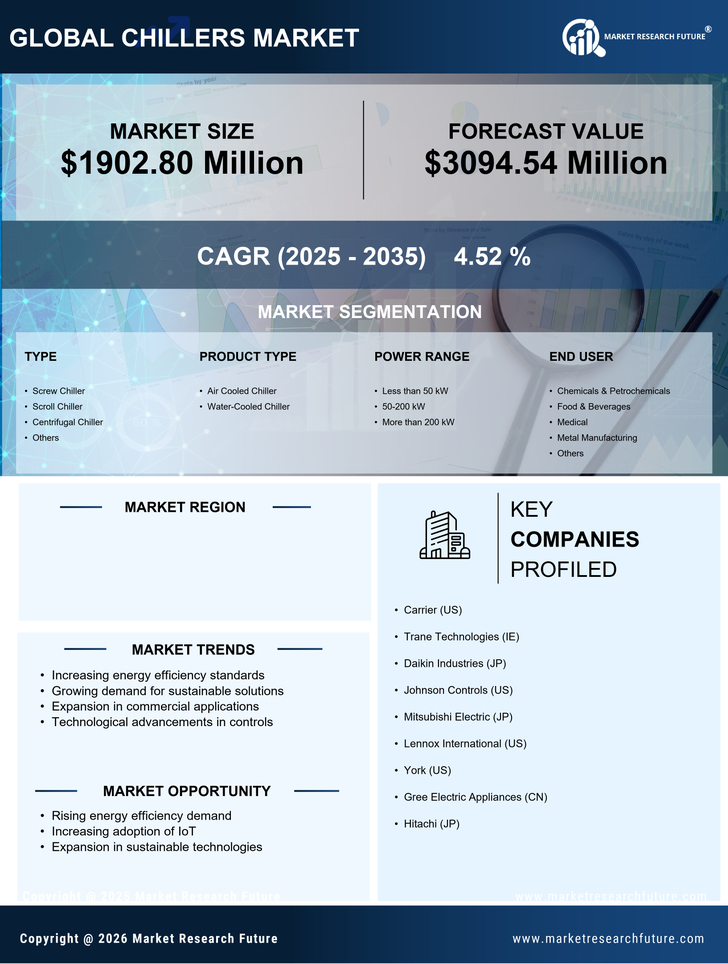
- Screw Chiller
- Scroll Chiller
- Centrifugal Chiller
- Others
US Chillers Market By Product Type (USD Million, 2025-2035)
- Air Cooled Chiller
- Water-Cooled Chiller
US Chillers Market By Power Range (USD Million, 2025-2035)
- Less than 50 kW
- 50-200 kW
- More than 200 kW
US Chillers Market By End User (USD Million, 2025-2035)
- Chemicals & Petrochemicals
- Food & Beverages
- Medical
- Metal Manufacturing
- Others
US Chillers Market By Sales (USD Million, 2025-2035)
- Rental Sales
- New Sales