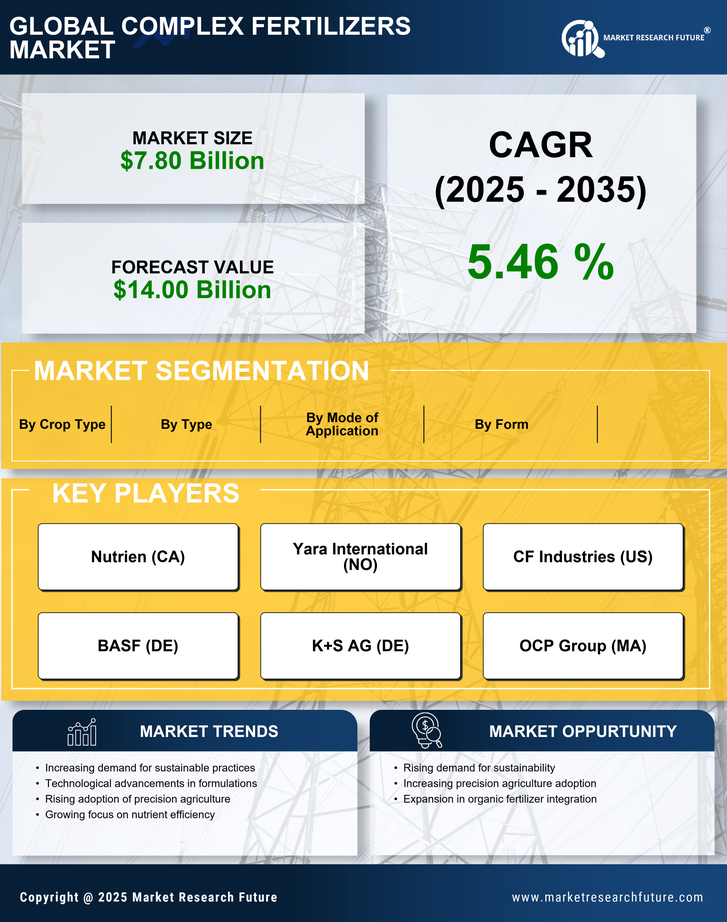
Request Free Sample ×

Kindly complete the form below to receive a free sample of this Report

* Please use a valid business email

Leading companies partner with us for data-driven Insights

clients tt-cursor
Hero Background

US Complex Fertilizers Market

ID: MRFR/Agri/19212-HCR
128 Pages
Snehal Singh
Last Updated: April 06, 2026
US Complex Fertilizers Market Size, Share, Industry Trend & Analysis Research Report: By Type (Complete Complex Fertilizers, Incomplete Complex Fertilizers), By Form (Granular, Liquid), By Mode of Application (Foliar, Fertigation) andBy Crop Type (Cereals, Oilseeds & Pulses, Fruits & Vegetables)- Forecast to 2035
Download PDF ×

We do not share your information with anyone. However, we may send you emails based on your report interest from time to time. You may contact us at any time to opt-out.

  1. 1 SECTION I: EXECUTIVE SUMMARY AND KEY HIGHLIGHTS
    1. 1.1 EXECUTIVE SUMMARY
      1. 1.1.1 Market Overview
      2. 1.1.2 Key Findings
      3. 1.1.3 Market Segmentation
      4. 1.1.4 Competitive Landscape
      5. 1.1.5 Challenges and Opportunities
      6. 1.1.6 Future Outlook
  2. 2 SECTION II: SCOPING, METHODOLOGY AND MARKET STRUCTURE
    1. 2.1 MARKET INTRODUCTION
      1. 2.1.1 Definition
      2. 2.1.2 Scope of the study
        1. 2.1.2.1 Research Objective
        2. 2.1.2.2 Assumption
        3. 2.1.2.3 Limitations
    2. 2.2 RESEARCH METHODOLOGY
      1. 2.2.1 Overview
      2. 2.2.2 Data Mining
      3. 2.2.3 Secondary Research
      4. 2.2.4 Primary Research
        1. 2.2.4.1 Primary Interviews and Information Gathering Process
        2. 2.2.4.2 Breakdown of Primary Respondents
      5. 2.2.5 Forecasting Model
      6. 2.2.6 Market Size Estimation
        1. 2.2.6.1 Bottom-Up Approach
        2. 2.2.6.2 Top-Down Approach
      7. 2.2.7 Data Triangulation
      8. 2.2.8 Validation
  3. 3 SECTION III: QUALITATIVE ANALYSIS
    1. 3.1 MARKET DYNAMICS
      1. 3.1.1 Overview
      2. 3.1.2 Drivers
      3. 3.1.3 Restraints
      4. 3.1.4 Opportunities
    2. 3.2 MARKET FACTOR ANALYSIS
      1. 3.2.1 Value chain Analysis
      2. 3.2.2 Porter's Five Forces Analysis
        1. 3.2.2.1 Bargaining Power of Suppliers
        2. 3.2.2.2 Bargaining Power of Buyers
        3. 3.2.2.3 Threat of New Entrants
        4. 3.2.2.4 Threat of Substitutes
        5. 3.2.2.5 Intensity of Rivalry
      3. 3.2.3 COVID-19 Impact Analysis
        1. 3.2.3.1 Market Impact Analysis
        2. 3.2.3.2 Regional Impact
        3. 3.2.3.3 Opportunity and Threat Analysis
  4. 4 SECTION IV: QUANTITATIVE ANALYSIS
    1. 4.1 Pharmaceutical, BY Type (USD Billion)
      1. 4.1.1 Complete Complex Fertilizers
      2. 4.1.2 Incomplete Complex Fertilizers
    2. 4.2 Pharmaceutical, BY Form (USD Billion)
      1. 4.2.1 Granular
      2. 4.2.2 Liquid
    3. 4.3 Pharmaceutical, BY Mode of Application (USD Billion)
      1. 4.3.1 Foliar
      2. 4.3.2 Fertigation
    4. 4.4 Pharmaceutical, BY Crop Type (USD Billion)
      1. 4.4.1 Cereals
      2. 4.4.2 Oilseeds & Pulses
      3. 4.4.3 Fruits & Vegetables
  5. 5 SECTION V: COMPETITIVE ANALYSIS
    1. 5.1 Competitive Landscape
      1. 5.1.1 Overview
      2. 5.1.2 Competitive Analysis
      3. 5.1.3 Market share Analysis
      4. 5.1.4 Major Growth Strategy in the Pharmaceutical
      5. 5.1.5 Competitive Benchmarking
      6. 5.1.6 Leading Players in Terms of Number of Developments in the Pharmaceutical
      7. 5.1.7 Key developments and growth strategies
        1. 5.1.7.1 New Product Launch/Service Deployment
        2. 5.1.7.2 Merger & Acquisitions
        3. 5.1.7.3 Joint Ventures
      8. 5.1.8 Major Players Financial Matrix
        1. 5.1.8.1 Sales and Operating Income
        2. 5.1.8.2 Major Players R&D Expenditure. 2023
    2. 5.2 Company Profiles
      1. 5.2.1 Nutrien (CA)
        1. 5.2.1.1 Financial Overview
        2. 5.2.1.2 Products Offered
        3. 5.2.1.3 Key Developments
        4. 5.2.1.4 SWOT Analysis
        5. 5.2.1.5 Key Strategies
      2. 5.2.2 Yara International (NO)
        1. 5.2.2.1 Financial Overview
        2. 5.2.2.2 Products Offered
        3. 5.2.2.3 Key Developments
        4. 5.2.2.4 SWOT Analysis
        5. 5.2.2.5 Key Strategies
      3. 5.2.3 CF Industries (US)
        1. 5.2.3.1 Financial Overview
        2. 5.2.3.2 Products Offered
        3. 5.2.3.3 Key Developments
        4. 5.2.3.4 SWOT Analysis
        5. 5.2.3.5 Key Strategies
      4. 5.2.4 BASF (DE)
        1. 5.2.4.1 Financial Overview
        2. 5.2.4.2 Products Offered
        3. 5.2.4.3 Key Developments
        4. 5.2.4.4 SWOT Analysis
        5. 5.2.4.5 Key Strategies
      5. 5.2.5 K+S AG (DE)
        1. 5.2.5.1 Financial Overview
        2. 5.2.5.2 Products Offered
        3. 5.2.5.3 Key Developments
        4. 5.2.5.4 SWOT Analysis
        5. 5.2.5.5 Key Strategies
      6. 5.2.6 OCP Group (MA)
        1. 5.2.6.1 Financial Overview
        2. 5.2.6.2 Products Offered
        3. 5.2.6.3 Key Developments
        4. 5.2.6.4 SWOT Analysis
        5. 5.2.6.5 Key Strategies
      7. 5.2.7 ICL Group (IL)
        1. 5.2.7.1 Financial Overview
        2. 5.2.7.2 Products Offered
        3. 5.2.7.3 Key Developments
        4. 5.2.7.4 SWOT Analysis
        5. 5.2.7.5 Key Strategies
      8. 5.2.8 Mosaic Company (US)
        1. 5.2.8.1 Financial Overview
        2. 5.2.8.2 Products Offered
        3. 5.2.8.3 Key Developments
        4. 5.2.8.4 SWOT Analysis
        5. 5.2.8.5 Key Strategies
      9. 5.2.9 EuroChem Group (RU)
        1. 5.2.9.1 Financial Overview
        2. 5.2.9.2 Products Offered
        3. 5.2.9.3 Key Developments
        4. 5.2.9.4 SWOT Analysis
        5. 5.2.9.5 Key Strategies
    3. 5.3 Appendix
      1. 5.3.1 References
      2. 5.3.2 Related Reports
  6. 6 LIST OF FIGURES
    1. 6.1 MARKET SYNOPSIS
    2. 6.2 US MARKET ANALYSIS BY TYPE
    3. 6.3 US MARKET ANALYSIS BY FORM
    4. 6.4 US MARKET ANALYSIS BY MODE OF APPLICATION
    5. 6.5 US MARKET ANALYSIS BY CROP TYPE
    6. 6.6 KEY BUYING CRITERIA OF PHARMACEUTICAL
    7. 6.7 RESEARCH PROCESS OF MRFR
    8. 6.8 DRO ANALYSIS OF PHARMACEUTICAL
    9. 6.9 DRIVERS IMPACT ANALYSIS: PHARMACEUTICAL
    10. 6.10 RESTRAINTS IMPACT ANALYSIS: PHARMACEUTICAL
    11. 6.11 SUPPLY / VALUE CHAIN: PHARMACEUTICAL
    12. 6.12 PHARMACEUTICAL, BY TYPE, 2024 (% SHARE)
    13. 6.13 PHARMACEUTICAL, BY TYPE, 2024 TO 2035 (USD Billion)
    14. 6.14 PHARMACEUTICAL, BY FORM, 2024 (% SHARE)
    15. 6.15 PHARMACEUTICAL, BY FORM, 2024 TO 2035 (USD Billion)
    16. 6.16 PHARMACEUTICAL, BY MODE OF APPLICATION, 2024 (% SHARE)
    17. 6.17 PHARMACEUTICAL, BY MODE OF APPLICATION, 2024 TO 2035 (USD Billion)
    18. 6.18 PHARMACEUTICAL, BY CROP TYPE, 2024 (% SHARE)
    19. 6.19 PHARMACEUTICAL, BY CROP TYPE, 2024 TO 2035 (USD Billion)
    20. 6.20 BENCHMARKING OF MAJOR COMPETITORS
  7. 7 LIST OF TABLES
    1. 7.1 LIST OF ASSUMPTIONS
  8. 7.1.1
    1. 7.2 US MARKET SIZE ESTIMATES; FORECAST
      1. 7.2.1 BY TYPE, 2025-2035 (USD Billion)
      2. 7.2.2 BY FORM, 2025-2035 (USD Billion)
      3. 7.2.3 BY MODE OF APPLICATION, 2025-2035 (USD Billion)
      4. 7.2.4 BY CROP TYPE, 2025-2035 (USD Billion)
    2. 7.3 PRODUCT LAUNCH/PRODUCT DEVELOPMENT/APPROVAL
  9. 7.3.1
    1. 7.4 ACQUISITION/PARTNERSHIP
  10. 7.4.1

US Pharmaceutical Market Segmentation

Pharmaceutical By Type (USD Billion, 2025-2035)

  • Complete Complex Fertilizers
  • Incomplete Complex Fertilizers

Pharmaceutical By Form (USD Billion, 2025-2035)

  • Granular
  • Liquid

Pharmaceutical By Mode of Application (USD Billion, 2025-2035)

  • Foliar
  • Fertigation

Pharmaceutical By Crop Type (USD Billion, 2025-2035)

  • Cereals
  • Oilseeds & Pulses
  • Fruits & Vegetables