US Connected Ship Market Segmentation
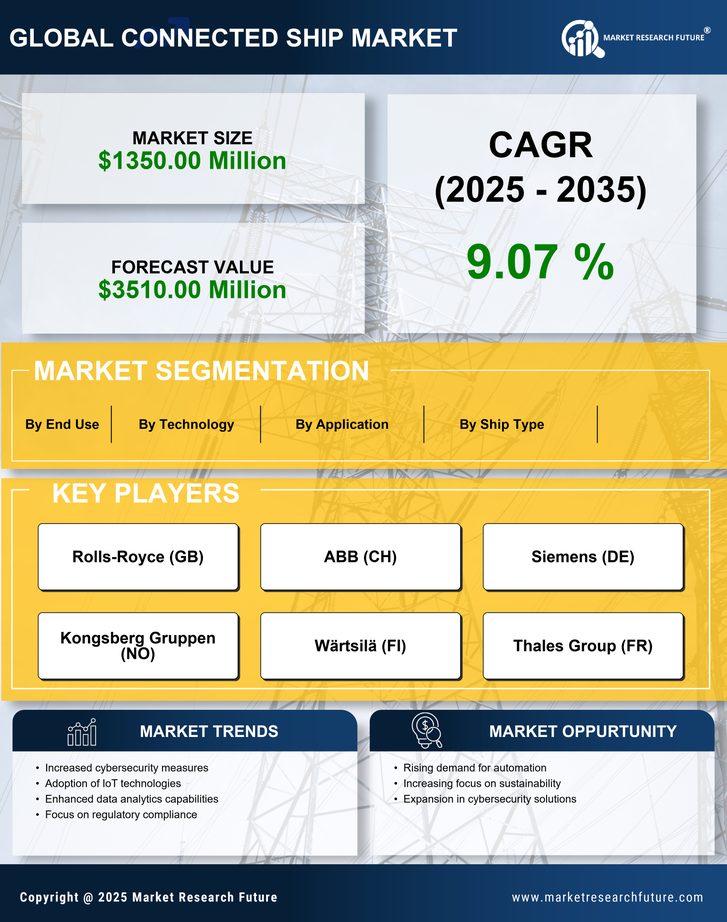
US Connected Ship Market By Technology (USD Million, 2025-2035)
- Internet of Things
- Cloud Computing
- Blockchain
- Artificial Intelligence
- Satellite Communication
US Connected Ship Market By Ship Type (USD Million, 2025-2035)
- Cargo Ships
- Passenger Ships
- Fishing Vessels
- Naval Ships
US Connected Ship Market By Application (USD Million, 2025-2035)
- Fleet Management
- Cargo Tracking
- Safety and Security
- Fuel Management
US Connected Ship Market By End Use (USD Million, 2025-2035)
- Commercial
- Government
- Research