US Construction Market Segmentation
Construction By Application (USD Million, 2025-2035)
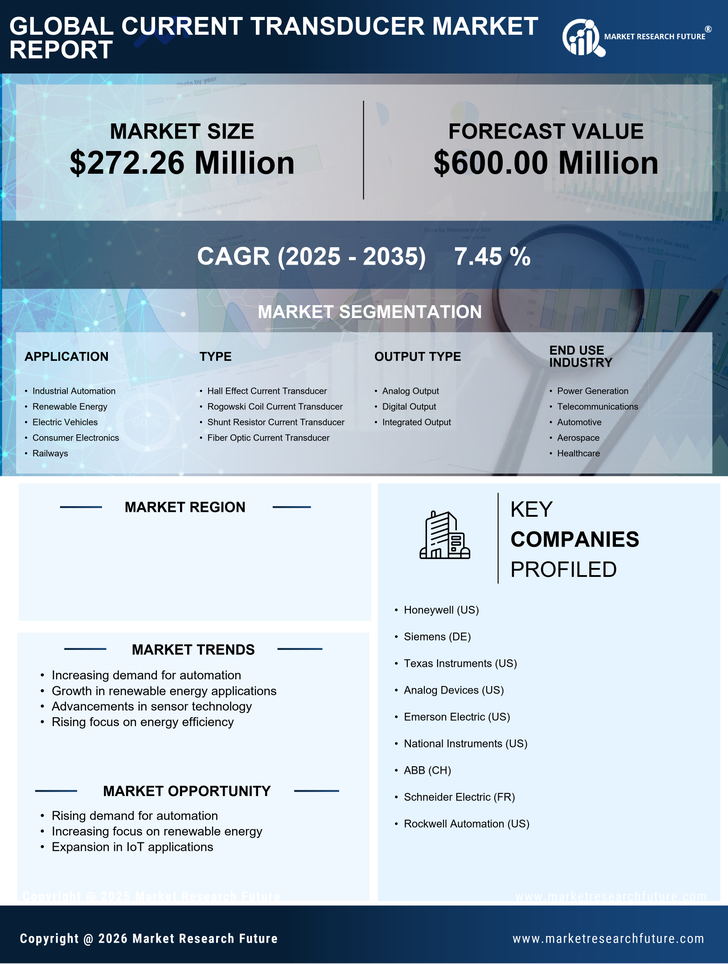
- Industrial Automation
- US Current Transducer Market
- Electric Vehicles
- Consumer Electronics
- Railways
Construction By Type (USD Million, 2025-2035)
- Hall Effect Current Transducer
- Rogowski Coil Current Transducer
- Shunt Resistor Current Transducer
- Fiber Optic Current Transducer
Construction By Output Type (USD Million, 2025-2035)
- Analog Output
- Digital Output
- Integrated Output
Construction By End Use Industry (USD Million, 2025-2035)
- Power Generation
- Telecommunications
- Automotive
- Aerospace
- Healthcare