US Drive System Market Segmentation
US Drive System Market By Drive Type (USD Million, 2025-2035)
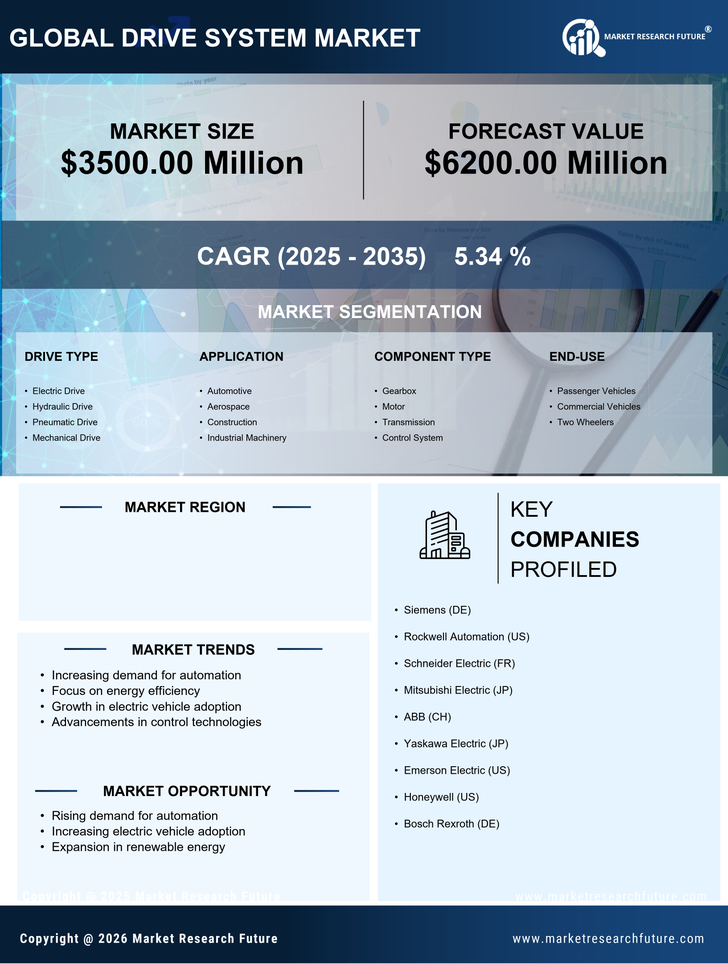
- Electric Drive
- Hydraulic Drive
- Pneumatic Drive
- Mechanical Drive
US Drive System Market By Application (USD Million, 2025-2035)
- Automotive
- Aerospace
- Construction
- Industrial Machinery
US Drive System Market By Component Type (USD Million, 2025-2035)
- Gearbox
- Motor
- Transmission
- Control System
US Drive System Market By End-Use (USD Million, 2025-2035)
- Passenger Vehicles
- Commercial Vehicles
- Two Wheelers