US Freshwater Fish Market Segmentation
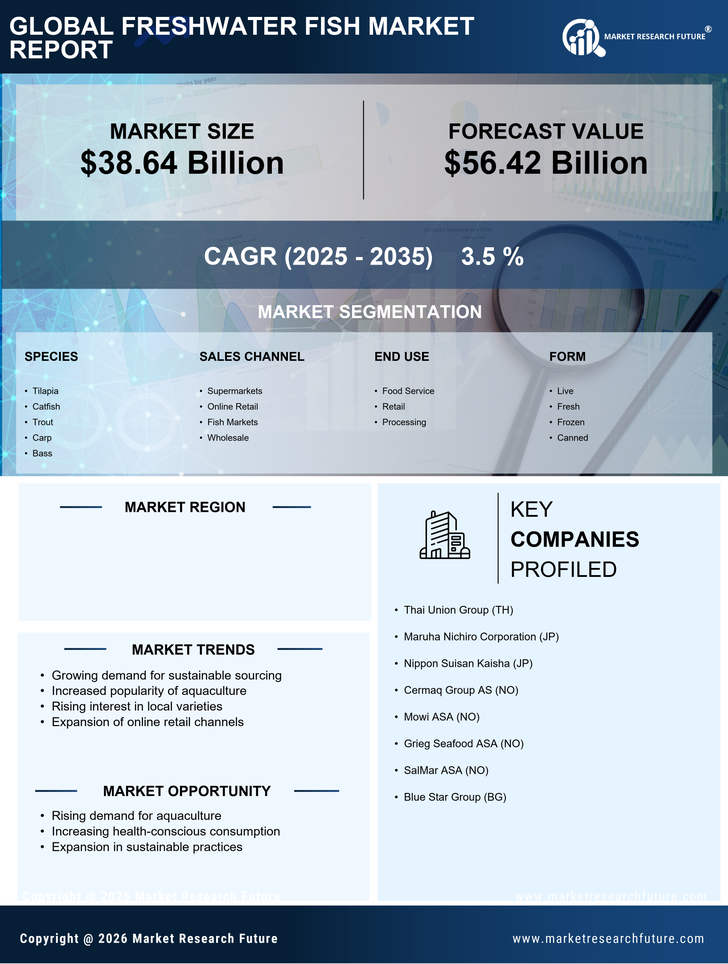
US Freshwater Fish Market By Species (USD Billion, 2025-2035)
- Tilapia
- Catfish
- Trout
- Carp
- Bass
US Freshwater Fish Market By Sales Channel (USD Billion, 2025-2035)
- Supermarkets
- Online Retail
- Fish Markets
- Wholesale
US Freshwater Fish Market By End Use (USD Billion, 2025-2035)
- Food Service
- Retail
- Processing
US Freshwater Fish Market By Form (USD Billion, 2025-2035)
- Live
- Fresh
- Frozen
- Canned