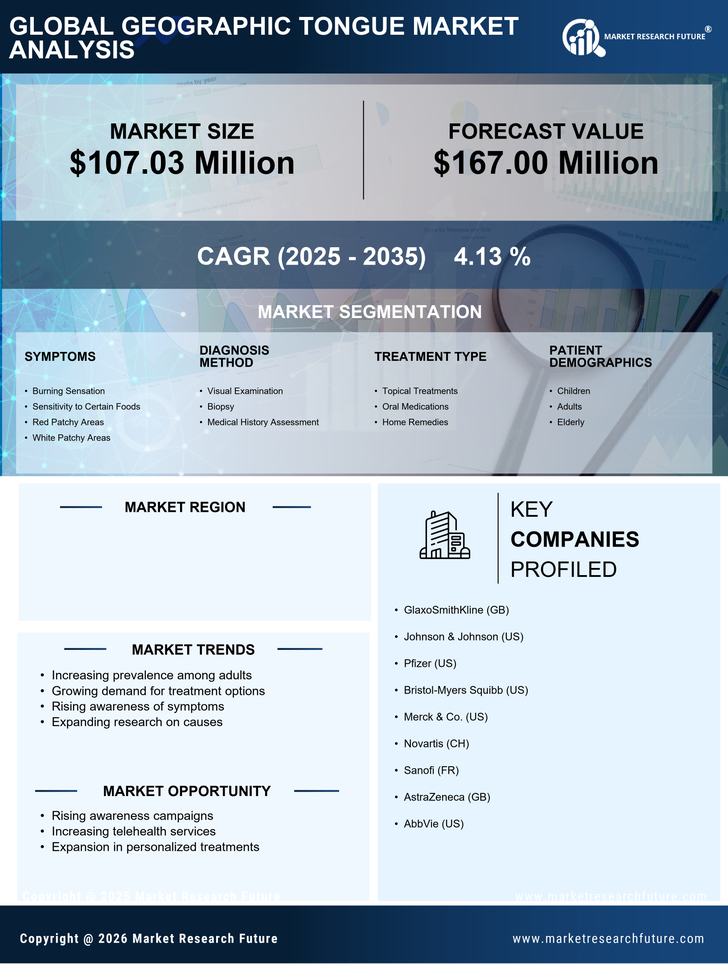
Request Free Sample ×

Kindly complete the form below to receive a free sample of this Report

* Please use a valid business email

Leading companies partner with us for data-driven Insights

clients tt-cursor
Hero Background

US Geographic Tongue Market

ID: MRFR/Pharma/18395-HCR
100 Pages
Satyendra Maurya
Last Updated: April 06, 2026
US Geographic Tongue Market Research Report By Symptoms (Burning Sensation, Sensitivity to Certain Foods, Red Patchy Areas, White Patchy Areas), By Diagnosis Method (Visual Examination, Biopsy, Medical History Assessment), By Treatment Type (Topical Treatments, Oral Medications, Home Remedies) and By Patient Demographics (Children, Adults, Elderly) - Growth & Industry Forecast 2025 To 2035
Download PDF ×

We do not share your information with anyone. However, we may send you emails based on your report interest from time to time. You may contact us at any time to opt-out.

  1. 1 SECTION I: EXECUTIVE SUMMARY AND KEY HIGHLIGHTS
    1. 1.1 EXECUTIVE SUMMARY
      1. 1.1.1 Market Overview
      2. 1.1.2 Key Findings
      3. 1.1.3 Market Segmentation
      4. 1.1.4 Competitive Landscape
      5. 1.1.5 Challenges and Opportunities
      6. 1.1.6 Future Outlook
  2. 2 SECTION II: SCOPING, METHODOLOGY AND MARKET STRUCTURE
    1. 2.1 MARKET INTRODUCTION
      1. 2.1.1 Definition
      2. 2.1.2 Scope of the study
        1. 2.1.2.1 Research Objective
        2. 2.1.2.2 Assumption
        3. 2.1.2.3 Limitations
    2. 2.2 RESEARCH METHODOLOGY
      1. 2.2.1 Overview
      2. 2.2.2 Data Mining
      3. 2.2.3 Secondary Research
      4. 2.2.4 Primary Research
        1. 2.2.4.1 Primary Interviews and Information Gathering Process
        2. 2.2.4.2 Breakdown of Primary Respondents
      5. 2.2.5 Forecasting Model
      6. 2.2.6 Market Size Estimation
        1. 2.2.6.1 Bottom-Up Approach
        2. 2.2.6.2 Top-Down Approach
      7. 2.2.7 Data Triangulation
      8. 2.2.8 Validation
  3. 3 SECTION III: QUALITATIVE ANALYSIS
    1. 3.1 MARKET DYNAMICS
      1. 3.1.1 Overview
      2. 3.1.2 Drivers
      3. 3.1.3 Restraints
      4. 3.1.4 Opportunities
    2. 3.2 MARKET FACTOR ANALYSIS
      1. 3.2.1 Value chain Analysis
      2. 3.2.2 Porter's Five Forces Analysis
        1. 3.2.2.1 Bargaining Power of Suppliers
        2. 3.2.2.2 Bargaining Power of Buyers
        3. 3.2.2.3 Threat of New Entrants
        4. 3.2.2.4 Threat of Substitutes
        5. 3.2.2.5 Intensity of Rivalry
      3. 3.2.3 COVID-19 Impact Analysis
        1. 3.2.3.1 Market Impact Analysis
        2. 3.2.3.2 Regional Impact
        3. 3.2.3.3 Opportunity and Threat Analysis
  4. 4 SECTION IV: QUANTITATIVE ANALYSIS
    1. 4.1 Medical Device, BY Symptoms (USD Million)
      1. 4.1.1 Burning Sensation
      2. 4.1.2 Sensitivity to Certain Foods
      3. 4.1.3 Red Patchy Areas
      4. 4.1.4 White Patchy Areas
    2. 4.2 Medical Device, BY Diagnosis Method (USD Million)
      1. 4.2.1 Visual Examination
      2. 4.2.2 Biopsy
      3. 4.2.3 Medical History Assessment
    3. 4.3 Medical Device, BY Treatment Type (USD Million)
      1. 4.3.1 Topical Treatments
      2. 4.3.2 Oral Medications
      3. 4.3.3 Home Remedies
    4. 4.4 Medical Device, BY Patient Demographics (USD Million)
      1. 4.4.1 Children
      2. 4.4.2 Adults
      3. 4.4.3 Elderly
  5. 5 SECTION V: COMPETITIVE ANALYSIS
    1. 5.1 Competitive Landscape
      1. 5.1.1 Overview
      2. 5.1.2 Competitive Analysis
      3. 5.1.3 Market share Analysis
      4. 5.1.4 Major Growth Strategy in the Medical Device
      5. 5.1.5 Competitive Benchmarking
      6. 5.1.6 Leading Players in Terms of Number of Developments in the Medical Device
      7. 5.1.7 Key developments and growth strategies
        1. 5.1.7.1 New Product Launch/Service Deployment
        2. 5.1.7.2 Merger & Acquisitions
        3. 5.1.7.3 Joint Ventures
      8. 5.1.8 Major Players Financial Matrix
        1. 5.1.8.1 Sales and Operating Income
        2. 5.1.8.2 Major Players R&D Expenditure. 2023
    2. 5.2 Company Profiles
      1. 5.2.1 GlaxoSmithKline (GB)
        1. 5.2.1.1 Financial Overview
        2. 5.2.1.2 Products Offered
        3. 5.2.1.3 Key Developments
        4. 5.2.1.4 SWOT Analysis
        5. 5.2.1.5 Key Strategies
      2. 5.2.2 Johnson & Johnson (US)
        1. 5.2.2.1 Financial Overview
        2. 5.2.2.2 Products Offered
        3. 5.2.2.3 Key Developments
        4. 5.2.2.4 SWOT Analysis
        5. 5.2.2.5 Key Strategies
      3. 5.2.3 Pfizer (US)
        1. 5.2.3.1 Financial Overview
        2. 5.2.3.2 Products Offered
        3. 5.2.3.3 Key Developments
        4. 5.2.3.4 SWOT Analysis
        5. 5.2.3.5 Key Strategies
      4. 5.2.4 Bristol-Myers Squibb (US)
        1. 5.2.4.1 Financial Overview
        2. 5.2.4.2 Products Offered
        3. 5.2.4.3 Key Developments
        4. 5.2.4.4 SWOT Analysis
        5. 5.2.4.5 Key Strategies
      5. 5.2.5 Merck & Co. (US)
        1. 5.2.5.1 Financial Overview
        2. 5.2.5.2 Products Offered
        3. 5.2.5.3 Key Developments
        4. 5.2.5.4 SWOT Analysis
        5. 5.2.5.5 Key Strategies
      6. 5.2.6 Novartis (CH)
        1. 5.2.6.1 Financial Overview
        2. 5.2.6.2 Products Offered
        3. 5.2.6.3 Key Developments
        4. 5.2.6.4 SWOT Analysis
        5. 5.2.6.5 Key Strategies
      7. 5.2.7 Sanofi (FR)
        1. 5.2.7.1 Financial Overview
        2. 5.2.7.2 Products Offered
        3. 5.2.7.3 Key Developments
        4. 5.2.7.4 SWOT Analysis
        5. 5.2.7.5 Key Strategies
      8. 5.2.8 AstraZeneca (GB)
        1. 5.2.8.1 Financial Overview
        2. 5.2.8.2 Products Offered
        3. 5.2.8.3 Key Developments
        4. 5.2.8.4 SWOT Analysis
        5. 5.2.8.5 Key Strategies
      9. 5.2.9 AbbVie (US)
        1. 5.2.9.1 Financial Overview
        2. 5.2.9.2 Products Offered
        3. 5.2.9.3 Key Developments
        4. 5.2.9.4 SWOT Analysis
        5. 5.2.9.5 Key Strategies
    3. 5.3 Appendix
      1. 5.3.1 References
      2. 5.3.2 Related Reports
  6. 6 LIST OF FIGURES
    1. 6.1 MARKET SYNOPSIS
    2. 6.2 US MARKET ANALYSIS BY SYMPTOMS
    3. 6.3 US MARKET ANALYSIS BY DIAGNOSIS METHOD
    4. 6.4 US MARKET ANALYSIS BY TREATMENT TYPE
    5. 6.5 US MARKET ANALYSIS BY PATIENT DEMOGRAPHICS
    6. 6.6 KEY BUYING CRITERIA OF MEDICAL DEVICE
    7. 6.7 RESEARCH PROCESS OF MRFR
    8. 6.8 DRO ANALYSIS OF MEDICAL DEVICE
    9. 6.9 DRIVERS IMPACT ANALYSIS: MEDICAL DEVICE
    10. 6.10 RESTRAINTS IMPACT ANALYSIS: MEDICAL DEVICE
    11. 6.11 SUPPLY / VALUE CHAIN: MEDICAL DEVICE
    12. 6.12 MEDICAL DEVICE, BY SYMPTOMS, 2024 (% SHARE)
    13. 6.13 MEDICAL DEVICE, BY SYMPTOMS, 2024 TO 2035 (USD Million)
    14. 6.14 MEDICAL DEVICE, BY DIAGNOSIS METHOD, 2024 (% SHARE)
    15. 6.15 MEDICAL DEVICE, BY DIAGNOSIS METHOD, 2024 TO 2035 (USD Million)
    16. 6.16 MEDICAL DEVICE, BY TREATMENT TYPE, 2024 (% SHARE)
    17. 6.17 MEDICAL DEVICE, BY TREATMENT TYPE, 2024 TO 2035 (USD Million)
    18. 6.18 MEDICAL DEVICE, BY PATIENT DEMOGRAPHICS, 2024 (% SHARE)
    19. 6.19 MEDICAL DEVICE, BY PATIENT DEMOGRAPHICS, 2024 TO 2035 (USD Million)
    20. 6.20 BENCHMARKING OF MAJOR COMPETITORS
  7. 7 LIST OF TABLES
    1. 7.1 LIST OF ASSUMPTIONS
  8. 7.1.1
    1. 7.2 US MARKET SIZE ESTIMATES; FORECAST
      1. 7.2.1 BY SYMPTOMS, 2025-2035 (USD Million)
      2. 7.2.2 BY DIAGNOSIS METHOD, 2025-2035 (USD Million)
      3. 7.2.3 BY TREATMENT TYPE, 2025-2035 (USD Million)
      4. 7.2.4 BY PATIENT DEMOGRAPHICS, 2025-2035 (USD Million)
    2. 7.3 PRODUCT LAUNCH/PRODUCT DEVELOPMENT/APPROVAL
  9. 7.3.1
    1. 7.4 ACQUISITION/PARTNERSHIP
  10. 7.4.1

US Medical Device Market Segmentation

Medical Device By Symptoms (USD Million, 2025-2035)

  • Burning Sensation
  • Sensitivity to Certain Foods
  • Red Patchy Areas
  • White Patchy Areas

Medical Device By Diagnosis Method (USD Million, 2025-2035)

  • Visual Examination
  • Biopsy
  • Medical History Assessment

Medical Device By Treatment Type (USD Million, 2025-2035)

  • Topical Treatments
  • Oral Medications
  • Home Remedies

Medical Device By Patient Demographics (USD Million, 2025-2035)

  • Children
  • Adults
  • Elderly