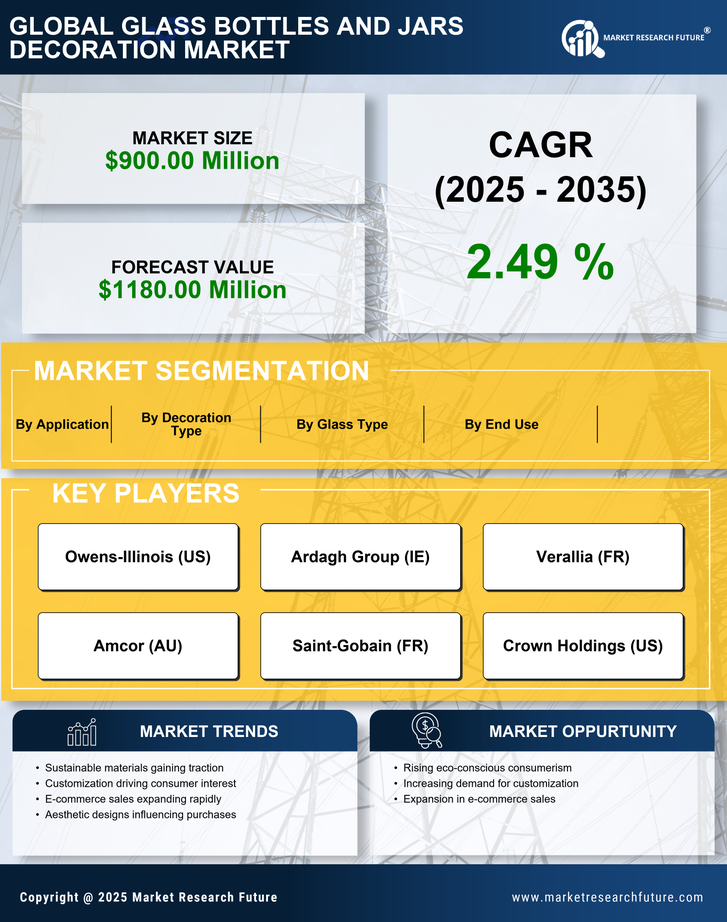
US Glass Bottles Jars Decoration Market Segmentation
US Glass Bottles Jars Decoration Market By Decoration Type (USD Million, 2025-2035)
- Screen Printing
- Etching
- Labeling
- Pad Printing
- Hot Stamping
US Glass Bottles Jars Decoration Market By End Use (USD Million, 2025-2035)
- Beverage Industry
- Food Industry
- Cosmetics Industry
- Pharmaceutical Industry
US Glass Bottles Jars Decoration Market By Glass Type (USD Million, 2025-2035)
- Recycled Glass
- Clear Glass
- Colored Glass
- Frosted Glass
US Glass Bottles Jars Decoration Market By Application (USD Million, 2025-2035)
- Personal Care Products
- Household Goods
- Beverage Packaging
- Food Packaging